ISSN (e): 2250-3021, ISSN (p): 2278-8719
Vol. 04, Issue 01 (January. 2014), ||V7|| PP 31-41
Computational Approach for Promoter Identification with data
Mining Techniques
Günay Karl, Şenol Doğan, Adem Karadağ
1International Burch University, Faculty of Engineering and IT, Department of IT, BiH,
2International Burch University,Faculty ofEngineering and IT, Department of Genetics and Bioengineering, BiH,
3Bosna Sema - Educational Institutions, Sarajevo, Bosnia and Herzegovina,
Abstract: -Recently, too much data is being produced in every field of our life. Especially in science, large amounts of data are needed to analyze in order to reveal valuable knowledge hidden in raw data. The number of DNA sequences has been growing fast since the beginning of the Human Genome Program (HGP) so it becomes increasingly important to automate the identification of functional elements in DNA. But human analysts with the traditional tools can no longer make sense. In this study, we employ data mining techniques including ANN, ANFIS and newly developed algorithms ke-REM and IREM to extract diamonds of knowledge from DNA sequences and evaluate their performances.
Keywords: -Promoter prediction, ANN, ANFIS, ke-REM, IREM,data mining, bioinformatics, DNA
I.
INTRODUCTION
Researchers are now routinely investigating the biological molecular state of a cell by measuring the simultaneous expression of tens of thousands of genes using DNA microarrays (Shelke & Deshmukh, 2007). Identification of regulatory regions such as coding region, genomic region or promoters which govern the expression of genes can be automated through Data Mining. This entails a wide range of applications such as the prediction of stock prices identifying suspected terrorists and scientific discovery like analysis of DNA microarray (Hanuman, Raghava, & Siva, 2009).
Such endeavor entails gene expression which is the process by which information from a gene is used in the synthesis of a functional gene product. Proteins are a major structural component of cells, having core responsibilities for the maintenance of shape and structure of the particular cell in addition to molecular recognition and catalysis. DNA, which forms the fundamental structural proponent for proteins, is the blueprint carrying all cell information and instructions responsible for protein synthesis and regulation.
Molecular biology posits that the information is transmitted from the DNA strand through the RNA to proteins (Taft, Pang, & Mercer, 2010) and (Corporation, 2010) in addition to small non-coding RNAs (miRNA, piRNA) and various classes of long non-coding RNAs are involved in a variety of regulatory functions (Taft, Pang, & Mercer, 2010) and (Corporation, 2010). Gene expression entails two processes; these are the transcription and translation. The transcription initiation is a very precise event occurring at specific sites with specific orientations on the chromosome with a specificity of results from the recognition by RNA polymerase holoenzyme of DNA sequences described as promoters.
The promoter is a region in the DNA molecule where the transcription occurs. In Bioinformatics predicting this location is a great challenge and thus posing a great platform for investigations on the same. With the consideration that the gene sequence data grow to huge, many computer scientists get into the biological technology, and give some methods which take advantages of digitalized power to see into gene sequences (Huang, 2003). It is of great significance to note that before the1990s‟ computer programs used for assembling coding arrays into translatable MRNA were not in existence, though various conventional techniques existed long since the 1980s and were used in the prediction of genomic DNA coding locations. Since the innovation and adoption of the digitalized techniques, prediction of the promoter has improved tremendously by each day. Such programs are GenViewer (Milanesi, Kolchanov, & Rogozin, 1993), GeneID (Guigo, Knudsen, Drake, & Smith, 1995), GenLang (Dong & Stormo, 1994), GeneParser (Stormo & Snyder, 1993), FGENEH (Solovyev, Salamov, & Lawrence, 1994), SORFIND (Hayden & Hutchinson, 1992), Xpound (Skolnick & Thomas, 1992), GRAIL (Xu, Mural, & Uberbacher, 1994), VEIL (Henderson, Salzberg, & Fasman, 1997), GenScan (Karlin & Burge, 1997).
artificial neural network shave which exhibits subtle values (Luo & Yang, 2006) (Premalatha & Aravindan, 2009).
Of these innovations the GRAIL and GeneScan are widely used in academia and industry (Hrishikesh, Nitya, & Krishna, 2011). They help predict and identify an existence of the promoter in the DNA molecule, usually by using position, weight matrices and Markov models (Liu, 2002) (Luo & Yang, 2006) and (Premalatha & Aravindan, 2009), These endeavors additionally incorporate statistical strategies and artificial intelligence. More so, the artificial neural network shave has proved to give appropriate results, though this is criticized as specificity has been affected owing to the high false positive rate (Abeel T. S., 2008) (Zhang, 2009).As well, some specialists have integrated Neural network in Bioinformatics.
In the recent past, the integration of computerization in the promoter identification and prediction has raised debate. This has come to the consideration of the utilizing of ANN, ANFIS, ke-REM and IREM.
1.1.Promoter Prediction and Its Significance
A promoter by definition is a DNA non-coding region responsible for initiating transcriptions a specific gene. They are usually located on the upstream and on the same strand of the DNA-towards the anti-sense strand‟s 3‟ region also referred to as the template strand. A promoter may be characterized by a nucleotide sequence of between 100 to 1000 base pair long (Roded, Karni, & Felder, 2007). A special enzyme, RNA polymerase, is needed for mRNA transcription. This enzyme needs to attach itself to the DNA near a gene for it to qualify to be called a promoter sequence. Sequences comprises of specific response and DNA sequences responsible for providing a fully secure primary binding site for the enzyme as well as for proteins referred to as transcription factors.
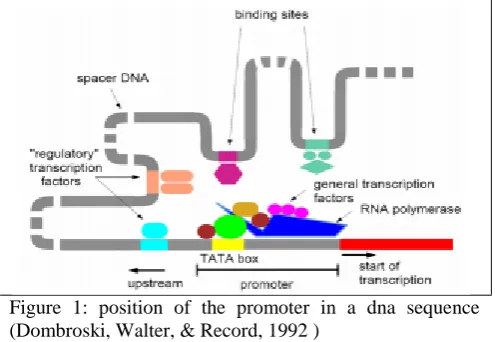
Eukaryotic and Prokaryotic promoters vary from each other. In prokaryotic organism ς70 sigma factor is able to identify specific promoter sequences, which in this case are 5‟TATAAT3‟ and 5‟TTGACA3‟ (-10 and -35 respectively) through the help of ς70 subunit of the polymerase enzyme (Dombroski, Walter, & Record, 1992 ). Eukaryotic organism on the other hand is more complex requiring at least 7 different factors for the polymerase II enzyme to bind to the promoter (Fig. 1).
Figure 1: position of the promoter in a dna sequence (Dombroski, Walter, & Record, 1992 )
The promoter intensity correlates with identity degree to the sequence but separated by the spacer length. Dense promoters are however founded closer to gene (Bujard, Brenner, & Kammerer, 1997) (Grana, Gardella, & Susskind, 1998). It has for long been thought that for transcription activity to be optimal, various promoter elements‟ combinations including -35 and -10 hexamers, must be in existence coupled with downstream and upstream regions (Bujard, Brenner, & Kammerer, 1997). According to this school of thought, RNAP works both regions of the two hexamers in sequence and promoters of A+ T-rich sequences upstream of the −35 hexamer [26] (Craig, Suh, & Record, 1995) in several E. coli or Bacillus subtilis were identified as facilitating increased transcription in vitro when accessory proteins were absent (Frisby & Zuber, 1991). Different upstream sequences show different effects on transcription increasing it from a mere 1.5 to 90 fold (Wilma, Sarah, & Salomon, 1998). Those promoter sequences that are characterized by powerful binding affinity have a direct effect on mRNA transcription.
II.
METARIAL AND METHODS
There are two core classes of the promoter prediction, namely „+‟ and „-‟. These classes will denote the existence of promoter prediction in the DNA sequence, having the „+‟ denoting for a positive indication of promoter location in the DNA sequence and the „-‟ denoting the absence of promoter locations in the DNA sequence. This research paper proposes to deal with a supervised learning technique in the prediction of promoter regions in the DNA sequence.
2.1.Collection of Data
The research sought to incorporate the E. Cole promoter gene arrays of DNA in the testing the proficiency of ANN, ANFIS, IREM, ke-REM. Such data were collected from the UCI Repository (Gabriela & Bocicor, 2012); this contains a set of 106 promoter and non-promoter instances. The research paper notes that such data is viable in the comparisons of mentioned algorithms with the models existing in the literature; additionally such information involving the use of the data set is publicly available (Frank & Asuncion, 2010). The 106 DNA arrays are composed of 57 nucleotides each. 53 of the DNA sequences in the data set had a „+‟ denoting, indicating the presence of promoter location in the DNA array. The research then sought to align the (+) parameter instances separately allowing for transcription. The following data characterize the (+) instances as observed from the experiment. One is that for every occurrence the (+) represents for the promoter positive presence, a name was also given in each instance and a classification of the DNA array was made composing of A, T, G and C stand for Adenine, Thymine, Guanine, Cytosine (Gabriela & Bocicor, 2012).
2.2.Adaptive Neuro-Fuzzy Inference System (ANFIS)
This is a Fuzzy Sugeno technique that is usually placed in a framework for adaptive systems to facilitate adaptation and learning (Jang, 1993). It enhances the utilization of least-squares and a back propagation gradient descent technique. In addition, a hybrid learning algorithm is used in the identification of the membership function parameters and fuzzy IF- Then regulations that are usually considerate of single output or singleton (Ho & Tsai, 2011). The fuzzy inference is considered to bear two inputs and a single output. An equation is here below illustrated to affirm to the fuzzy if-then rules of Takagi and Sugeno rule.
Where if x=A and y=B then z is f (x, y)
Where A and B are the fuzzy sets in the antecedents and Z = f (x, y) is a crisp function in the consequent.
F (x, y) is usually a polynomial for the input variables x and y.
Consider z= f (x, y) is a first-order Sugeno fuzzy inference system, which contains two rules. Rule 1: If x is A1 and y is B1, Then: f1 =a1 x +b1 y +c1
Rule 2: If x is A2 and y is B2, Then: f2=a2 x +b2 y +c2 ANFIS structure (Fig. 2.)
Figure 2: ANFIS structure (Muniraj & Chandrasekar, 2011)
Layer 0 is the input layer. It has no nodes where n is the number of inputs to the system.
The functionality of nodes in ANFIS can be summarized as follows (Soteris & Şencan, 2010):
Layer 1: Nodes are adaptive; membership functions (MFs) of input variables are used as node functions, and parameters in this layer are referred to as antecedent or premise parameters.
Layer 2: Outputs that indicate Nodes are the fixed using firing strengths
Layer 3: Outputs that indicate Nodes are the fixed using normalized and strong formality
2.3.Artificial Neural Network (ANN)
The artificial neuron is an enthused component in the body‟s natural neurons through computation modeling (Jain, 1996). The artificial Neural Network works in an induced principle where in instances that the body‟s neurons do receive signals through the naturally induced synapses occurring in the dendrites of the neuron, with a much intense magnitude, the ANN is induced thus releasing signal messages via the axon. In other instances the signal may be sent to other synapses and probably induce other neurons as noted by (Alverez, 2006). Usually the human brain is capacitated with the ability to hold numerous and complex operations, thus hails from the possession of numerous and enabling elements such as the complex neurons that consist of a more than 103 to 104 more neuron affiliations. This compounds the neuron coverage in the brain to approximately 1014 interconnections (Alverez, 2006) and (Kriesel, 2005).
Figure 2: Neural dendrites, axon, and synapse (Courche, 2013)
In modeling, the density of real neurons is highly exhibited, fundamentally comprising of synapses, which are compounded by the density of the respective signals, in addition this is taken under a mathematical simulation thus helping to evaluate the activation of the neuron. This moreover helps to compute the result of the artificial neuron. According to (Kriesel, 2005) this hails from the property of the ANN that they can integrate artificial neurons in the processing of information.
Usually, getting a precise definition of learning is a difficult task considering that the capability to learn is an essential characteristic of intelligence. From the experiment, it is posited that the ANN description is able to view from the efficient performance of a neuron task owing to updating of network systems. This is evidenced by the literature in (Alverez, 2006) and (Gandhi & Parekh, 2012).
One is able to obtain the desired output from the manipulation of the ANN; this is so by modifying the ANN weights. In such modifications, getting them by hand is a rather complicated and impossible task, giving supportive ground to the incorporation of ANN. In addition, (Gandhi & Parekh, 2012) and (Gershenson, 2008), algorithms may be integrated in the modifications and alignments of ANN weights.
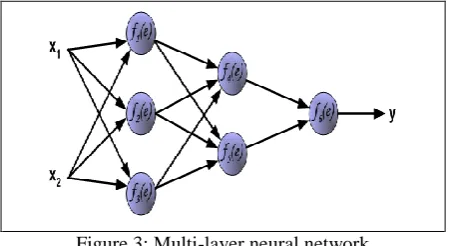
The paper acknowledges the back-propagation algorithm where ANN is aligned in layers and is simulated for a forward signal transmission, thus allowing for signal errors to be propagated on the reverse (Gershenson, 2008). The input area is the location where the neurons impact the networks and therefore initiating the output. Fig. 3 illustrates a three layered neural network having inputs and output.
Figure 3: Multi-layer neural network
A neuron posses two units that complement the products of weight coefficients and input signals with the other unit being responsible for the neuron activation function following its capability to decode linearity. The units are denoted as Signal e for adder output signal and Signal y for the output signal of non-linearity.
Consequently, the output signals‟ values are made easier to identify from each neuron in the network (Golda, 2005). (See Fig. 4)
Figure 4: Teaching Process of Multi-Layer NN
The 106 DNA sequences composing the E. coli will feature for having 4 values. These values will stand for the A, T, G and C i.e. Adenine, Thymine, Guanine and Cytosine. Training the ANN and the DNA array with the 57 nucleotides attached to each promoter instance is coupled as an ANN input. The DNA sequence instances present the network output usually a description of either (+) or (-) occurrence.
2.4.ke-REM (ke-Rule Extraction Method)
This section introduces the novel development referred to as ke-REM (ke-Rule Extraction Method) and addresses its ability in utilizing DNA promoter region predictions. As provided for above, an e.coli dataset consists of a total of 106 DNA sequences, each containing a length of 57 nucleotides. The computer science perspective expresses the dataset for e-coli as consisting of 106 instances containing 57 attributes bearing four values. The attributes for these instances can be expressed as nucleotides locations for the 57-element sequence. Each attribute accommodates 4 values, namely T-Thymine, A-Adenine, C-Cytosine and G-Guanine.
ke-REM constructs a rule-base by applying the data set attribute-value pairs. In an effort to generate a robust rule-base, attribute-value pairs with significant importance are used. The significant question at this point queries, “How are pairs with significant informational value determined?” the new ke-REM upgrade uses a “gain function” in computing the informational value for the set‟s pair. ke-REM considers the higher gain value as a higher informational value indicator. Therefore, the attribute-value with a higher value has a greater priority in the processing of rule-base for the prediction system. keREM (ke-Rule Extraction Method) was upgraded to have the ability to obtain IF-THEN rules from a given set of examples. It proactively discards encountered pitfalls commonly present in inductive learning algorithms. keREM applies the gain function value, to determine which attributes are of significant importance and are thus given a higher priority and as such, serve to further provide rules that are more commonly acceptable.
The following is a summary of the algorithm:
Step 1: In a particular training set, a person computes class distribution and probability distribution rate of every attribute-value.
Step 2: For every attribute in the data set, you compute the power of classification.
Step 3: for every attribute-value pairs, its Class-based Gain is calculated with the use of computed probability distributions, power of classification and class distribution rate.
Step 4: One rule of selection is that you can select any value whose probability distributions one for n=1. The next step is to convert the attribute-values into rules and then you mark the classified examples.
Step 5: Move to step 8.
Step 6: Starting from the first example that is unclassified, you form combinations with the n values by using the attribute-values that has a bigger gain.
Step 7: You apply each combination in all examples. Using the values that are made up of n combinations, those that match only with on class are converted into a rule. You mark the classified examples.
Step 8: In the training set, when all examples are classified, you move to step 11. Step 9: perform the expression n=n+1
Step 10: go to step 6 if n<N
2.5.IREM (Inductive Rule Extraction Method)
Usage of this technique in predicting promoter region in DNA is introduced in this section which is a newly developed IREM (Inductive Rule Extraction Method). E. coli data set is composed of 106 DNA sequences, each having a length of 57 nucleotides as described above in this paper. When engaging a digitalized mindset, E. coli data set consists of 106 instances with 57 attributes having 4 values. These attributes are defined as the position of nucleotides in the 57-element sequence with each attribute taking 4 values which are A-Adenine, C-Cytosine, G-Guanine and T-Thymine. IREM builds its rule-base using attribute-value pairs in the set.
When generating a rule-base with powerful rule, attribute-value pairs with higher importance are employed. Consequently, a significant quest develops an “how the pairs with a higher information value can be determined”. IREM applies its own “cost function” to calculate the information value of the pair in the set. It deals with regard to the values of the lower cost as an indicator of higher information value. With this, attribute-value with the higher attribute-value is given a greater priority in the process of producing rule-base of the predicting system as described by the following algorithm;
Step1. In a given E. coli data set (training set), distribution of probability of the each attribute-value pairs is computed.
Step2. The class-based entropy is computed for each attribute and value.
Step3. By using computed probability distributions and class-based entropy, the cost of the pairs is calculated. Step4. Any value of which class-based entropy equals zero for n = 1 can be selected as a rule. The pairs are converted into rules. The classified examples (instances) are marked.
Step5. Go to step8.
Step6. Beginning of the first unclassified example, combinations with no values are formed by taking the value of the attributes whose cost is smaller.
Step7. Each combination is applied to all of the examples in the set. From the values composed of n combinations, those matching with only in class are converted into a rule. The classified examples are marked. Step8. If all of the examples in the training set are classified then go to step11.
Step9. Perform n = n + 1 expression. Step10. If n < N the go to step6
Step11 If there is more than one rule representing the same examples; the most general one is selected. Step12. End.
III.
RESULTS AND DISCUSSION
An experiment was carried out on the approach for promoter sequence identification using the ANN, ANFIS, ke-REM and IREM with a much consideration of providing a comparison with other existing similar approaches.
A standard 5-fold cross-validation was integrated into the evaluation of the ANN performance by having the dataset being randomly portioned into 5 subsets. This classification ensures an equal ratio of (+) and (-) promoter locations in the DNA array.
The training occurred on the ANN for a series 5 times engaging only 4 subsets for each training while as retaining the remaining 5 for testing. As a result, 5 models were established during the cross-validation. Additionally, a final prediction performance was carried out on the subsets evaluating the average results from the experiment..
The performance of the promoter predictions was evaluated using the threshold parameters; accuracy (ACC), Mathew‟s Correlation Coefficient (MCC), sensitivity (SE) and specificity (SP). A couple of equations were integrated to affirm to the results. These were;
SE=TP/(TP+FN) (1)
SP=TN/(TN+FP) (2)
ACC= (TP+TN) / (TP+TN+FP+FN) (3)
MCC=((TP*TN)-(FN*FP))/SQRT((TP+FN)*(TN+FP)*(TP+FP)*(TN+FN)) (4)
TP is true positive (promoter predicted as promoter). TN is false negative (promoter predicted as non- promoter) TN is true negative (non- promoter predicted as non- promoter). FP is false positive (non- promoter predicted promoter).
The detailed performance of modules in term of SE, SP, ACC and MCC is shown in the following tables.
3.1. Experiments with ANN
Table 1: Performance of ANN-1
Hidden Layer /
The number of neuron Transfer Function Learning Algorithms MCC SE SP ACC
40-1 logsig trainrp 0.69 0.75 0.92 0.84
40-1 logsig traincgp 0.70 0.71 0.97 0.84
40-1 logsig trainscg 0.66 0.72 0.92 0.82
Table 2: Performance of ANN-2
Hidden Layer / The number of neuron
Transfer
Function Learning Algorithms MCC SE SP ACC
75-1 logsig trainrp 0.67 0.75 0.91 0.83
75-1 logsig traincgp 0.67 0.75 0.91 0.83
75-1 logsig trainscg 0.64 0.72 0.91 0.82
Table 3: Performance of ANN-3
Hidden Layer / The number of neuron
Transfer Function
Learning
Algorithms MCC SE SP ACC
100-1 Logsig trainrp 0.62 0.75 0.86 0.81
100-1 Logsig traincgp 0.69 0.69 0.97 0.83
100-1 Logsig trainscg 0.65 0.71 0.92 0.82
The experiment in determining promoter prediction and identification achieved a result by 0, 84 (ACC) produced by ANN with one hidden layer having 40 neurons, logsig transfer function and trainrp learning algorithm.
3.2.Experiments with ANFIS
When ANFIS was used, in order to generate a FIS, function which uses fuzzy, c-means (FCM) clustering was employed. Genfis3 generates a Sugeno-type FIS structure was fed with input data Xin (57-element nucleotide sequence) and output data x-out (two classes, promoter or non-promoter).
The results are showed in the following tables.
ANFIS info: Number of nodes: 9340, Number of linear parameters: 4640, Number of nonlinear parameters: 9120, Total number of parameters: 13760, Number of training data pairs: 80, Number of checking data pairs: 0, Number of fuzzy rules: 80
Table 4: Performance of ANFIS
1. Model 2. Model 3. Model 4. Model 5. Model Average
ACC 0.65 0.75 0.75 0.70 0.65 0.7008
SE 0.80 1.00 0.90 0.80 0.77 0.8538
SP 0.50 0.50 0.60 0.60 0.54 0.5477
MCC 0.31 0.58 0.52 0.41 0.32 0.4281
From the experiment on promoter prediction the best results were found to be at 0.70 (ACC) having been as a result of a non-satisfactory relationship as compared to ANN.
3.3.Experiments with IREM
distributions of each nucleotide forming DNA sequence in terms of promoter and non-promoter classes. Secondly, entropy of training set was found. Despite this endeavor the entropy was found not to contain class information for the attribute-value pairs. Thus, using the entropy of the training set and the dispersals of probability of the attribute-value, class-based entropy was computed for each value in the DNA sequence data set. In such way, rules produced by the algorithm were formed by attribute-value whose information value produced a maximum. Table 5 illustrates the detailed performance of module in term of SE, SP, ACC and MCC.
Table 5: Performance of IREM
1. Model 2. Model 3. Model 4. Model 5. Model Average
ACC 0.75 0.95 0.80 0.95 0.69 0.8285
SE 0.80 1.00 0.80 1.00 0.54 0.8277
SP 0.70 0.90 0.80 0.90 0.85 0.8292
MCC 0.50 0.90 0.60 0.90 0.40 0.6632
The ability to can compute class-based entropy of each attribute-value in a given training set is considered the most important feature of key-REM algorithm. The writer places focus on works on the probability distributions of each nucleotide forming DNA sequence in terms of promoter and non-promoter classes. Secondly, entropy of training set was found. Despite this endeavor the entropy was found not to contain class information for the attribute-value pairs. Thus, using the entropy of the training set and the distributions of probability of the attribute-value, class-based entropy was computed for each value in the DNA sequence data set. In such way, rules produced by the algorithm were formed by attribute-value whose information value produced a maximum.
Table 6: Performance of ke-REM
1. Model 2. Model 3. Model 4. Model 5. Model Average
ACC 0.75 0.90 0.80 0.90 0.69 0.8085
SE 0.80 0.90 0.80 1.00 0.54 0.8077
SP 0.70 0.90 0.80 0.80 0.85 0.8092
MCC 0.50 0.80 0.60 0.82 0.40 0.6246
3.4.Evaluating The Performance of The Algorithms Using a “Leave-One-Out” Methodology
A cross-validation using a “leave-one-out” methodology was applied in the prediction and identification of the promoter location in DNA as described there in the Literature. Leave-one-out cross-validation (LOOCV) is a special case of k-fold cross-cross-validation where k equals the number of instances in the data. Particularly, nearly all the data except for a single observation are used for training and the model is tested on that single observation giving an accurate estimate known to be almost unbiased as indicated by (Efron, 1983). In Bioinformatics, LOOCV is still widely used when the available data are very rare or where only dozens of data samples are available.
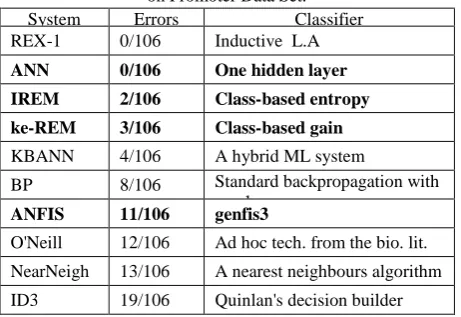
Table 7:The Errors of Some Machine Learning Algorithms on Promoter Data Set.
System Errors Classifier
REX-1 0/106 Inductive L.A
ANN 0/106 One hidden layer
IREM 2/106 Class-based entropy
ke-REM 3/106 Class-based gain
KBANN 4/106 A hybrid ML system
BP 8/106 Standard backpropagation with one layer
ANFIS 11/106 genfis3
O'Neill 12/106 Ad hoc tech. from the bio. lit.
NearNeigh 13/106 A nearest neighbours algorithm
Compared to the classifiers already applied in the literature for promoter prediction (see Table 7), ANN, ke-REM and Ike-REMintroduced in this paper outperforms existing classifier for promoter prediction: it is better than KB, ID3, O‟Neill, NN and BP, considering the error of the classification. But, ANFIS is not sufficient classifier in the proposed configuration.
IV.
CONCLUSIONS
We pose that promoter prediction and identification is an indispensable package in the Bioinformatics field, considering a digitalized approach. The ANN, ANFIS, ke-REM and IREM pose a great stride in this endeavor. Based on the structural and functional aspects of the ANN, ANFIS, ke-REM and IREM, there is the impact caused by the transmission of information through the network facilitating changes in the entire network based on the input and output.
From these successful results, the author notes that an integration of ANN, ANFIS, ke-REM and IREM for promoter prediction transfers to great and appropriate results thereby providing for ground to endeavor much more in improving promoter prediction and identification. But the results of the experiment employed ANFIS shows that Adaptive Neuro-Fuzzy Inference System is not an adequate method for prediction of promoter. As a future research, in order to increase accuracy of the ANFIS, the dimensionality of this dataset should be reduced by means of a feature selection process.
REFERENCES
[1] Abeel, T. S. (2008). Generic eukaryotic core promoter prediction using structural features of DNA. Genome Research, 18 (2), 310-323.
[2] Abeel, T., Saeys, Y., Bonnet, E., & Rouzé, P. (2008). Generic eukaryotic core promoter prediction using structural features of DNA. Genome Research, 18 (2), 310-323.
[3] Alverez, D. G. (2006). Artificial Neural Network. Spain: Edugila.
[4] Bujard, H., Brenner, M., & Kammerer, W. (1997). Structure-function relationship of Escherichia coli promoters.
New York: Elsevier.
[5] Clancy, S. (2008). Nature Education. DNA transcription, 1 (1), 41.
[6] Corporation, L. T. (2010). Introduction to Gene Expression. Life Technologies Corporation.
[7] Courche, J. (2013). Terminal Axon Branching Is Regulated by the LKB1-NUAK1 Kinase Pathway via Presynaptic Mitochondrial Capture. US: Cell.
[8] Craig, M., Suh, M. L., & Record, T. (1995). HOz and DNase I probing of Es70RNA polymerase-l PR promoter open complexes: Mg21binding and its structural consequences at the transcription start site. Bio-chemistry , 15624–15632. [9] Dombroski, A., Walter, W., & Record, M. (1992 ). Polypeptides containing highly conserved regions of transcription
initiation factors 70 exhibit specificity of binding to promoter DNA. Cell , 501–512.
[10] Dong, S., & Stormo, G. (1994). Gene structure prediction by linguistic methods. Genomics (23), 540-551.
[11] Efron, B. (1983). Estimating the error rate of a prediction rule: improvement on cross-validation. J. Am. Stat. Assoc.
(78), 316–331.
[12] Frank, A., & Asuncion, A. (2010). UCI machine learning repository. Retrieved from http://archive.ics.uci.edu/ml/
[13] Frisby, D., & Zuber, P. (1991). Analysis of the upstream activating sequence and site of carbon and nitrogen source repression in the promoter of anearly-induced sporulation gene of Bacillus subtilis. Bacteriol , 7557–7564.
[14] Gabriela, C., & Bocicor, M.-I. (2012). Promoter Sequences Prediction Using Relational Association Rule Mining.
Evolutionary Bioinformatics, 8, 181-196.
[15] Gandhi, J., & Parekh, S. (2012). Deployment of Neural Network on Multi-Core Architecture. International Journal of Engineering Research & Technology (IJERT) , 1-5.
[16] Gershenson, C. (2008). ANN for beginner. US: Arxiv.
[17] Golda, W. A. (2005). Principles of training multi-layer neural network using backpropagation. Retrieved from Katedra Elektroniki AGH: http://galaxy.agh.edu.pl/~vlsi/AI/backp_t_en/backprop.html
[18] Gordon, J., Towsey, M., & Hogan, J. (2006). Improved prediction of bacterial transcription start sites. Bioinformatics , 22 (2), 142-148.
[19] Grana, D., Gardella, T., & Susskind, M. M. (1998). The effects of mutations in the ant promoter of phage P22.
Genetics , 319–327.
[20] Guigo, M., & Burset, R. (1996). Evaluation of gene structure prediction programs. Genomics, 3 (34), 353-367. [21] Guigo, R., Knudsen, S., Drake, N., & Smith, T. (1995). Prediction of gene structure. Journal of Molecular Biology
(226), 141-157.
[22] Hanuman, T., Raghava, M., & Siva, A. (2009). Performance Comparative in Classification Algorithms Using Real Datasets. Comput Sci Syst Bio, 2, 97-100.
[23] Hayden, G., & Hutchinson, M. (1992). The prediction of exons through an analysis of spliceable open reading frames. Nucleic Acids Research (20), 3453-3462.
[24] Henderson, J., Salzberg, S., & Fasman, K. (1997). Finding genes in DNA with a hidden Markov model. Journal of Computational Biology, 2 (4), 127-141.
[25] Ho, Y., & Tsai, T. (2011). Comparing ANFIS and SEM in linear and nonlinear forecasting of new product development performance. Expert Syst Appl (38), 6498-6507.
[27] Huang, J.-W. (2003). Promoter Prediction in DNA Sequences. Kaohsiung,: National Sun Yat-sen University. [28] Jain, A. K. (1996). ANN. Michigan : Michigan State University.
[29] Jang, J. (1993). ANFIS: Adaptive-network-based fuzzy inference systems. IEEE Trans Syst Man Cybern (23), 665-685.
[30] Karlin, C., & Burge, C. (1997). Prediction of complete gene structures in human genomic DNA. J. Mol. Biol (268:), 78-94.
[31] Kliman, R., & Hoopes, L. (2010). Essentials of Cell Biology. Nature Education. [32] Kriesel, D. (2005). A Brief Introduction to Neural Networks . US: Snipe.
[33] Liu, R. a. (2002). Consensus promoter identification in the human genome utilizing expressed gene markers and gene modelling. Genome Research (12), 462-469.
[34] Luo, Q., & Yang, W. a. (2006). Promoter recognition based on the interpolated Markov chains optimized via simulated annealing and genetic algorithm. Recognition Letters Pattern, 9 (27), 1031-1036.
[35] Milanesi, L., Kolchanov, N., & Rogozin, I. (1993). GenViewer: A computing tool for protein coding regions prediction in nucleotide sequences. the 2nd International Congress on Bioinformatics, Supercomputing and Complex Genome Analysis,. 573-587.
[36] Muniraj, C., & Chandrasekar, S. (2011). Adaptive Neurofuzzy Inference System-Based Pollution Severity Prediction of Polymeric Insulators in Power Transmission Lines. Advances in Artificial Neural Systems, 2011, 9.
[37] Nissen, S. (2005). Neural Networks Made Simple. US: Source Forge.
[38] O'Connor, C. M., & Adams, U. J. (2010). Essentials of Cell Biology. Cambridge: NPG Education.
[39] Óscar, B., & Santiago, B. (2011). Cnn-promoter, new consensus promoter prediction program. Revista EIA (15), 153-164.
[40] Pe'er, D. (2003). From Gene Expression To Molecular Pathways. Hebrew : Hebrew University.
[41] Premalatha, C., & Aravindan, C. a. (2009). On improving the performance of promoter prediction classifier for eukaryotes using fuzzy based distribution balanced stratified method. Proceedings of the International Conference on Advance in Computing, Control, and Telecommunication Technologies IEEE,. ACT.
[42] Roded, S. S., Karni, S., & Felder, Y. (2007). Promoter Sequence Analysis, Lecture 11,. Analysis of Biological Networks .
[43] Rojas, R. (1996). Neural Networks: A Systematic Introduction. Berlin: Springer.
[44] Rumelhart, D., & McClelland, J. (1986). Parallel Distributed Processing. Cambridge: MIT Press.
[45] Shelke, R., & Deshmukh, V. M. (2007). Computational analysis of DNA microarray data using data mining.
Biosciences Biotechnology Research Asia, 4, 321-324.
[46] Skolnick, A., & Thomas, M. (1992). A probabilistic model for detecting coding regions in DNA sequences. IMA J. Math. Appl. Med. Biol. (11), 149-160.
[47] Abeel, T. S. (2008). Generic eukaryotic core promoter prediction using structural features of DNA. Genome Research, 18 (2), 310-323.
[48] Abeel, T., Saeys, Y., Bonnet, E., & Rouzé, P. (2008). Generic eukaryotic core promoter prediction using structural features of DNA. Genome Research, 18 (2), 310-323.
[49] Alverez, D. G. (2006). Artificial Neural Network. Spain: Edugila.
[50] Bujard, H., Brenner, M., & Kammerer, W. (1997). Structure-function relationship of Escherichia coli promoters.
New York: Elsevier.
[51] Clancy, S. (2008). Nature Education. DNA transcription, 1 (1), 41.
[52] Corporation, L. T. (2010). Introduction to Gene Expression. Life Technologies Corporation.
[53] Courche, J. (2013). Terminal Axon Branching Is Regulated by the LKB1-NUAK1 Kinase Pathway via Presynaptic Mitochondrial Capture. US: Cell.
[54] Craig, M., Suh, M. L., & Record, T. (1995). HOz and DNase I probing of Es70RNA polymerase-l PR promoter open complexes: Mg21binding and its structural consequences at the transcription start site. Bio-chemistry , 15624–15632. [55] Dombroski, A., Walter, W., & Record, M. (1992 ). Polypeptides containing highly conserved regions of transcription
initiation factors 70 exhibit specificity of binding to promoter DNA. Cell , 501–512.
[56] Dong, S., & Stormo, G. (1994). Gene structure prediction by linguistic methods. Genomics (23), 540-551.
[57] Efron, B. (1983). Estimating the error rate of a prediction rule: improvement on cross-validation. J. Am. Stat. Assoc.
(78), 316–331.
[58] Frank, A., & Asuncion, A. (2010). UCI machine learning repository. Retrieved from http://archive.ics.uci.edu/ml/ [59] Frisby, D., & Zuber, P. (1991). Analysis of the upstream activating sequence and site of carbon and nitrogen source
repression in the promoter of anearly-induced sporulation gene of Bacillus subtilis. Bacteriol , 7557–7564.
[60] Gabriela, C., & Bocicor, M.-I. (2012). Promoter Sequences Prediction Using Relational Association Rule Mining.
Evolutionary Bioinformatics, 8, 181-196.
[61] Gandhi, J., & Parekh, S. (2012). Deployment of Neural Network on Multi-Core Architecture. International Journal of Engineering Research & Technology (IJERT) , 1-5.
[62] Gershenson, C. (2008). ANN for beginner. US: Arxiv.
[63] Golda, W. A. (2005). Principles of training multi-layer neural network using backpropagation. Retrieved from Katedra Elektroniki AGH: http://galaxy.agh.edu.pl/~vlsi/AI/backp_t_en/backprop.html
[64] Gordon, J., Towsey, M., & Hogan, J. (2006). Improved prediction of bacterial transcription start sites. Bioinformatics , 22 (2), 142-148.
[65] Grana, D., Gardella, T., & Susskind, M. M. (1998). The effects of mutations in the ant promoter of phage P22.
Genetics , 319–327.
[67] Guigo, R., Knudsen, S., Drake, N., & Smith, T. (1995). Prediction of gene structure. Journal of Molecular Biology
(226), 141-157.
[68] Hanuman, T., Raghava, M., & Siva, A. (2009). Performance Comparative in Classification Algorithms Using Real Datasets. Comput Sci Syst Bio, 2, 97-100.
[69] Hayden, G., & Hutchinson, M. (1992). The prediction of exons through an analysis of spliceable open reading frames. Nucleic Acids Research (20), 3453-3462.
[70] Henderson, J., Salzberg, S., & Fasman, K. (1997). Finding genes in DNA with a hidden Markov model. Journal of Computational Biology, 2 (4), 127-141.
[71] Ho, Y., & Tsai, T. (2011). Comparing ANFIS and SEM in linear and nonlinear forecasting of new product development performance. Expert Syst Appl (38), 6498-6507.
[72] Hrishikesh, M., Nitya, S., & Krishna, M. (2011). An ANN-GA model based promoter prediction in Arabidopsis thaliana using tilling microarray data. Bioinformation, 6 (6), 240–243.
[73] Huang, J.-W. (2003). Promoter Prediction in DNA Sequences. Kaohsiung,: National Sun Yat-sen University. [74] Jain, A. K. (1996). ANN. Michigan : Michigan State University.
[75] Jang, J. (1993). ANFIS: Adaptive-network-based fuzzy inference systems. IEEE Trans Syst Man Cybern (23), 665-685.
[76] Karlin, C., & Burge, C. (1997). Prediction of complete gene structures in human genomic DNA. J. Mol. Biol (268:), 78-94.
[77] Kliman, R., & Hoopes, L. (2010). Essentials of Cell Biology. Nature Education. [78] Kriesel, D. (2005). A Brief Introduction to Neural Networks . US: Snipe.
[79] Liu, R. a. (2002). Consensus promoter identification in the human genome utilizing expressed gene markers and gene modelling. Genome Research (12), 462-469.
[80] Luo, Q., & Yang, W. a. (2006). Promoter recognition based on the interpolated Markov chains optimized via simulated annealing and genetic algorithm. Recognition Letters Pattern, 9 (27), 1031-1036.
[81] Milanesi, L., Kolchanov, N., & Rogozin, I. (1993). GenViewer: A computing tool for protein coding regions prediction in nucleotide sequences. the 2nd International Congress on Bioinformatics, Supercomputing and Complex Genome Analysis,. 573-587.
[82] Muniraj, C., & Chandrasekar, S. (2011). Adaptive Neurofuzzy Inference System-Based Pollution Severity Prediction of Polymeric Insulators in Power Transmission Lines. Advances in Artificial Neural Systems, 2011, 9.
[83] Nissen, S. (2005). Neural Networks Made Simple. US: Source Forge.
[84] O'Connor, C. M., & Adams, U. J. (2010). Essentials of Cell Biology. Cambridge: NPG Education.
[85] Óscar, B., & Santiago, B. (2011). Cnn-promoter, new consensus promoter prediction program. Revista EIA (15), 153-164.
[86] Pe'er, D. (2003). From Gene Expression To Molecular Pathways. Hebrew : Hebrew University.
[87] Premalatha, C., & Aravindan, C. a. (2009). On improving the performance of promoter prediction classifier for eukaryotes using fuzzy based distribution balanced stratified method. Proceedings of the International Conference on Advance in Computing, Control, and Telecommunication Technologies IEEE,. ACT.
[88] Roded, S. S., Karni, S., & Felder, Y. (2007). Promoter Sequence Analysis, Lecture 11,. Analysis of Biological Networks .
[89] Rojas, R. (1996). Neural Networks: A Systematic Introduction. Berlin: Springer.
[90] Rumelhart, D., & McClelland, J. (1986). Parallel Distributed Processing. Cambridge: MIT Press.
[91] Shelke, R., & Deshmukh, V. M. (2007). Computational analysis of DNA microarray data using data mining.
Biosciences Biotechnology Research Asia, 4, 321-324.
[92] Skolnick, A., & Thomas, M. (1992). A probabilistic model for detecting coding regions in DNA sequences. IMA J. Math. Appl. Med. Biol. (11), 149-160.
[93] Solovyev, V., Salamov, A., & Lawrence, C. (1994). Prediction of internal exons by oligonucleotide composition and discriminant analysis of spliceable open reading frames. Nucleic Acids Research (22), 5156-5163.
[94] Soteris, K., & Şencan, A. (2010). Artificial Intelligence Techniques in Solar Energy Applications. Solar Collectors and Panels, Theory and Applications , 315-340.
[95] Stormo, E., & Snyder, E. (1993). Identification of coding regions in genomic DNA sequences: An application of dynamic programming and neural networks. Nucleic Acids Research (21), 607-613.
[96] Taft, R., Pang, K., & Mercer, T. (2010). a Non-coding RNAs: regulators of disease. Journal of Pathology (220), 126-139.
[97] Takagi, T., & Sugeno, M. (1985). Derivation of fuzzy control rules from human operator‟s control actions. IFAC Symp Fuzzy Inform. Knowledge Representation and Decision Analysis , (pp. 55-60).
[98] Wang, M., Yin, M., & Jason, T. (2013). GeneScout: a data mining system for predicting vertebrate genes in genomic DNA sequences. Information Sciences, 163 (Special issue), 201-218.
[99] Wilma, R., Sarah, A., & Salomon, J. (1998). Escherichia Colipromoters With UP Elements Of Different Strengths: Modular Structure Of Bacterial Promoters. Journal Of Bacteriology , 5375–5383.