INTRODUCTION
Carbamide is physiologically very important. It is the chief nitrogenous product of protein metabolism. Carbamide has a melting point of 132 °C, soluble in water and ethanol, but insoluble in ether. Carbamide is used for preparing
www.orientjchem.org
An International Open Free Access, Peer Reviewed Research Journal CODEN: OJCHEG
2015, Vol. 31, No. (3): Pg. 1571-1586
Synthesis, Structural Visualization, Spectroscopic, and
Thermal Studies of Charge Transfer Cu(II), Ni(II) and Zn(II)
Bromides-carbamide Complexes at Elevated Temperature
KHLOOD ABOU-MELHA
1*, MOAMEN S. REFAT
2,3and KHALED M. ELSABAWY
2,41Department of Chemistry, Q1 Faculty of Science of Girls, Abha, King Khalid University, Abha, 2Department of Chemistry, Faculty of Science, Taif University, 888 Taif, Kingdom Saudi Arabia
Saudi Arabia
3Department of Chemistry, Faculty of Science, Port Said, Port Said University, Egypt 4Materials Science Unit, Chemistry Department, Faculty of Science,
Tanta University, 31725, Tanta-Egypt
*Correspondnig author E-mail: [email protected] http://dx.doi.org/10.13005/ojc/310336
(Received: June 29, 2015; Accepted: August 22, 2015) ABSTRACT
In the present study, the composition and structure of Cu(II), Ni(II) and Zn(II) compounds resulted from the chemical reactions of copper(II), nickel(II) and zinc(II) bromide salts with carbamide in aqueous media at 95 oC have been investigated, using IR, electron spin resonance ESR and x-ray powder diffraction spectroscopy as well as thermal analysis TG/DTG/DSC. The Cu2(OH)3Br, [Ni2(NCO)2(H2O)2(Br)2], and ZnCO3.xH2O compounds were achieved by a novel synthetic route through with a low cost precursor like carbamide. The infrared spectra of the results indicate absence of the individual bands of carbamide, but exhibited of the distinguished bands of hydroxyl, isocyanate, NCO, and ionic carbonate, CO32– for Cu(II), Ni(II) and Zn(II) compounds, respectively. Visualized investigations were performed to confirm crystal structure, validity and stability of the product compounds. A general reaction mechanisms describing the preparation of Cu(II), Ni(II), and Zn(II) compounds were discussed.
Key words: carbonate CO32–, Isocyanate ion, Infrared spectra, X-ray, carbamide.
formaldehyde-Carbamide resin (plastics)1,
barbiturates2, and fertilizers3-6. Carbamide is also
extensively used in the paper industry to soften cellulose and has been used to promote healing in infected wounds and many other applications in the field of medicine7-9. Some metal-carbamide
the platinum-carbamide complex which is used as antitumor10.
Yamaguchi and Stewart11, 12 were assigned
all of the observed frequencies in the spectra of carbamide and carbamide-d4. The two vibrations of the frequencies at 1686 and 1603cm-1 were
assigned as the 1686 cm-1 band due to CO
stretching vibration and the 1603 cm-1 band for NH 2
bending motion. The calculations studied by Yamaguchi showed that for the band at 1686 cm-1,
the contribution of the NH2 bending motion is greater than that of CO stretching motion. The infrared bands of carbamide-d4 observed at 1245 and 1154 cm-1 are assigned to ND
2 bending
vibrations. This assignment is consistent with the observed depolarization degrees of the Raman lines. The 1464cm-1 frequency of carbamide is
assigned to the CN stretching vibration. The corresponding frequency of carbamide-d4 is obser ved at 1490cm-1. The 1150cm-1 band is
assigned to NH2 rocking vibrations.
The reactions between transition metal ions and carbamide at room temperature have been studied extensively13-17. The infrared spectra of these
complexes clearly indicated that carbamide molecule behaves as a mono dentate ligand and coordinates to the metal ions through the oxygen atom and not the nitrogen atom.
The nature of the reaction products depend strongly on the type of metal ions and so the metal salt used. The novelty in our previously studies18-27
were oriented to the reaction of carbamide ligand with different metals such as Co(II), pb(II), Sn(II), Cr(III), Fe(III), Au(III), Sn(IV), V(V) and Mo(IV) at high temperature which demonstrate that the types of metal ions beside their anions have a pronounced effect on the nature of the reaction products. The published papers were trended for the reaction of carbamide with different metal salts at elevated temperature lead to discovering a novel method for preparation pbCO3 and CoCO3 21, lanthanide
carbonates23,27, limonite, FeO(OH)20,
2ZnCO3.3Zn(OH)219, SnOCl 2.2H2O
18, (Cr
2O3, MnO2,
MoO3 and WO3) oxides resulted from a novel oxidation reduction reaction between (K2CrO4 or K2Cr2O7), KMnO4, Na2MoO4 and Na2WO4, respectively, with carbamide in an aqueous solution
at ~ 85 oC27.
The sunshine side in this study was undertaken to identify the nature of the reaction mechanisms of the products resulted during the reaction of carbamide with CuBr2,NiBr2 or ZnBr2 at 95 oC for 16 hrs in aqueous media. The reaction
products were isolated as solids and characterized well by X-ray diffraction reinforced and supported with visualization studies as well as spectroscopic and thermal analyses tools.
EXPERIMENTAL Materials and synthesis
All chemicals used throughout this work were analytical pure. The Cu2(OH)3Br, [Ni2(NCO)2(H2O)2(Br)2], and ZnCO3.xH2O compounds were prepared by mixing an aqueous solutions (100 ml) of 0.1M of carbamide with 0.01M of the respective CuBr2,NiBr2 or ZnBr2 salts. The mixtures were heated at 95 oC for 16 hrs in a hot
plate. The solid products compounds were filtered off, washed several times with hot water, dried at 80
oC in an oven for 3 hours and then placed in vacuo
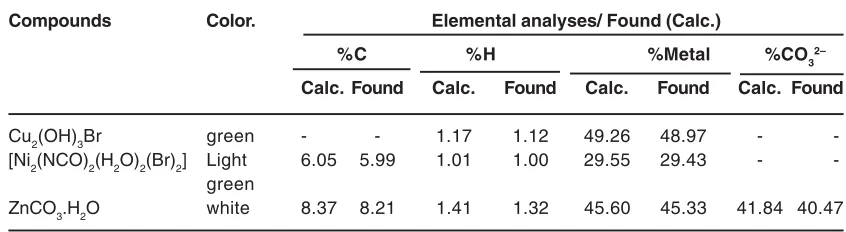
over anhydrous calcium chloride. The yields of the obtained Cu(II), Ni(II), and Zn(II) compounds were varied in the range 63-to-77% depending upon the type of metal as well as on the counter ions associated with the metal ion. The elemental analyses for Cu2(OH)3Br, [Ni2(NCO)2(H2O)2(Br)2], and ZnCO3.xH2O compounds (Table 1) obtained during the reaction of carbamide with the respective metal bromide salts almost the same and indicate the absence of nitrogen element.
Instruments
The elemental analyses of carbon, hydrogen and nitrogen contents were performed by the microanalysis unit at Cairo University, Egypt, using a Perkin Elmer CHN 2400 (USA). The infrared spectra with KBr discs were recorded on a Shimadzu FT-IR Spectrophotometer (4000–400 cm -1) in Taif University. The electron spin resonance
diffraction patterns for the selected charge-transfer complexes were recorded on X ‘Per t PRO PANanalytical X-ray powder diffraction, target copper with secondary monochromate. Carbonate content in the zinc(II) compound was determined by dissolving a sample of each product in excess standard HCl and the excess of HCl was determined using standard sodium carbonate28. The
percentage of Cu(II), Ni(II), and Zn(II) within their compounds were determined gravimetrically method till constant weight and stable formula.
RESULTS AND DISCUSSION Infrared spectra
The reaction of aqueous solutions of carbamide with bromide salts of copper(II), nickel(II), and zinc(II) at 95 oC produces a green,
light green, and white solid crystalline products, respectively. The infrared spectra of carbamide as well as the reaction products of different Cu(II), Ni(II) and Zn(II) salts with carbamide at elevated temperature were obtained from potassium bromide discs. The spectra of free carbamide ligand,
Table 1: Elemental analyses data of Mn(II), Cd(II), Mg(II) and Ca(II) carbonate compounds
Compounds Color. Elemental analyses/ Found (Calc.)
%C %H %Metal %CO32–
Calc. Found Calc. Found Calc. Found Calc. Found
Cu2(OH)3Br green - - 1.17 1.12 49.26 48.97 -
-[Ni2(NCO)2(H2O)2(Br)2] Light 6.05 5.99 1.01 1.00 29.55 29.43 - -green
ZnCO3.H2O white 8.37 8.21 1.41 1.32 45.60 45.33 41.84 40.47
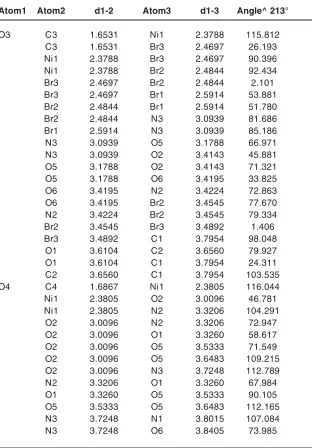
Table 2: Selective bond lengths and angles inside unit cell of Cu2(OH)3Br compound
atom1 atom2 d1-2 atom3 d1-3 angle^ 213°
Cu1 O3 1.9899 O3 1.9899 180.000
O3 1.9899 O1 2.3297 107.925
O3 1.9899 O1 2.3297 72.075
O3 1.9899 O1 2.3297 107.925
O1 2.3297 O1 2.3297 180.000
Cu2 Cu1 0.0000 O3 1.9899 0.000
Cu1 0.0000 O3 1.9899 0.000
Cu1 0.0000 O1 2.3297 0.000
Cu1 0.0000 O1 2.3297 0.000
O3 1.9899 O3 1.9899 180.000
O3 1.9899 O1 2.3297 72.075
O3 1.9899 O1 2.3297 107.925
O3 1.9899 O1 2.3297 107.925
O3 1.9899 O1 2.3297 72.075
O1 2.3297 O1 2.3297 180.000
O1 1.9004 O2 1.9173 105.366
O1 1.9004 Br1 2.1175 96.010
copper(II), nickel(II), and zinc(II) compounds are shown in Fig. 1a-d, respectively. The infrared spectra show no bands due to any of the reactants and of coordinated carbamide.
In case of zinc carbonate hydrated compound, a group of bands characteristic for the ionic carbonate, (CO3)2-, is appeared29. Based on
this fact, along with that obtained from elemental analysis data as well as the volumetric determination of (CO3)2- group with standard
solution of HCl and beside that the infrared spectrum of the commercially obtained ZnCO3 is the same as that of the product resulted from the reaction between zinc(II) bromide and carbamide at 95 oC. The infrared
assignments agree quite well with those known29
for the ionic carbonate (CO3)2-. The (CO 3)
2- ion is
planar and therefore, it belongs to the D3h symmetry. It is expected to display four modes of vibrations, A‘1 + A“2 + 2E‘ (E‘ is a doubly degenerate motion). The vibration A‘1 is only Raman active while the other ν2, ν3 and ν4 are infrared active. The stretching vibrations of the type; ν(C-O); ν3(E‘) is observed as a medium band in the range of 1500-1370 cm-1
while the stretching vibration (C-O); ν1(A‘1) is observed in the region ~1050 cm-1 as a
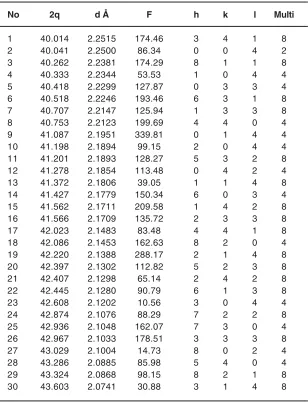
medium-to-weak band. It should be indicated here that this motion (A‘1) should be infrared inactive, its weak appearance in the spectrum of MCO3 could be related to weak solid-solid interactions causes the Table 3: Some selected visualized XRD-data inside Ni-complex lattice
No 2q d Å F h k l Multi
1 40.014 2.2515 174.46 3 4 1 8
2 40.041 2.2500 86.34 0 0 4 2
3 40.262 2.2381 174.29 8 1 1 8
4 40.333 2.2344 53.53 1 0 4 4
5 40.418 2.2299 127.87 0 3 3 4
6 40.518 2.2246 193.46 6 3 1 8
7 40.707 2.2147 125.94 1 3 3 8
8 40.753 2.2123 199.69 4 4 0 4
9 41.087 2.1951 339.81 0 1 4 4
10 41.198 2.1894 99.15 2 0 4 4
11 41.201 2.1893 128.27 5 3 2 8
12 41.278 2.1854 113.48 0 4 2 4
13 41.372 2.1806 39.05 1 1 4 8
14 41.427 2.1779 150.34 6 0 3 4
15 41.562 2.1711 209.58 1 4 2 8
16 41.566 2.1709 135.72 2 3 3 8
17 42.023 2.1483 83.48 4 4 1 8
18 42.086 2.1453 162.63 8 2 0 4
19 42.220 2.1388 288.17 2 1 4 8
20 42.397 2.1302 112.82 5 2 3 8
21 42.407 2.1298 65.14 2 4 2 8
22 42.445 2.1280 90.79 6 1 3 8
23 42.608 2.1202 10.56 3 0 4 4
24 42.874 2.1076 88.29 7 2 2 8
25 42.936 2.1048 162.07 7 3 0 4
26 42.967 2.1033 178.51 3 3 3 8
27 43.029 2.1004 14.73 8 0 2 4
28 43.286 2.0885 85.98 5 4 0 4
29 43.324 2.0868 98.15 8 2 1 8
Table 4a: Selective bond lengths and angles for Nickel-type one inside crystal lattice of [Ni2(NCO)2(H2O)2(Br)2] complex
Atom1 Atom2 d1-2 Atom3 d1-3 Angle^ 213°
Ni1 O2 2.2163 O1 2.3540 85.828
O2 2.2163 O3 2.3788 95.915
O2 2.2163 O4 2.3805 81.709
O1 2.3540 O3 2.3788 99.428
O1 2.3540 O4 2.3805 89.254
O1 2.3540 O5 2.5380 166.246
O1 2.3540 O6 2.7991 124.131
O3 2.3788 O4 2.3805 170.837
O3 2.3788 O5 2.5380 80.488
O3 2.3788 O6 2.7991 82.229
O4 2.3805 O5 2.5380 91.781
O4 2.3805 O6 2.7991 95.371
O4 2.3805 C2 3.2780 95.466
O4 2.3805 C1 3.3074 107.172
O5 2.5380 O6 2.7991 42.121
O5 2.5380 C2 3.2780 82.690
O5 2.5380 N2 3.3262 121.033
O6 2.7991 C2 3.2780 123.912
O6 2.7991 C1 3.3074 102.946
O6 2.7991 N2 3.3262 82.627
C2 3.2780 C1 3.3074 125.474
C2 3.2780 N2 3.3262 136.858
C2 3.2780 Br2 3.5118 66.637
C1 3.3074 N2 3.3262 21.681
C1 3.3074 N3 3.4102 127.934
C1 3.3074 C3 3.4375 72.827
N2 3.3262 N3 3.4102 129.667
N2 3.3262 C3 3.4375 71.802
N2 3.3262 Br3 3.4409 69.972
N3 3.4102 C3 3.4375 58.067
N3 3.4102 Br3 3.4409 64.749
C3 3.4375 Br3 3.4409 20.550
C3 3.4375 C4 3.4695 169.096
C3 3.4375 Br2 3.5118 19.615
symmetry of CO32- to be lowered than D
3h. The out of
plane of vibration d(OCO); ν2(A“2) is observed in the range of ~830 cm-1 as a medium strong band
while, the angle deformation bending vibration δ(OCO); ν4(E‘) appear in the range of 690 cm-1 as a
medium strong. The infrared spectra of zinc(II) carbonate hydrate, ZnCO3.xH2O (Fig. 1d) show that, some these products are hygroscopic and its clearly have moisture water. The band related to the
stretching vibration νas(O-H) and νs(O-H) of H2O are observed as expected at 3441 and 3353 cm-1,
respectively. At room temperature the coordination compounds of Zinc(II) ion with urea have been studied extensively [30,31] and it was found that, in these complexes, urea coordinated through its oxygen atom forming the [Zn(urea)2X2] where (X = Cl-, NO
3 - or CH
3COO
-). At high temperature the role
Table 4b: Selective bond lengths and angles for Nickel-type two inside crystal lattice of [Ni2(NCO)2(H2O)2(Br)2] complex
Atom1 Atom2 d1-2 Atom3 d1-3 Angle^ 213°
Ni2 O2 2.2163 O1 2.3540 85.828
O2 2.2163 O3 2.3788 95.915
O2 2.2163 O4 2.3805 81.709
O1 2.3540 O3 2.3788 99.428
O1 2.3540 O4 2.3805 89.254
O1 2.3540 O5 2.5380 166.246
O3 2.3788 O4 2.3805 170.837
O3 2.3788 O5 2.5380 80.488
O3 2.3788 O6 2.7991 82.229
O4 2.3805 O6 2.7991 95.371
O4 2.3805 C2 3.2780 95.466
O5 2.5380 O6 2.7991 42.121
O5 2.5380 C2 3.2780 82.690
O5 2.5380 C1 3.3074 142.688
O6 2.7991 C2 3.2780 123.912
O6 2.7991 C1 3.3074 102.946
O6 2.7991 N2 3.3262 82.627
C2 3.2780 C1 3.3074 125.474
C2 3.2780 N2 3.3262 136.858
C2 3.2780 N3 3.4102 20.883
C1 3.3074 N2 3.3262 21.681
N2 3.3262 Br3 3.4409 69.972
N3 3.4102 C3 3.4375 58.067
C3 3.4375 Br2 3.5118 19.615
Br3 3.4409 C4 3.4695 151.929
Br3 3.4409 Br2 3.5118 0.965
C4 3.4695 Br2 3.5118 152.889
in the form of [Zn(urea)2X2] could be understood as follows;
[Zn(urea)2Br2] + 3H2O ⎯⎯95⎯o⎯C→ ZnCO3.xH2O + CO2 + 2NH4Br + 2NH3
Metallic hydroxy salts with the composition M2(OH)3X (M = Cu, Co; X = organic anion) [32-34] have been extensively studied because of their interesting magnetic properties, that are strongly dependent on the structure and molecular ordering of intercalated anions, as well as, the interlayer distance determined by them. Accordingly, the properties of those materials can be easily manipulated, such that can be considered tunable magnetic materials34. So, it is reported in this paper
a new cheap and simple method for preparation of
copper hydroxybromide, an interesting member of this class of layered materials. The infrared spectrum of copper hydroxyl bromide, Cu2(OH)3Br, compound has some characteristic vibrational modes which are expected in the IR spectrum. In the specific case of the metal-oxygen bond, medium peaks are expected between 496 and 407 cm 1. Medium
intensity vibrational modes associated to the Cu– O–H bond should appear in the interval at 815, 844 and 1110 cm-135. The narrow bands at 3523 and
3405 cm-1 corresponds to stretching symmetric and
asymmetric OH groups. The frequency of the vibrational modes attributed to Cu–O–H bonds are depend on the degree of hydrogen bonding and were found at 777, 681 and 534 cm-134. In this study,
Table 5(a): Selective bond lengths and angles for oxygen-type one and two inside crystal lattice of [Ni2(NCO)2(H2O)2(Br)2] complex
Atom1 Atom2 d1-2 Atom3 d1-3 Angle^ 213°
O1 C1 1.5699 Ni1 2.3540 113.381
C1 1.5699 N2 2.4450 26.238
Ni1 2.3540 N2 2.4450 87.732
Ni1 2.3540 N1 2.5670 138.350
N2 2.4450 N1 2.5670 52.545
N1 2.5670 O2 3.1136 147.959
N1 2.5670 Br3 3.2513 88.778
O2 3.1136 Br3 3.2513 60.344
O2 3.1136 O4 3.3260 55.607
Br3 3.2513 Br2 3.3401 0.415
O4 3.3260 Br1 3.7856 68.950
O4 3.3260 C3 3.8837 104.240
Br2 3.3401 O3 3.6104 41.659
O3 3.6104 C3 3.8837 25.148
N2 3.7160 Br1 3.7856 55.508
N2 3.7160 C3 3.8837 124.003
Br1 3.7856 C3 3.8837 172.426
O2 C2 1.6985 Ni1 2.2163 113.050
C2 1.6985 N3 2.5538 24.073
C2 1.6985 N2 3.7713 144.904
C2 1.6985 O5 3.8485 78.412
Ni1 2.2163 N3 2.5538 90.987
Ni1 2.2163 N4 2.5826 137.048
Ni1 2.2163 O5 3.8485 38.872
N3 2.5538 N4 2.5826 49.096
N3 2.5538 O4 3.0096 119.498
N3 2.5538 O5 3.8485 61.597
compound, [Cu2(OH)3Br may be understood as follows. It is well known [30, 36] that Cu(II) forms with urea the complex ion [Cu(urea)4]2+ at room
temperature. Accordingly, in our case the parent complex [Cu(urea)4](Br)2 is formed. This parent complex may decompose at high temperature according to the following equation;
2[Cu(urea)4](Br)2 + 11 H2O ⎯⎯95⎯o⎯C→ Cu2(OH)3Br + 3NH4Br + 8CO2 + 13NH3
The reaction of nickel nitrate with urea in water was studied at 40° by the isothermal method37. The ternary solubility diagram of the
Ni(NO3)2-Urea-H2O system is presented. The solid phases in the system have the compounds of
Ni(NO3)2.2(NH2)2CO.2H2O, Ni(NO3)2.4(NH2)2CO, and Ni(NO3)2.10(NH2)2CO. All solubility of solid phases were determined at 30° and confirmed by an X-ray structural method. Complexes of N-ally urea (NAU) with cobalt(II) and nickel(II) halides and perchlorates have prepared and characterized by electrical conductance, magnetic susceptibility38.
The infrared spectra of N-allyl urea complexes with Ni(II) and Co(II) salts, [Co(NAU)2X2]; (X= Cl-, Br-, and
I-), [Ni(NAU)
4X2]; (X=Cl
-, Br-), [Ni(NAU)
4](ClO4)2 and
The infrared spectrum of [Ni2(NCO)2 (H2O)2(Br)2] complex clearly indicates the absence of bands due to the coordinated carbamide and the presence of very strong bands characteristic for isocyanate ions at 2220 ν(NCO”) cm-1 and 644 σ(NCO-) cm-140 and for coordinated water at the
1629, 3642 and 3434 cm-1 respectively, for δ(H 2O), νas(O-H) and νs(O-H) of H2O. At room temperature
the nickel(II)-urea complex is formulated as
[Ni(urea)4]2+37, 38. At high temperature this complex
may undergo the following reaction; where (X =Br-).
2[Ni(urea)4]Br2+8H2O ⎯9⎯ →5o⎯⎯C [Ni2(NCO)2(H2O)2 (Br)2]+2HBr+14NH3+6CO2.
Electron spin resonance
The ESR tool of analysis is useful in discuss the geometry and state of electrons in metal ion of
Table 5b: Selective bond lengths and angles for oxygen-type three (O3) and four (O4) inside crystal lattice of [Ni2(NCO)2(H2O)2(Br)2] complex
Atom1 Atom2 d1-2 Atom3 d1-3 Angle^ 213°
O3 C3 1.6531 Ni1 2.3788 115.812
C3 1.6531 Br3 2.4697 26.193
Ni1 2.3788 Br3 2.4697 90.396
Ni1 2.3788 Br2 2.4844 92.434
Br3 2.4697 Br2 2.4844 2.101
Br3 2.4697 Br1 2.5914 53.881
Br2 2.4844 Br1 2.5914 51.780
Br2 2.4844 N3 3.0939 81.686
Br1 2.5914 N3 3.0939 85.186
N3 3.0939 O5 3.1788 66.971
N3 3.0939 O2 3.4143 45.881
O5 3.1788 O2 3.4143 71.321
O5 3.1788 O6 3.4195 33.825
O6 3.4195 N2 3.4224 72.863
O6 3.4195 Br2 3.4545 77.670
N2 3.4224 Br2 3.4545 79.334
Br2 3.4545 Br3 3.4892 1.406
Br3 3.4892 C1 3.7954 98.048
O1 3.6104 C2 3.6560 79.927
O1 3.6104 C1 3.7954 24.311
C2 3.6560 C1 3.7954 103.535
O4 C4 1.6867 Ni1 2.3805 116.044
Ni1 2.3805 O2 3.0096 46.781
Ni1 2.3805 N2 3.3206 104.291
O2 3.0096 N2 3.3206 72.947
O2 3.0096 O1 3.3260 58.617
O2 3.0096 O5 3.5333 71.549
O2 3.0096 O5 3.6483 109.215
O2 3.0096 N3 3.7248 112.789
N2 3.3206 O1 3.3260 67.984
O1 3.3260 O5 3.5333 90.105
O5 3.5333 O5 3.6483 112.165
N3 3.7248 N1 3.8015 107.084
the compounds. In this paper, the ESR spectrum of the Cu(II) compound (Fig. 2). The solid-state ESR spectra of some of the compounds exhibit axially symmetric g-tensor parameters with g||> g4%> 2.0023, indicating that the copper site has a dx2
-y 2
ground-state characteristic of tetrahedral, square-planar, or octahedral stereochemistry. The g||> g4% for synthesized copper(II) hydroxylbromide, Cu2(OH)3Br, indicates a distorted octahedral. In axial symmetry, the G-values are given by Eq. 1.
G= (g||-2)/(g4%-2) = 4 → (1)
Where G is the exchange interaction parameter, according to literature, for the considerable exchange interaction process between Cu(II) centers in the solid state the value of G ≥ 4. The Giso. Value obtained for Cu(II) compound
is estimated to be 2.3850 which satisfy the above mentioned parameter. The giso value was evaluated by using the relation giso = 1/3 g|| + 2/3 g4%, and these calculated values are in agreement with an orbital non-degenerate state.
The values of g|| were calculated for assigned arrows peaks in Fig.2 and found to be 1.934, 2.2512 and 3.0016 respectively.
This trend of increasing in g|| values was observed with V. P. Singh41 who was studying the
electronic and ESR spectra of Cu(II) halo-hydrazones complexes and indicated that each complex exhibits a six-coordinate tetragonally distorted octahedral geometry in the solid state and in DMSO solution. The ESR spectra of most of the Cu-complexes reported in41 are typically isotropic
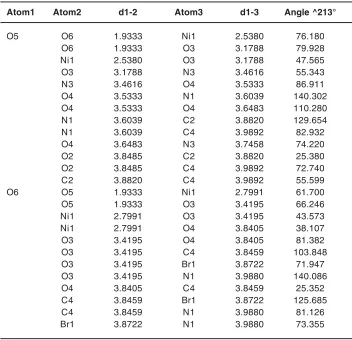
Table 5(c): Selective bond lengths and angles for oxygen-type five (O5) and six (O6) inside crystal lattice of [Ni2(NCO)2(H2O)2(Br)2] complex
Atom1 Atom2 d1-2 Atom3 d1-3 Angle ^213°
O5 O6 1.9333 Ni1 2.5380 76.180
O6 1.9333 O3 3.1788 79.928
Ni1 2.5380 O3 3.1788 47.565
O3 3.1788 N3 3.4616 55.343
N3 3.4616 O4 3.5333 86.911
O4 3.5333 N1 3.6039 140.302
O4 3.5333 O4 3.6483 110.280
N1 3.6039 C2 3.8820 129.654
N1 3.6039 C4 3.9892 82.932
O4 3.6483 N3 3.7458 74.220
O2 3.8485 C2 3.8820 25.380
O2 3.8485 C4 3.9892 72.740
C2 3.8820 C4 3.9892 55.599
O6 O5 1.9333 Ni1 2.7991 61.700
O5 1.9333 O3 3.4195 66.246
Ni1 2.7991 O3 3.4195 43.573
Ni1 2.7991 O4 3.8405 38.107
O3 3.4195 O4 3.8405 81.382
O3 3.4195 C4 3.8459 103.848
O3 3.4195 Br1 3.8722 71.947
O3 3.4195 N1 3.9880 140.086
O4 3.8405 C4 3.8459 25.352
C4 3.8459 Br1 3.8722 125.685
C4 3.8459 N1 3.9880 81.126
4000 3500 3000 2500 2000 1500 1000 500 50
100 150 200 250 300
c
T
ran
smi
ttan
c
e
, %
Wavenumber, cm-1
4000 3500 3000 2500 2000 1500 1000 500 60
80 100 120 140 160 180 200 220 240 d
T
ran
sm
it
ta
n
c
e
, %
Wavenumber, cm-1
Fig. 1: Infrared spectra of a- Urea, b- Cu2(OH)3Br, c- [Ni2(NCO)2(H2O)2(Br)2] and d- ZnCO3.H2O compounds
Fig. 2: ESR spectrum of Cu2(OH)3Br compound
10.4 26.4 42.4 58.4 Monoclinic-Phase with P121/c1 Space Group
Cu2(OH)3Br
Two Theta ( Degree )
Fig. 3: Experimental X-ray diffractogram of the Cu2Br(OH)3 with A2XY3 type structure and
P121/c1 space group
0 10 20 30 40 50 60 70 80 90
Trigonal Crystal Structure with 3-2/m Space group
Two Theta (Degree) ZnCO3.H2O
Fig. 3(a): Experimental X-ray diffractogram of the ZnCO3.H2O with trigonal structure and 3-2/m
space group
effects on the geometry of some salts of the isocyanato and halo-cuprate(II) anion involving tetraethylammonium and other bulky cations .
They proposed that the -N=C=O isocyanate and halo cuprate (II) entities are arrayed about the copper in a square planar (or pseudo octahedral) manner in the blue isomer and in a tetrahedral (though probably distorted tetrahedral) crystal form.
X-Ray diffraction (XRD) and structural analysis measurements
The X-ray diffraction measurements (XRD) were carried out at room temperature on the fine ground powders of pure products resulted from reaction of metal bromide with urea in the range (2è =2-70o) using Cu-Ká radiation source and a
computerized X-ray diffractometer with two theta scan technique. The accurate analysis of XRD
10 20 30 40 50 60 70
Two Theta Degree [214]
Experimental XRD-profile of [Ni2(NCO)2(H2O)2(Br)2] complex
Fig. 3(b): Experimental X-ray diffractogram of the [Ni2(NCO)2(H2O)2(Br)2] complex
Fig. 4: Visualized XRD-profile of Cu2Br(OH)3 with monoclinic crystal form
Fig. 5: Unit cell of Cu2Br(OH)3 compound
indicated that the first compound is Cu2(OH)3Br which has A2XY3 structure type with monoclinic crystal form as clear in Fig. 3. The lattice parameters were calculated and found to be a = 6.154, b = 6.813 and c = 9.114 Å for monoclinic structure of P121/c1 space group respectively. By the same technique the analysis of XRD of compound II resulted from reaction of zinc bromide with urea was found ZnCO3.H2O trigonal crystal structure with 32/m space group and lattice parameters a = 4.672 and c = 15.0199Å respectively as clear in assigned figure Fig. 3a.
Fig. 6: Side view of super-lattice of Cu2Br(OH)3 and cluster formed with minimum 500 atoms
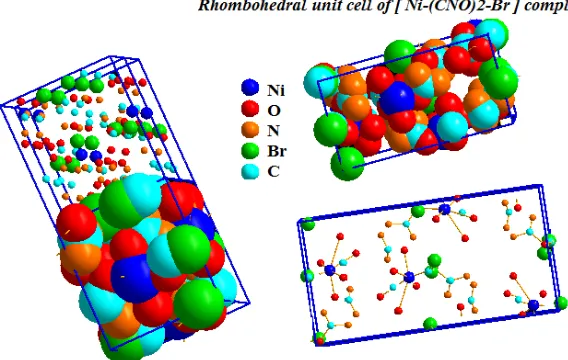
Fig. 7: Rhomboheral visualized structure pattern for Nickel-complex
formulated and confirmed to be [Ni2(NCO)2(H2O)2(Br)2] complex with rhombohedra unit cell with lattice parameters a =19.0711, b=10.4231 and c = 8.9876 Å respectively and P212121 space group.
Structural visualization
Visualized studies of crystal structure were made by using Diamond Molecular Structure version 3.2 packages, Germany and Mercury 2.3-BUILD RC4-UK. A visualization study made is concerned by matching and comparison of experimental and theoretical data of atomic positions, bond distances, oxidation states and bond torsion on the crystal structure formed. The visualized studies for compound I (Cu2(OH)3Br) as model of urea precursor reactions confirmed that there are very good fitting between experimental XRD of Cu2(OH)3Br see Fig. 3a and visualized XRD-pattern Fig. 4.
Table 2 displays some selective bond distances and angles inside unit cell of (Cu2(OH)3Br) compound as it cleat there is two different types of copper atoms nominated as Cu1 and Cu2 ,three types of oxygen atoms symbolized as O1,O2 and O3 respectively .And finally only one type of bromide .One can observe that copper linked with oxygen recording 1.98 ,2.3297 ,1.91 Å for Cu1-O3,Cu2-O1 and Cu2-O1 respectively .These observations confirmed that there are more one oxidation state for copper which consistent and support ESR-data reported in the present manuscript .
Furthermore Figs. 5, 6 together with Table 2 confirm that the obtained compound I is hundred percent Cu2(OH)3Br with A2XY3 structure type and monoclinic crystal form.
Fig. 3b shows experimental polycrystalline XRD-profile recorded for [Ni2(NCO)2(H2O)2(Br)2] complex. It was notified that the most intense reflection peak is located at two theta ~ 42.22 with [214] Muller index. This peak has highest figure of merit (F) ~288.17 accompanied with maximum multiplicities = 8 respectively as shown and tabulated in Table.3 which shows also some visualized selected XRD-diffraction data with its d-spacing inside unit cell of Ni-Isocyanate-Bromide complex.
Fig.7 shows the visualized XRD-profile of evaluated rhombohedra nickel-complex with intense diffraction peak lies at two theta value ~ 42.15° which is nearly identical to that induced in the experimental XRD-profile Fig.3b .
Fig.8 displays ball-stick and fill-space models for Ni-NCO-Br complex with minimum 78 atoms inside visualized unit cell of nickel-isocyanate-bromide complex .Furthermore 2x2x2 super unit cell was built up to confirm validity of rhombohedral structure of nickel complex [Ni2(NCO)2(H2O)2(Br)2] as stable valid structure form .
To complete visualization investigations with good fitting between theoretical and experimental studies many of structural parameters were analyzed carefully such as bond lengths, torsion on angles and symmetry operations.
Tables 4a,4b describe some selected bond distances and structural parameters of visualized [Ni2(NCO)2(H2O)2(Br)2] complex concerned by the two different types of nickel atoms inside unit cell of Ni-isocyanate- bromide complex symbolized as Ni1 and Ni2 .
As it clear from table.4a Ni1 linked with six different types of oxygen atoms nominated as ( O1,O2,O3,O4,O5 and O6 ) recording bond lengths equal to 2.35 ,2.21 ,2.37 ,2.38,2.53 and 2.7 Å respectively . These data confirmed that the average density of positively charge focused on the nickel atoms (Ni1 ,Ni2) are varying as environmental neighboring atoms is changed43-48 . Similar behavior
was observed with nickel type two (Ni2) as reported and tabulated in Table.4b.
Tables 5a,b,c are describing the bonding between different six oxygen atoms symbolized as O1,O2,O3,O4,O5 and O6 with other neighboring atoms .
Accurate analysis of these tabulated data enhance to understand why [Ni2(NCO)2(H2O)2(Br)2] complex is stable and valid specially at the point of view in which torsion on angles inside unit cell still within normal ranges44,46, 47 recording minimum
linear and maximum is for C3-O1-Br1 which equal 172.4° , which is also very close to (180°) linear angle . As reported in44,47 if the torsion on angle
inside unit cell of crystal lattice within the normal range (5-10 %) of the angle value whatever the angle, is enhancing stability of the proposed structure .
Thermal analysis studies
The thermogravimetric analyses (TG/DTG/ DSC) curves for the copper hydroxybromide, [Ni2(NCO)2(H2O)2(Br)2] and ZnCO3.xH2O in nitrogen atmosphere are illustrated in Figs 9. There is one step event leading to a total weight loss of 38% at 300 °C which attributed to the removal of hydrogen bromide and one water molecules. The final decomposition product was detected as copper(II) oxide. Also, The [Ni2(NCO)2(H2O)2(Br)2] complex has a sharp decomposition peak at 375 oC with
weight loss about 24% due to the loss of the two coordinated water molecules, one nitrogen and on carbon monoxide molecules. The residual moieties consists of mixture from nickel(II) oxide and nickel(II) bromide contaminated with few carbon atoms. Additionally, Fig. 9 shows typical cur ves for thermogravimetric (TG), differential scanning calorimetry (DSC) and differential thermogravimetric analysis (DTG) of the decomposition of the zinc carbonated hydrate together with the mass spectra of the evolved gases at various temperatures. The thermal decomposition of the sample takes place in temperature ranges of 100-to-200 oC and 200-to-800 oC with mass loss
corresponding to hydrated water molecules and carbon dioxide gas. Only the fragment ions of H2O and CO2 can be detected in the mass spectra during the course of the thermal decomposition.
REFERENCES
1. Feldman, D.; Barbalata, A. “Synthetic Polymers”, Chapman & Hall, London, 1996. 2. Finar, I.L. “Organic Chemistry”, Longman
group limited, London, 1973, p. 460. 3. Rahman, M.J.; Bozadjiev, P.; Polovski, Y. Fert.
Res. 1994, 38(2), 89.
4. George, S.; Chellapandian, M.; Sivasankar, B.; Jayaraman, K. Bioprocess Eng. 1997, 16(2), 83.
5. Wang, X.J.; Douglas, L.A. Agrochimica. 1996, 40(5-6), 209.
6. Yerokun, O.A. S. Afr. J. plant soil. 1997, 14(2), 63.
7. Heinig, R. SOFW J. 1996, 122(14), 998. 8. Gnewuch, C.T.; Sosnovsky, G. Chem. Rev.
1997, 97(3), 829.
9. Miyagawa, C.I. Drug Intell. & Clin. Pharma. 1986, 20, 527.
10. Sugimura, M.; Kameyama, Y.; Hashimoto, T.; Kobayashi, T.; Muramatsu, M. Chem. Abs. 1990, 112, 63.
11. Yamaguchi, A.; Miyazawa, T.; Shimanouchi, T.; Mizushima, S. Spectrochim. Acta. 1957, 10, 170.
12. Stewart, J.E. J. Chem. Phys. 1957, 26, 248. 13. Srivastava, P.C.; Aravindaksahn, C. Z. Phys.
Chem. Leipzig. 1983, 264, 61.
14. Schafer, M.; Curran, C. Inorg. Chem. 1966, 5, 256.
15. Zarli, B.; Dall’Olio, G.; Sindellari, L. J. Inorg. Nucl. Chem. 1976, 38, 491.
16. Barbier, J.P.; Hugel, R.P. J. Inorg. Nucl, Chem. 1977, 39, 2283.
17. Barbier, J.P.; Hugel, R. Inorg. Chimica Acta. 1974, 10, 93.
18. Teleb, S.M.; Refat, M.S.; Sadeek, S.A. Ukrainian Chem. J. 2004, 68(5), 35. 19. Sadeek, S.A.; Refat, M.S. J. Coord. Chem.
2005, 58(18), 1727.
20. Sadeek, S.A.; Refat, M.S.; Teleb, S.M. J. Korea, Chem. Soc. 2004, 48(4), 358. 21. Refat, M.S.; Teleb, S.M.; Sadeek, S.A.
Spectrochim. Acta A, 2004, 60, 2803. 22. Refat, M.S.; Sadeek, S.A.; Teleb, S.M. J. Argen.
Chem. Soc. 2004, 92(4-6), 23.
23. Refat, M.S. Synth. React. Inorg. Met.-Org. Chem. 2004, 34(9), 1605.
24. Nour, E.M.; Teleb, S.M.; Al-Khososy, N.A.; Refat, M.S. Synth. React. Inorg. Met-Org. Chem. 1997, 27(4), 505.
25. Refat, M.S.; Sadeek, S.A. Latvian J. Chem. 2005, 4, 343.
27. Teleb, S.M.; Refat, M.S. Bull. Chem. Technolog. Maced. 2006, 25(1), 57.
28. Vogel, A.I. “Qualitative Inorganic Analysis”, John wiely & Sans, Inc. New York, 1987. 29. Nakamoto, K. “Infrared and Raman Spectra
of inorganic and coordination compounds”, 3rd edn (New York: Wiley Interscience), 1978. 30. Penland, R.B.; Mizushima, S.; Curran, C.; Quagliano, J.V. J. Amer. Chem. Soc. 1957, 79, 1575.
31. Yar, O.; Lessinger, L. Acta Crystallogr., Sect. C Cryst. Struct. Commun. 1995, C 51(11), 2282.
32. Bruschini, C.S.; Hudson, M.J. Access in Nanoporous Materials; Pinnavaia, T.J.; Thorpe, M.F. eds.; Plenum Press: New York, 1995, p. 161.
33. Pereira, D.C.; de Faria, D.L.A.; Constantino, V.R.L.; J. Braz. Chem. Soc. 2006, 17, 1651. 34. Aguirre, J.M.; Gutiérrez, A.; Giraldo, O.; J. Braz.
Chem. Soc. 2011, 22(3), 546.
35. Secco, E.; Worth, G. Can. J. Chem. 1987, 65, 2504.
36. Yamaguchi, A.; Miyazawa, T.; Shimanouchi, T.; Mizushima, S. Spectrochim. Acta. 1957, 10, 170.
37. Boobekova, S.; Rysmendeev, K.R. Univ. Fiz.-Mat. Estestv-Nauk. 1969, 3, 84.
38. Singh, P.P.; Pande, I.M. Can. J. Chem. 1972, 50, 2603.
39. Davies, M.; Hallam, H.E. Trans. Faraday Soc. 1950, 47, 1170.
40. Nakamoto, K. “Infrared and Raman Spectra of Inorganic and Coordination Compounds, Part A Theory and Applications in Inorganic Chemistry”, Wiley, New York, 2009.
41. Singh, V.P. Spectrochim Acta Part A. 2008, 71, 17-22.
42. Chughtai, A.R.; Keller, R.N. J. Inorg. Nucl. Chem. 1969, 31, 633.
43. Kawamura, M.; Shimada, S. Inorg. Chim. Acta. 2007, 360, 2162.
44. Elsabawy, K.M.;Refat, M.S. J. Comput. Meth. Molecular Design. 2011, 1(4), 1-13. 45. Wozniak, K.; Krygowski, T.M.; Kariuki, B.;
Jones, W. J. Mol. Struct. 1991, 248, 331-343. 46. Elsabawy, K.M. Cryogenics. 2011, 51, 452. 47. Elsabawy, K.M.; El-Newehy, M.H. Appl. Surf.
Science. 2011, 258, 1345.
![Table 4a: Selective bond lengths and angles for Nickel-typeone inside crystal lattice of [Ni2(NCO)2(H2O)2(Br)2] complex](https://thumb-us.123doks.com/thumbv2/123dok_us/9009290.1438348/5.576.122.456.258.707/table-selective-lengths-nickel-typeone-crystal-lattice-complex.webp)
![Table 4b: Selective bond lengths and angles for Nickel-type twoinside crystal lattice of [Ni2(NCO)2(H2O)2(Br)2] complex](https://thumb-us.123doks.com/thumbv2/123dok_us/9009290.1438348/6.576.130.446.350.707/selective-lengths-angles-nickel-twoinside-crystal-lattice-complex.webp)
![Table 5(a): Selective bond lengths and angles for oxygen-type oneand two inside crystal lattice of [Ni2(NCO)2(H2O)2(Br)2] complex](https://thumb-us.123doks.com/thumbv2/123dok_us/9009290.1438348/7.576.132.445.343.704/table-selective-lengths-oxygen-oneand-crystal-lattice-complex.webp)

![Fig. 3(b): Experimental X-ray diffractogramof the [Ni2(NCO)2(H2O)2(Br)2] complex](https://thumb-us.123doks.com/thumbv2/123dok_us/9009290.1438348/11.576.87.275.482.659/fig-experimental-ray-diffractogramof-the-ni-nco-complex.webp)