FITTING OF A PARTIALLY REPARAMETERIZED
GOMPERTZ MODEL TO BROILER DATA
N. Okendro Singh
Associate Professor (Ag. Stat.), College of Agriculture, Central Agricultural University,
Iroisemba – 795 004, Imphal, Manipur (India)
ABSTRACT
Different non-linear growth models were fitted to the growth data of broiler and Gompertz model was found
appropriate to the data under intensive system. One of the estimated parameters of the fitted Gompertz model
showed a non-linear behavior. Thus, the concept of partial reparameterization by expected-value parameters
was used to mitigate nonlinear behavior of the estimated parameter. The growth data of broiler refitted to an
explicit form of the partially reparameterized version of Gompertz model showed superior results.
Keywords
:
Curvature Effects, Growth, Nonlinear Model, Parameter and Reparameterization.
I. INTRODUCTION
In the North-Eastern Region (NEH) of India, there is a high demand of meat (animal proteins). Broiler farming
will play an important role to meet the demand of food and nutrition in this particular region. Growth parameters
are important not only as selection criteria but also in terms of feed management techniques. Therefore, it is
preferable to model the growth trend that defines periodic changes in the underlying characteristic. There have
been quite a few studies undertaken toward the determination of growth trend in broilers in the NEH region of
India. Further, the nonlinear models fitted to maximum of the data usually resulted in highly nonlinear behavior
of the estimated parameters. Many authors highlighted the importance of reparameterization in nonlinear model
fitting especially to tackle the issue of nonlinear behavior of the estimated parameters ([1-5]). In fact, a little
attention is given to the various reparameterizations and consequently, the parameter estimates hardly satisfy
any of the optimum properties. The present study aims to estimate growth rate curves and their parameters using
different nonlinear growth models to determine the age-live weight relationship of broiler under intensive
system. The suitability of reparameterized model to mitigate the nonlinear behavior of estimated parameter is
also demonstrated.
II. MATERIALS AND METHODS
The following nonlinear models will provide a reasonable representation of average weight Wt at time t whose
t
exp
1
W
3 2 1 t
(1) Gompertz:
exp
t
exp
W
t
1
2
3 (2)Von-Bertalanffy:
33 2 1 t
t
exp
1
W
(3)Where
1,
2 and
3 are the parameters to be estimated. The parameter
1 represents the limiting growth value or asymptotic size,
2 the scaling parameter and
3, the rate of maturity.If ‘
1’ is likely to be an offensive parameter say, in equation (2), then it can be partially reparameterized byexpected-value parameter. To obtain an expected-value parameter from above equation (2), we need to choose
value
t
1of the regressor variablet
, within the observed range of t. Then, we get the expected value from equation (2) as follows:
2 3 1
1
1
exp
exp
t
W
Solving this equation for the parameter ‘
1’ only, we get
2 3 1
1 1
t
exp
exp
W
Substituting back into the original equation (2), we get
2 3 1
3 2 1 t
t
exp
exp
t
exp
exp
W
W
(4)The above model is proposed to eliminate the nonlinear behaviour of the estimated parameter. Here, the likely
offensive parameter ‘
1’ is reparameterized by expected-value parameter while the other parameters are notchanged.
2. 1Criteria for Model Selection
To examine model performance, summary statistics like root mean square error (RMSE) and mean absolute
error (MAE) are generally used:
12n
1 t
2 t t
W
ˆ
n
W
RM SE
;
W
W
ˆ
/
n
M AE
n 1 t t t
, andwhere
t
W
ˆ
Predicted weight of tth observation;n Number of observations,
t
1
,
2
,...,
n
.The better model will have the least values of these statistics. It is, further, recommended for residual analysis to
check the model assumptions such as independence or the randomness assumption of the residuals and the
normality assumption. To test the independence assumption of residuals, run test procedure is available in the
literature ([6]). Further, Shapiro-Wilk’s test was applied to check the normality assumption but, it is not so
stringent for selecting nonlinear models because their residuals may not follow normal distribution.
Moreover, the curvature in a nonlinear model consists of two components: the intrinsic (IN) curvature and
parameter effects (PE) curvature. Details of the root mean square (RMS) IN and PE measures of curvature and
curvature critical value are given in Bates and Watts ([7-8]). According to Ratkowsky ([9]), the IN curvature is
typically smaller than the PE curvature, which can be affected by altering the parameterization of the model.
Severe curvature effects are indicated by values of IN and PE exceeding the critical value i.e.,
0
.
05
F
1
p,np , p is the number of parameters involved in the model. In usual, PE is computed when IN is within permissible limits and a lower value of PE suggests that the model exhibits close-to-linear behavior ([6]).Hougaard’s measure of skewness, gt, can also be employed to assess whether a parameter is close to linear or
whether it contains considerable nonlinearity. Hougaard’s measure is computed as follows:
jkl kjl lkj
p
jkl 2 3
t
t
E
ˆ
MSE
L
L
L
W
W
W
ˆ
E
jk kl jl
where the sum is a triple sum over the number of parameters,
1
L
J J
,
n1 m
mkl mj jkl
J
H
W
,J is the Jacobian matrix, Jm is the Jacobian vector, H is the Hessian matrix, Hm is its component evaluated at
observation m and
t is the tth parameter. This third moment is normalized using the standard error to give Hougaard’s measure of skewness as:
32tt 3
t t t
L
M SE
ˆ
E
ˆ
E
g
.According to Ratkowsky ([6]), if
g
t
0
.
1
, the estimator
ˆ
t of parameter
t is very close-to-linear in behavior and, if0
.
1
g
t
0
.
25
, the estimator is reasonably close-to-linear. If0
.
25
g
t
1
, the skewnessis very apparent. For
g
t
1
, the nonlinear behavior is considerable.2.2 Description of Data
The weekly average growth dataset of body weight/ broiler in gm under intensive system observed by Fanai
([10]) was considered. The experiment was conducted to compare the growth performance of broiler under
intensive system and backyard system. A total of 600 commercial broilers were divided into two groups, 300
remaining 300 were equally distributed to 10 farmers to rear under backyard system. All the production
parameters like growth rate, feed conversion rate, mortality rate and economics under backyard system as well
as intensive system of management from birth till 13 weeks of age were recorded and analyzed. They observed
that overall performance of broiler was comparatively better under intensive system than backyard system. Thus
the growth data of broiler under intensive system is further considered for the present study.
III. FIGURES AND TABLES
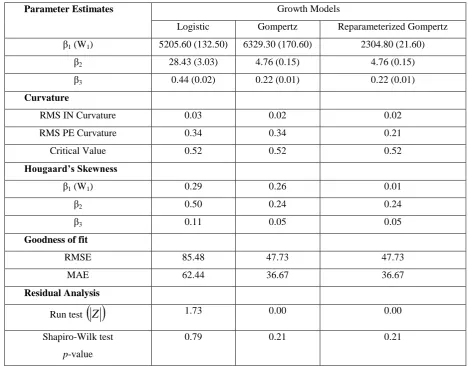
Table 1: Summary Statistics for Fitting of Various Growth Models on Broiler Data Under
Intensive System
Parameter Estimates Growth Models
Logistic Gompertz Reparameterized Gompertz
β1 (W1) 5205.60 (132.50) 6329.30 (170.60) 2304.80 (21.60)
β2 28.43 (3.03) 4.76 (0.15) 4.76 (0.15)
β3 0.44 (0.02) 0.22 (0.01) 0.22 (0.01)
Curvature
RMS IN Curvature 0.03 0.02 0.02
RMS PE Curvature 0.34 0.34 0.21
Critical Value 0.52 0.52 0.52
Hougaard’s Skewness
β1 (W1) 0.29 0.26 0.01
β2 0.50 0.24 0.24
β3 0.11 0.05 0.05
Goodness of fit
RMSE 85.48 47.73 47.73
MAE 62.44 36.67 36.67
Residual Analysis
Run test
Z
1.73 0.00 0.00Shapiro-Wilk test
p-value
0.79 0.21 0.21
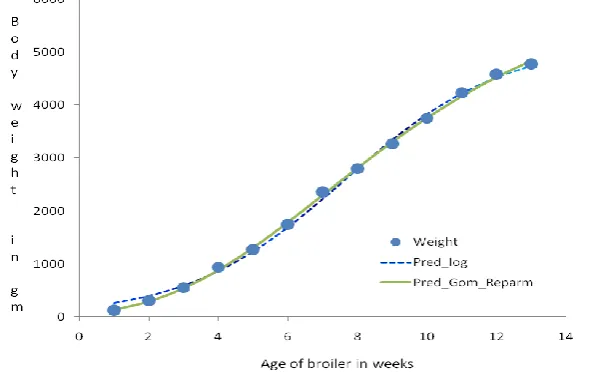
Fig. 1: Graphical Display of Observed and Predicted Growth of Broiler Under Intensive System
(Reparameterized Gompertz Model is Adjudged to be the Best fit)
IV. RESULTS AND DISCUSSION
The above dataset was fitted to different nonlinear models using SAS 9.3 version available at College of
Agriculture, CAU, Imphal. Different sets of initial parameter values have been tried so that a global
convergence criterion is met for fitting of nonlinear models. The global convergence criteria have been met for
logistic and Gompertz models. The estimates of parameters, RMSE, MAE, curvature effects, Hougaard’s
skewness coefficients, run test statistic (|Z|) value and Shapiro-Wilk test p-value for the above two models under
intensive system are presented in Table 1. Gompertz model shows better performance than other model when
the criteria of RMSE and MAE are used to identify the best-fit model. Further, independence assumption about
residuals is satisfied since the run test |Z| values (lies between 0.00 – 1.73, given in Table 1) are well below the
critical value of 1.96 of normal distribution at 5% level of significance. Also, the significance values of
Shapiro-Wilk test for residuals clearly indicate (p>0.05) that residuals are normally distributed. The asymptotic weight of
broiler estimated by the Gompertz model is approximately 6329.30 gm under intensive system.Moreover, RMS
IN curvature (0.02) and RMS PE curvature of Bates and Watts (0.34) are less than the corresponding critical
value 0.52 and they are acceptable. However, Hougaard’s skewness value of the estimated parameter of
Gompertz model say,
ˆ
1 is greater than 0.25 which shows that the nonlinear behavior is very apparent. Torectify the above problem, a partially reparameterized Gompertz model is proposed considering the parameter
1
ˆ
as an offensive parameter, given in equation (4). The parameter
1 is replaced by W1 in the process ofreparameterization as
1 is considered to be the offensive parameter. A value of t1=7 was chosen and thecorresponding value of W1= 2362.5 is taken as an initial value for computation of the final estimate of the
parameter W1,whichgives the best result in terms of least nonlinear behavior. The reparameterized model was
refitted to the data and the results are again presented in Table 1. Further improvements in Hougaard’s skewness
and curvature effects are also seen in this refitted model. The graph of fitted model along with observed growth
V. CONCLUSION
It is summarized that Gompertz model is adjudged to be the best fit for the present data set. We also conclude
that under the intensive system, we can expect the maximum size of approximately 6329.30 gm in weight of
broiler. As such one of the estimated parameter of Gompertz model was showing non-linear behavior, it was
partially reparameterized by expected value parameter. The partially reparameterized model was refitted to the
same data set and the results showed appropriateness of the proposed model. Thus, reparameterization will help
to mitigate the nonlinear behavior of the estimated parameters.
REFERENCES
[1] Sarada, C. and Prajneshu (2005). On appropriate reparameterization of a nonlinear statistical model. J.
Ind. Soc. Ag. Stat., 59(3): 237-242.
[2] Prajneshu (2008). Fitting of Cobb-Douglas production functions: revisited. Agricultural Economics
Research Review, 21: 289-292.
[3] El-Shehawy, S.A. (2010). On the selection of models in nonlinear regression. Asian Journal of
Mathematics and Statistics, 3(4): 254-266.
[4] Ross, J.S.G., Prajneshu and Sarada, C. (2010). Reparameterization of nonlinear statistical models: a case
study. Journal of Applied Statistics, 37(12): 2015-26.
[5] Singh, N.O., Paul, A.K., Kumar, S., Alam, W., Singh, N.G., Singh, K.N. and Singh, P. (2013). Fitting of
partial reparameterized logistic growth model to oil palm yield data. Int. J. Agricult. Stat. Sci.,
9(Suppl-1): 55-62.
[6] Ratkowsky, D.A. (1990). Handbook of Nonlinear Regression Models. New York: Marcel Dekker.
[7] Bates, D.M. and Watts, D.G. (1980). Relative curvature measures of nonlinearity. Journal of the Royal
Statistical Society, B, 42(1): 1-25.
[8] Bates, D.M and Watts, D.G. (1998). Nonlinear regression analysis and its applications. John Wiley and
Sons, New York.
[9] Ratkowsky, D.A. (1983). Nonlinear Regression Modelling - A Unified Practical Approach. New York:
Marcel Dekker.
[10] Fanai, R.L. (2011). Comparison of broiler performance under intensive system and backyard system.