INTRODUCTION
Oxime derivatives of aldehydes and ketones are mainly used in analytical chemistry1. Furfuraldehyde and their oxime have aroused considerable interest with regard to their chelating ability with the transition metal ions2,3,4. The chemistry of metal oxime complexes is of interest because these species display a variety of reactivity mode and also because they possess catalytic and biological activity 5,6 oximes derived Pd (II) complex is very efficient catalyst for the Heck-Mizoroki reaction7. Ru (III) complexes were found to be effective catalyst for asymmetric hydrosilytion of ketoxime to give corresponding primary amines8 Rh NHC complex is use as radio pharmaceutical based on 105Rh. The structures of the synthesized metal chelates were established by physico-chemical techniques, which includes spectral and magnetic measurements. The structure of the ligand have illustrated in Fig. 1.
Oriental Journal of Chemistry Vol. 24(3), 995-999 (2008)
Synthesis characterisation and X-ray diffraction studies of
some Pd(II), Ru(III) and Rh(III) complexes of furfuraldoxime
S.G. SINGH and B.H. MEHTA*
Department of Chemistry,University of Mumbai, Vidyanagari, Santacruz[E], Mumbai - 400 098 (India).
(Received: September 20, 2008; Accepted: November 29, 2008)
ABSTRACT
Metal(II) complexes of the type ML2 [Where M-Pd (II),] oxime derived from furfural and hydroxylamine hydrochloride and ML3 nH2O [where M-Ru(III), Rh(III), n=2] have been prepared and characterised by elemental analysis, molar conductivity, IR, electronic spectra, magnetic susceptibility studies and X-ray diffraction spectra. Molar conductivity measurements indicate that the complexes are non-elctrolytic in nature. From the analytical and spectral data, the stoichiometry of complexes have been found to be 1:3 (metal:ligand) for Ru (III) and Rh (III) whereas 1:2 for Pd (II) complex. Magnetic susceptibility measurements indicate diamagnetic behaviour of complexes except Ru (III) complex, which is paramagnetic in nature. The X-ray diffraction studies suggest monoclinic crystal system for these complexes.
Key words: X-ray diffraction studies, metal complexes, furfuraldoxime.
Fig. 1 EXPERIMENTAL
All chemicals used for the synthesis were of AR grade. Furfuraldehyde was obtained from S.D. fine chemicals. Metal salt from S.D. fine chemicals. Distilled solvents were used throughout the experiments. The furfuraldoxime was prepared by the method described by Brady and Goldstein10 Synthesis of furfuraldoxime
mixture of sodium hydroxide (14g in 15 mL water) and hydroxylamine hydrochloride (12g in 20 mL water). After 1hrs the solution was filtered and cooled in a freezing mixture and a slightly excess of ice-cold saturated aqueous solution of ammonium chloride was slowly added with constant stirring. The crystalline precipitate was washed with little cold water and air dried. The yield of the crude oxime was 11.5g. After crystallizing thrice from petrol ether, 4g of pure furfuraldoxime was obtain. (m.p 750-760C) Synthesis of Metal-Complexes
The metal complexes were synthesised by mixing the ethanolic solution of ligand (1%w/v) with the metal solution (1mg /cm3). The pH of the reaction mixture was adjusted to 2 for Pd (II) complex where as Rh (III) complex was precipitated at pH 8 and Ru (III) complex was precipitated at pH 10. The solid complexes obtained were filtered, washed with hot water and then with hot methanol and dried in vacuum dessicator.
Physical measurement
The melting point of all the complexes were determined by open capillary method. Elemental analysis was carried out in the micro analytical laboratory University of Mumbai. The metal content for all the metal complexes were determined as reported in the literature11,12. The complexes were examined for solubility using various polar and non-polar solvents. Molar conductivity of ligand and metal complexes were recorded using 1x10⁻³M solutions
in DMF on Toshiniwal TSM-15 Conductivity meter. The electronic absorption spectra of ligand and complexes were recorded in the UV-visible region using DMF as solvent on UV-visible 2100 spectrophotometer supplied by M/S Perkin Elmer-lambda 25. IR spectra were recorded using KBr pellet on FTIR-4200 supplied by M/s Shimadzu Corporation. Magnetic susceptibility measurements were made at room temperature on Gouy’s balance using Hg[Co(SCN)4] as calibrant. X-ray diffraction spectra on X-ray diffractometer supplied by M/s. Philips, Holland. The experimental results are summarised in Table 1 and 2.
RESULTS AND DISSCUSION
The oxime of furfuraldehyde is a white crystalline substance having melting point 75oC. The metal complexes derived from this oxime vary in their colour. The elemental analysis suggests metal: ligand stoichiometry as 1:2 for Pd complex and 1:3 for Ru and Rh complex indicated by close agreement with the analytical data and theoretical molecular formula. The metal complexes are soluble in DMF and DMSO. The molar conductance value suggests that these complexes are non-electrolyte in nature.
IR spectra
The IR spectra of the ligand and the metal complexes were recorded in Table-2. The prominent features in the spectrum of the ligand furfuraldoxime
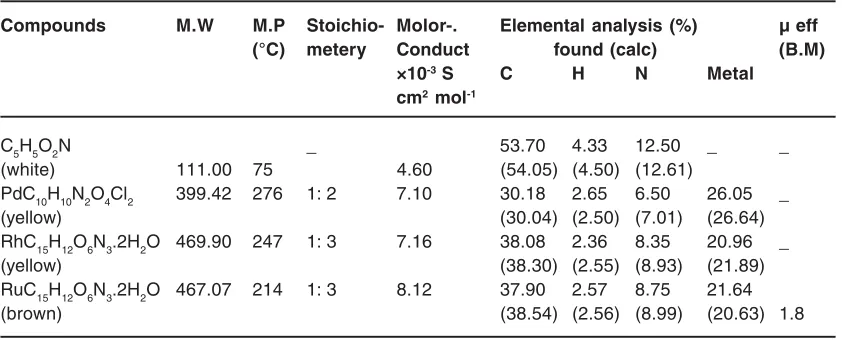
Table 1: Analytical data of ligand and metal complexes
Compounds M.W M.P Stoichio- Molor-. Elemental analysis (%) µ eff
(°C) metery Conduct found (calc) (B.M)
×10-3 S C H N Metal
cm2 mol-1
C5H5O2N _ 53.70 4.33 12.50 _ _
(white) 111.00 75 4.60 (54.05) (4.50) (12.61)
PdC10H10N2O4Cl2 399.42 276 1: 2 7.10 30.18 2.65 6.50 26.05 _
(yellow) (30.04) (2.50) (7.01) (26.64)
RhC15H12O6N3.2H2O 469.90 247 1: 3 7.16 38.08 2.36 8.35 20.96 _
(yellow) (38.30) (2.55) (8.93) (21.89)
RuC15H12O6N3.2H2O 467.07 214 1: 3 8.12 37.90 2.57 8.75 21.64
Table 2: Uv-visible, density and ir spectral data of ligand and metal complexes
Ligand/complexes IR Spectral data (cm-1 ) Electronic spectral data (cm-1)
(E=dm3 mol-1cm-1x10⁴)
ννννν(O-H) ννννν [C=N] ννννν (M-N) ννννν (M-O) Assignment for d-d transition
C5H5O2N - 29411 40816 45454
3221 1632 - (1.24) (0.80) (1.82)
PdC10H10N2O4Cl2 3205 1562 566 512 25068 31605 39745 (0.58) (1.17) (1.18) RhC15H12O6N3.2H2O 3414 1593 593 520 25706 29325 37313 (0.71) (1.09) (0.79) RuC15H12O6N3.2H2O 3351 1594 592 430 29498 - 38759
(1.79) (1.29)
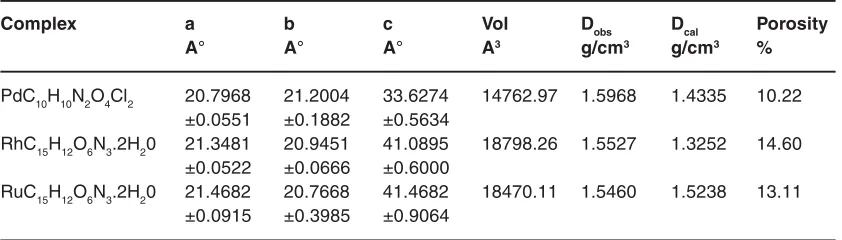
Table 3: Crystal lattice parameters of metal complexes
Complex a b c Vol Dobs Dcal Porosity
A° A° A° A3 g/cm3 g/cm3 %
PdC10H10N2O4Cl2 20.7968 21.2004 33.6274 14762.97 1.5968 1.4335 10.22 ±0.0551 ±0.1882 ±0.5634
RhC15H12O6N3.2H20 21.3481 20.9451 41.0895 18798.26 1.5527 1.3252 14.60 ±0.0522 ±0.0666 ±0.6000
RuC15H12O6N3.2H20 21.4682 20.7668 41.4682 18470.11 1.5460 1.5238 13.11 ±0.0915 ±0.3985 ±0.9064
are sharp and strong absorption band at 3200-1640 cm-1 character istic of ν (-OH) and ν(C=N) respectively. The IR spectra of metal complexes exhibit a broad absorption band in the region of 3200-3400 cm-1 with weak intensity attributed to the
ν(–OH) group 13. The peak at C.a 830 cm-1 does not appear hence confirms the absence of coordinated water as reported in literature14 It can be further confirmed by TGA analysis. IR spectrum of ligand shows a very strong band at 1632cm-1 which is assigned to ν(C=N) azomethine. The lowering of ν(C=N) azomethine group to the extent of 20-40 cm-1 in all the complexes indicates the participation of azomethine nitrogen. The ligand atom during chelation exhibit the additional bands around 593 and 520 cm-1 assigned to ν(M-N) and ν (M-O) stretching vibration respectively15, similar assignments to ν (M-N) and ν (M-O) are reported in the literature 16,17,18,19.
Electronic absorption spectra
Electronic spectrum of ligand showed three high intensity band lying at 29411, 40816, 45454cm-1 assigned to n→π* and σ→σ* transitions respectively in ligand. Pd(II) complex is dimaganetic in nature. The electronic spectrum of Pd (II) complex shows a band at 35855cm-1 due to ‘A
geometry 21. The electronic absorption spectrum of Ru(III) complex exhibit bands at 29498, 38759cm-1 which are assigned to 2T
2g→ 2A
2g and 2T
2g→ 2T
1g. The band due to the second spectrum forbidden transition 2T
2g→ 4T
2g is usually hidden under the tail of the spectrum allowed band. The magnetic moment value of Ru (III) complex is 1.80 B.M which support Ru (III) complex is octahedral in nature22,23. It is well known that all Rhodium (III) compound are diamagnetic. This is due to the combination of 3 factors viz; 1) Inherent tendency of the octahedral
d6 configuration to assume the low spin t 2g
6
arrangement. 2) The relatively high ligand field strength in the complexes of tripositive ions in the second and the third transition series. 3) The greater tendency toward spin pairing among 4dn and 5dn configuration than their 3dn analogs. The Pd (II) complex obtain by the present method is found to be identical with that obtain by Coakley and Casey by their method. It is diamagnetic and posses weakly covalent or ionic bond Pd-Cl bond.
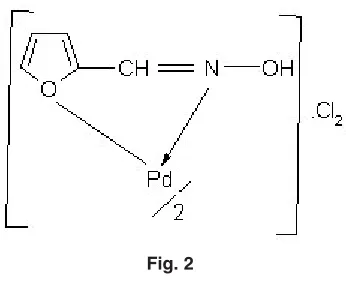
Fig. 3: M = Ru(III) and Rh(III) Fig. 2
X- ray powder diffractogram
The X-ray diffractogram of complexes were recorded in the range 50 to 600 2è value. The major refluxes were measured and the corresponding d-value were obtained an independent indexing for each of these refluxes were carried out by least square method. The Miller indices (hkl) were calculated and refined using Back-cal programme by computational method and data has been summarized in Table 3.The data indicates the monoclinic crystal system for all the complexes24. Thermal analysis
The thermal analysis of the Pd (II) complex show that it is thermally stable up to 250ºC. The complexes of Rh(III) and Ru(III) show a significant loss in weight at the temperature range 60° -170°C.This observation suggests the presence of water of crystallization. The complex of Pd (II) do not show such significant loss indicating absence of any lattice water or water of crystallization. With fur ther increase in temperature in the range
investigated, the complexes show decomposition by fragmentation and thermal degradation of the organic part of the metal complexes, finally resulting in the corresponding metal oxides.
1H NMR spectra
The 1H NMR spectra of the Ru (III) complex show broad signals due to its paramagnetic nature. However an important and easily discernible feature of the spectrum of the Rh (III) and Ru (III) complexes is the absence of the proton signal due to the =NOH group of ligand which indicate coordination through the oximino nitrogen after deprotonation. A sharp signals due to aryl proton appears in the range 6.3 – 8.3 ppm in all complexes. Biological activity
The antifungal activity of the compound was tested against Candida albicans, Candida krusci, Candida glabrata and Aspergillus fumigatus.The result, Table no 4 reveal that the ligand is inactive toward all strains; but the metal complexes are fungi toxic in nature and hence serve as vehicles for activation of the ligand as principle cyto toxic species 25.
CONCLUSION
On the basis of magnetic susceptibility measurements, crystal lattice parameters, analytical and spectral data Pd(II) complex of furfuraldoxime exhibit square planar structure where as Rh (III) and Ru (III) complexes of furfuraldoxime exhibit octahedral structure. The proposed structure of the metal complexes have illustrated in fig. 2 and 3.
1. Singh R.B., Garg B.S. and Singh R.P., Talanta, 26, 425 (1978).
2. Singh J., Malik O.P. and Gupta S.P., J. Indian Chem .Soc., 52, 656 (1975).
3. Jetley U.K., Singh J. and Rastogi S.N., Chem .Era, 15, 23(1979).
4. Lal K., Singh J. and Gupta S.P., J .Inorg. Nucl. Chem , 40, 356 (1978).
5. Kim S.J. and Takizawa T., Bull. of Jpn, 48, 2197 (1975).
6. P.S. Patel, R.M. Ray and M.M Patel , Indian J.Chem, 32A,597 (1993)
7. Alonso D., Advanced Synthesis and Catalysis 344 (2),172-183 (2002 )
8. Takei and Nishibayashi Y., Chemical Communication, (22),2360-2361 (2001). 9. Youngs W., Medicinal Inorganic Chem., 903,
414 – 427 (2005).
10. Brady D.L, and GoldStein R.T., J.Chem. Soc., 9-27 (1959).
11. Vogel, A.I., “Textbook of Quantitative Chemical Analysis” 5thEd. ELBS (1989). 12. Sherikar A. and Dhadke. P.M., Ph.D Thesis
(TKS5262) University of Mumbai (1996). 13. Nakamoto K., “Infrared Spectra of Inorganic
and Coordination Compounds”, New York, 159, 214 (1969).
14. Rao C.N. and Ferraro J.R., “Spectroscopy in
REFERENCES
Inorganic Chemistry”, Vol.10, Academic press, New York,P 149 (1970).
15. Rao N.R., Rao P.V., Reddy G.V. and Ganorkar M.C., Indian J. Chem., 26 A, 887 (1987).
16. Srivastava T.N. and Chauhan A.K.S., Indian J. Chem.,19A, 269 (1980).
17. Chatt J., Duncanson L.A. and Benanzi, Nature, 17,1042 (1956).
18. Parris E. and Long G., Inorg. Nucl. Chem., 32,1585(1956).
19. N.B. Colthup, L.H. Daly and B.E. Wiberly, “Introduction to Infrared and Raman Spectroscopy”, Academic press New York, 340 (1964).
20. Acouta A.Y., Maki A.K.T. and Mostafa M.M., Spectrochim. Acta, 44A, 1291 (1988). 21. Ozcan E. and Mizaoglu R. Synth .React.
Inorganic. Met. Org. Chem., 18(6), 559 (1988).
22. Haldar B.C, Indian J. Chem, L1, 224- 230 (1974).
23. Dhadke P.M .and Haldar B.C., J.Indian Chem.Soc., 55, 18 (1978).
24. Swar Y.A. and Mehta B.H., Asian J. of Chem., 13, 928 -932 (2001).
25. Makode T. and Aswar A.S., Indian J. Chem., 43A, 2120 (2004).