STUDY TO OPTIMIZE THE OSMOTIC
DEHYDRATION PARAMETERS OF APPLE CUBES
Rajni Kamboj
1, Manav Bandhu Bera
2, Vikas Nanda
31
Department of Food Technology, CDL State Institute of Engineering and Technology,
Panniwala Mota, Sirsa, Haryana (India)
2,3
Department of Food Engineering and Technology, SLIET, Longowal Sangrur, Punjab (India)
ABSTRACT
A specific technique used to produce high quality product of fruit being immersed in hypertonic solution of high
osmotic pressure for a specified time and temperature. To optimize the process conditions response surface
methodology was used. Independent process variables for osmotic dehydration of apple were temperature (45-
65 oC), process time (10-540 min.), solution to fruit ratio (1:1 to 3:1) and concentration of sucrose into honey
(100:5-100:15) by response surface methodology. Responses of water loss and solute gain were fitted to
polynomials, with multiple coefficients of correlation (R2) 0.99. The fitted functions were optimized for
maximum water loss and solute gain to obtain a good quality product. The low and high levels of temperature
45 and 65 oC, concentration of sucrose into honey 5 and 15 w/w, solution to fruit ratio 1:1 and 3:1 w/w and
process time 10 and 540 minutes respectively. The optimum conditions for osmotic dehydration concentration of
sucrose, temperature, time and solution to fruit ratio were 100:13, 60 OC, 420 minutes and 2:1 respectively.
Keywords: apple, honey, osmotic dehydration, response surface methodology and sucrose.
I. INTRODUCTION
Osmotic dehydration is a preservation technique to give high quality products which involves partial removing
water without change of phase [1]. Whereas, water removal by high temperatures and long dehydration times
may cause loss of nutrients and also affect sensory characteristics (flavor, color, texture, and other properties) of
the product [2]. By osmotic dehydration product obtained is of good quality and energy consumption also
reduced [3]. In osmotic dehydration, the kind of osmotic agent and its concentration strongly affected the
kinetics of water removal, the solute gain and the equilibrium moisture content [4]. In osmotic dehydration fruits
immersed in sucrose whereas vegetables are immersed in sodium chloride, solutions of high osmotic pressure
[5], which involves three types of cross current mass transfer (1) water outflow, from the product to the osmotic
medium due to concentration gradient between them. (2) a solid transfer, from the osmotic solution to the
product. (3) a leaching out of the products natural solids (sugars, organic acids, minerals, vitamins, etc.), which
is quantitatively minor compared with the first two types of transfer, but necessary relating to the composition of
the final product.
Apple is the main temperate fruit and is fourth among the most widely produced fruits in the world after banana,
cancer, prostate cancer and lung cancer. The antioxidants present in the apple have a number of health benefits
and disease prevention properties. Apple contains good quantity of fiber, iron, vitamin C, beta-carotene and
B-complex vitamins such as riboflavin, thiamin and pyridoxine. Apples also carry a small amount of minerals like
potassium, phosphorus and calcium. Response surface methodology (RSM) has practical usefulness in
optimization. It has been widely used in industries for product development and upgrading of product [1, 6].
Experimental design technique used to observe and find out the valuable type of method that entails one or more
response variables that are affected by various factors or independent variables [7].
The objective of this work was to study the effect of concentration of osmotic agents (sucrose and honey),
temperature of solution, time of immersion and solution to fruit ratio (STFR) on water loss and solute gain
during osmotic dehydration through response surface methodology (RSM).
II. MATERIAL AND METHODS
2.1 Raw Material
Experiments were conducted to study the effect of different osmotic agents, temperature of solution, time of
immersion and osmotic agent concentration on water loss and solute gain during osmotic dehydration of apple
pieces. Apples used for the testing were obtained from the market of Sirsa, Haryana. Apples thoroughly washed
with water to remove debris and peeled manually. These were cut into pieces of uniform size of (10×10 mm)
with 10 mm thickness. Blanching of samples was done in hot water to inactivate enzymes. Then pieces were
removed from the water and their surface blotted with tissue paper. Osmosis of the sample was done and initial
moisture content was determined.
2.2 Osmotic Dehydration
Sucrose and honey were used as the osmotic agents. Osmotic solution was prepared by dissolving sucrose in to
honey, beneath the conditions as given in the experimental design (Table1). Slices of apple were submerged in
the osmotic solution of sucrose into honey concentration (100:5, 100:10 and 100:15) in 500 ml beakers and
placed inside a water bath at temperature (45, 55 and 65 oC), solution to fruit ratio (1:1, 2:1 and 3:1) and
immersion time (10, 275 and 540 minutes). After each time of osmosis, samples were removed from the osmotic
solution, removal of excess of solution at the surface by absorbent paper and weighted on an electronic balance.
Osmosed samples were then used for determination of moisture.
The initial and final moisture content of sample was determined by using hot air oven method recommended by
Ranganna [8] for fruits and vegetables.
(1)
where M1= Weight of sample (gm), M2 = Weight of dried sample (gm)
(2)
where WLt= Water loss g/100g fresh sample, M0 = Weight of initial moisture (gm), M= Weight of final
moisture (gm) and W= Initial weight of sample.
where SGt= Solute gain g/100g fresh sample, St = Weight of final solid (gm), S0 = Weight of initial solid (gm),
and W = Initial wt of sample (g)
2.3 Experimental Design and Statistical Analysis
Different statistical tools, as Response Surface Methodology (RSM), are used by several instigators to study
process variables [9, 10]. Response surface methodology (RSM) was used to optimize and evaluate main
effects, interaction effects and quadratic effects of the process conditions on water loss and solutes gain. A face
centered rotatable design was used for designing the experiments for osmotic dehydration of apple pieces with
four variables and five levels. The independent variables were temperature (45-65 OC), concentration of sucrose
into honey (5-15% w/w) and time (10-540 min). The solution to fruit ratio was kept 1:1, 2:1 and 3:1 (w⁄w)
(Table 1). The experiments were conducted in three replications.
In the equation (4) the mathematical function Ψ, exists for the response variable Y (water loss and solute gain)
and four independent variables [11], (temperature, concentration, time and STFR):
Y= Ψ= (T,C,t,S)=β
0+ β
1T + β
2C + β
3t + β
4S + β
11T
2+ β
22C
2
+ β
33
t
2
+ β
44S
2+ β
12T.C + β
13T.t
+
β
14T.S+ β
23C.t+ β
34t.S+ β
24C.S
(4)
To observe the significant effect of various process variables on the various responses, analysis of the
experimental data was carried out. The regression coefficient helps to compare the comparative contribution of
every independent variable in the prediction of the dependent variable. Regression coefficients, analysis of
variance, test of lack of fit and the generation of three-dimensional graphs, superimposition of contour plots, and
optimization of process variables were calculated using Design– Export version 10.0.0 (Trail version; Statease
Inc., Minneapolis, MN,USA).
III. RESULTS AND DISCUSSION
3.1 Diagnostic checking of fitted models and response surfaces
The results of second-order response surface model in the form of analysis of variance (ANOVA) are for water
loss and solute gain given in Tables 3. The results indicated that the fitted quadratic models were highly
significant (R2 > 0.90)
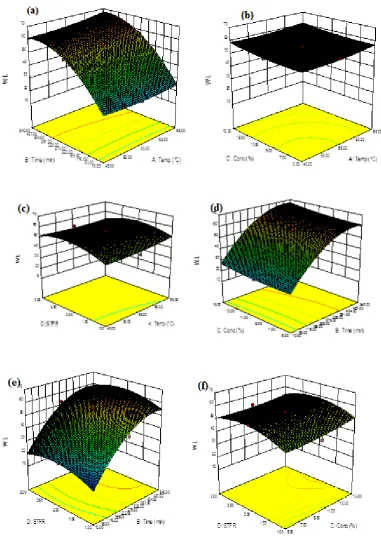
3.1.1 Water loss
The magnitude of P values from Table 3 revealed that all linear terms of process variables have significant
effect at 5% level of significance (P < 0.05) on water loss during osmotic dehydration. In quadratic terms of the
process variables time andSTFR have significant effect on water loss. Further, interaction of temperature and
time, temperature and STFR, conc and STFR has significant effect on water loss. The model F-value is 238.45,
which implies the model is significant. The relative magnitude of β values (Table 3) indicates the maximum
positive effect of time (β =19.67) followed by concentration (β = 2.34), STFR (β = 2.08) and osmotic solution
temperature (β = 1.58) on water loss. The quadratic and interaction terms of all the process parameters have
least effect on water loss as compared to the linear terms of process variables. Figure 1(a) depicts the increased
water loss with increase in temperature and time up to certain level and same trend have been found in figure
1(d) and (e). This might be because of the fact that the increase in temperature decreases the viscosity of the
outflow of water through cellular membrane [12]. The increase in water loss with osmotic solution
concentration is mainly because of the increase in the osmotic pressure gradient [13]. A similar variation in
water loss with temperature and concentration has also been observed in Fig. 1(b) and with increase in STFR
and temperature and concentration and STFR in figure 1(c) and (d) respectively water loss increased up to
certain level and then remains constant.
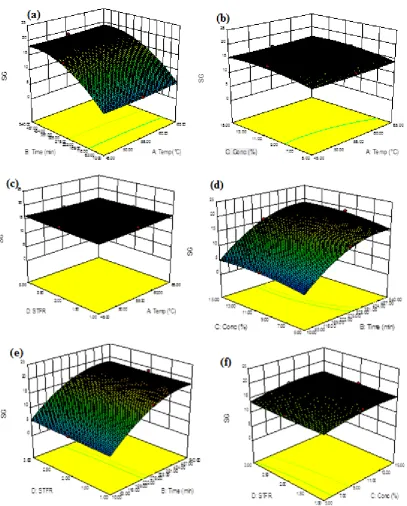
3.1.2. Solute gain
Table 3 indicates that all linear terms of process variables have significant effect (P < 0.05) on solute gain.
Further, quadratic effect of temperature and time and interaction of ‘temperature and time’ have significant
effect on solute gain during osmotic dehydration (P < 0.05). The model F-value 220.97 implies the model is
significant. The magnitude β values indicates the maximum positive effect of temperature (β = 6.56) followed
by concentration of sucrose into honey (β = 1.14), time (β = 0.35) and STFR (β = 0.27) on solute gain. Figure
2(a) depicts that solute gain increased with increase in temperature and time may be because of high diffusion
rates of solute which decreases viscosity of the osmotic solution [14]. Figure 2(b) and (c) indicated that with
increase in temperature and concentration, solute gain increased due to high concentration difference between
the beetroot and osmotic solution [15]. Figure 2 (d) and (e) revealed that solute gain enhanced with time and
concentration and STFR and time but where time interact with other process variable solute gain remains
constant after some time.
The increase in water loss and solute gain with time, temperature, concentration of sucrose into honey and STFR
may also be because of agitation given during osmotic dehydration process which reduces the mass transfer
resistance between the surface of beetroot and osmotic solution [16].
3.2 Optimization of osmotic dehydration process
To optimize the process conditions for osmotic dehydration process by numerical optimization technique, equal
importance of ‘4’ was given to all the four process parameters (viz. temperature, time, concentration of sucrose
into honey and STFR). However, based on their relative contribution to quality of final product, the importance
given to different responses was given to maximum water loss and minimum solute gain. The optimum
conditions for time, temperature, concentration of sucrose into honey and STFR were 420 min., 60 oC, 13%
(w/w) and 2 (w/w), respectively to get water loss 65.75 g/100g fresh sample and solute gain 15.59 g/100g fresh
sample. The optimum processing conditions were experimentally verified twice and proven to be adequately
reproducible with ±0.1% deviation.
IV. CONCLUSION
Response surface methodology was effective in optimizing process parameters for the osmotic dehydration of
apple the process time 330 to 420 min., temperature 55- 60oC, concentration of sucrose into honey 8 to13%
(w/w) and STFR 2-3 (w/w). The regression equations obtained in this study can be used for optimum conditions
for desired responses within the range of conditions applied in this study. Optimum solution by numerical
optimization obtained was time 420 min, temperature 60 oC, concentration of sucrose into honey 13% (w/w) and
V. ACKNOWLEDGEMENT
The authors gratefully acknowledge CDL State Institute of Engineering and Technology, Panniwala Mota and
SLIET, Longowal.
REFERENCES
[1] P.M. Azoubel, and F.E.X. Murr, Optimization of osmotic dehydration of cashew apple (Anacardium
occidentale L.) in sugar solutions, Food and Science Technology International, 9(6), 2003, 427-433.
[2] A. Lenart, and R. Dabrowska, Kinetics of osmotic dehydration of apples with pectin coatings, Drying
Technology, 17(7-8), 1999, 1359-1373.
[3] V.R. Sagar, and P. Suresh Kumar, Recent advances in drying and dehydration of fruits and vegetables:
A review, Journal of Food Science and Technology, 47(1), 2010, 15-26.
[4] M. Ali Khan, R.N. Shukla, and Sadaf Zaidi, Mass Transfer during Osmotic dehydration of Apple using
Sucrose, Fructose and Maltodextrin Solution, Available at:
www.icef11.org/content/papers/fms/FMS779.pdf.
[5] J.S. Alakali, C.C. Ariahu, and N.N. Nkpa, Kinetics of osmotic dehydration of mango. Journal of Food
Processing and Preservation, 30(5), 2006, 597-607.
[6] O. Corzo, and E.R. Gomez, Optimization of osmotic dehydration of cantaloupe using desired function
methodology, Journal of Food Engineering, 64(2), 2004, 213-219.
[7] A. A. El-Aouar, P.M. Azoubel, J.L. Barbosa Jr., and F.E.X. Murr, Influence of the osmotic agent on the
osmotic dehydration of papaya (Carica papaya L.), Journal of Food Engineering, 75(2), 2006, 267-274.
[8] S. Ranganna, Handbook of analysis and quality control of fruit and vegetables product (New Delhi: Tata
McGraw-Hill Publishing Limited Company, 2001).
[9] P. Vijayanand, N. Chand, and W.E. Eipeson, Optimization of osmotic dehydration of cauliflower,
Journal of Food Processing and Preservation,19(4), 1995, 229-242.
[10] B. Singh, P.S. Panesar, V. Nanda, and J.F. Kennedy, Optimisation of osmotic dehydration process of
carrot cubes in mixtures of sucrose and sodium chloride solutions, Food Chemistry, 123(3), 2010,
590-600.
[11] P.M. Azoubel, and F.O. da Silva, Optimisation of osmotic dehydration of ‘Tommy Atkins’ mango fruit,
International Journal of Food Science and Technology, 43(7), 2008, 1276-1280.
[12] G. Panades, P. Fito, Y. Aguiar, M. Nunez de Villavicencio, and V. Acosta, Osmotic dehydration of
guava: influence of operating parameters on process kinetics, Journal of Food Engineering, 72(4), 2006,
383-389.
[13] P.M. Azoubel, and F.E.X. Murr, Mass transfer kinetics of osmotic dehydration of cherry tomato,
Journal of Food Engineering, 61(3), 2004, 291-295.
[14] B. Singh, A. Kumar, and A.K. Gupta, Study of mass transfer kinetics and effective diffusivity during
osmotic dehydration of carrot cubes, Journal of Food Engineering, 79(2), 2007, 471-480.
[15] K.O. Falade, and J.C. Igbeka, Osmotic dehydration of tropical fruits and vegetables, Food Reviews
[16] N.M. Panagiotou, V.T. Karathanos, and Z. B. Maroulis, Effect of osmotic agent on osmotic dehydration
of fruits. Drying Technology, 17(1-2), 1999, 175-189.
Table 1: The levels of different process variables in coded and un-coded form for the osmotic
dehydration of apple
Independent Variables Coded Levels
-1 0 1
Temperature (A, oC) 45 55 65
Time (B, Minutes) 10 275 540
Concentration of sucrose (C, %) 5 10 15
Solution to Fruit Ratio (D, w/w) 1 2 3
Table 2 Experimental data for water loss (WL) and solute gain (SG) under different treatment
conditions of temperature (T), time (t), concentration of sucrose into honey (C) and solution to
fruit ratio (STFR)
T (OC) t (min.) C (%) STFR (w/w) WL SG
45 540 5 3 58.23 16.31
65 275 10 2 57.22 16.13
55 275 5 2 54.57 14.14
55 275 10 2 55.67 15.25
55 275 15 2 56.75 15.87
55 275 10 2 55.67 15.25
65 540 15 1 66.95 20.54
55 10 10 2 23.43 5.44
45 10 15 3 24.99 6.03
45 540 5 1 50.01 15.22
65 10 15 3 22.82 6.57
65 10 5 3 19.32 4.04
55 275 10 3 52.83 16.02
65 540 5 3 60.83 16.48
45 540 15 1 57.78 18.00
55 275 10 2 55.67 15.25
45 540 15 3 61.02 19.33
45 10 5 3 22.11 4.13
65 540 15 3 64.84 18.69
65 10 15 1 20.64 5.22
65 10 5 1 18.95 3.99
55 275 10 1 43.56 16.25
55 275 10 2 55.67 15.25
65 540 5 1 58.30 16.84
55 275 10 2 55.67 15.25
55 275 10 2 55.67 15.25
45 10 5 1 12.30 2.57
55 540 10 2 61.73 18.87
45 275 10 2 54.00 16.43
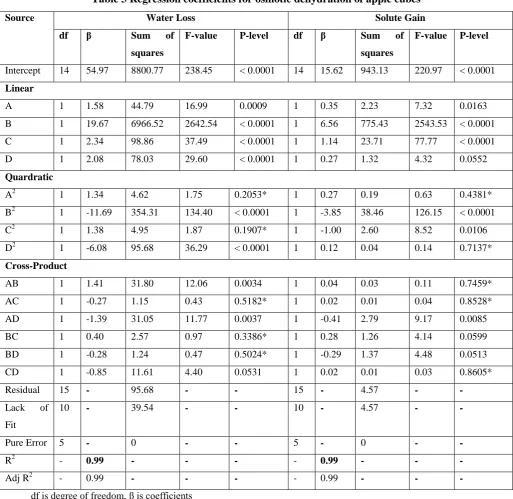
Table 3 Regression coefficients for osmotic dehydration of apple cubes
Source Water Loss Solute Gain
df β Sum of
squares
F-value P-level df β Sum of
squares
F-value P-level
Intercept 14 54.97 8800.77 238.45 < 0.0001 14 15.62 943.13 220.97 < 0.0001
Linear
A 1 1.58 44.79 16.99 0.0009 1 0.35 2.23 7.32 0.0163
B 1 19.67 6966.52 2642.54 < 0.0001 1 6.56 775.43 2543.53 < 0.0001
C 1 2.34 98.86 37.49 < 0.0001 1 1.14 23.71 77.77 < 0.0001
D 1 2.08 78.03 29.60 < 0.0001 1 0.27 1.32 4.32 0.0552
Quardratic
A2 1 1.34 4.62 1.75 0.2053* 1 0.27 0.19 0.63 0.4381*
B2 1 -11.69 354.31 134.40 < 0.0001 1 -3.85 38.46 126.15 < 0.0001
C2 1 1.38 4.95 1.87 0.1907* 1 -1.00 2.60 8.52 0.0106
D2 1 -6.08 95.68 36.29 < 0.0001 1 0.12 0.04 0.14 0.7137*
Cross-Product
AB 1 1.41 31.80 12.06 0.0034 1 0.04 0.03 0.11 0.7459*
AC 1 -0.27 1.15 0.43 0.5182* 1 0.02 0.01 0.04 0.8528*
AD 1 -1.39 31.05 11.77 0.0037 1 -0.41 2.79 9.17 0.0085
BC 1 0.40 2.57 0.97 0.3386* 1 0.28 1.26 4.14 0.0599
BD 1 -0.28 1.24 0.47 0.5024* 1 -0.29 1.37 4.48 0.0513
CD 1 -0.85 11.61 4.40 0.0531 1 0.02 0.01 0.03 0.8605*
Residual 15 - 95.68 - - 15 - 4.57 - -
Lack of
Fit
10 - 39.54 - - 10 - 4.57 - -
Pure Error 5 - 0 - - 5 - 0 - -
R2 - 0.99 - - - - 0.99 - - -
Adj R2 - 0.99 - - - - 0.99 - - -
df is degree of freedom, β is coefficients