Measurement of fluid motion and temperature changes in the real
model of the heat exchanger using pLIF
D. Jasikova1, M. Kotek2, and V. Kopecky1
1
Faculty of Mechatronics, Informatics and Interdisciplinary Studies, Technical University of Liberec, 46117 Liberec, Czech Republic
2 Institute for Nanomaterials, Advanced Technologies and Innovation, Technical University of Liberec, 46117
Liberec, Czech Republic
Abstract. The aim of this project is a qualitative and quantitative experimental description of a development of the fluid flow inside the real model of a stratification tank of the heat exchanger. The experimental research deals with the Particle Image Velocimetry method and Planar Laser Induced Fluorescence Method. The results of this project provide the worthy information about the fluid behaviour, boundary condition and risen fluid flow inside the tank model. This final outcome is necessary for the verification and validity of the analysis models and simulations.
1 Introduction
The solar system for domestic hot water storage (SDHW) is a standard equipment of each foreign household. In Czech Republic is the popularity of solar system lower due the climatic reasons and the production of solar system stagnate.
The number of sunny hours, according to the study of Czech Hydro meteorological Institute (CHI), is 1386 for years between 1961 and 1990. The most suitable locations for usage of SDHW are West and South Bohemians and South Moravian with the highest number of sunny hours per year. Due the global heating are the climate changes significant also in Czech Republic. The research of CHI also included the prediction of the climate development for the next 60ty years. According to this study the number of sunny hours should increase in 9% and this fact would also influence the present location as well as Middle and East Bohemians and Nord Moravia in a sense of suitable climate for SDHW usage [1]. This prediction pronounced by CHI should also influence the industrial production attitude to SDHW and its investigation, design and optimization.
The usage of simple solar system that is based on a solar loop heat exchanger and electrical auxiliary heater and are often used in south countries, e.g. Jordan, Italy, Spain, does not work in cool climate.
The SDHW has to be better isolated and the certain problem is their function during the cold winters, when there are still enough sunny days, but outer temperatures often drop to minus 10 °C during the day and minus 20 °C during nights. For this reason the heat medium in
solar heating system (TES) is not water, but the non-freezing mixtures with different heating capacity. Due the low temperatures the solar heating is not efficient enough to cover the household demands, so the SDHW has to be completed with the heating unit, usually electrical. The second reason for low efficiency of SDHW is the temperature of incoming water. During the winter season the temperature of water in the water pipes is 5 °C and during summer season reaches up to 15 °C, the average temperature is usually 10 °C.
The studies describing possibilities in optimization of stratification tank came from the measurements based on the array of temperature probes in 9 horizontal and 4 vertical levels inside the real tanks. The authors of the article themselves express that this method is only rough study and for verification of the numeric simulation and estimation of mathematic models is insufficient and suggest some of the visualization method. [2]
The investigation using T-couples also uncovered the localize recirculation that leads to water mixing and causes lower efficiency of stratification. This effect was also described in context of influence of ambient and operating conditions on thermal stratification, or in theme of tank geometry effect at low Reynolds number to support the stratification efficiency. [3 - 6]
The inner design of heating circuit in the stratification tanks plays a key role on efficiency of the whole SDHW system. Proper and validated mathematical analysis helps to understand and optimize the stratification process, especially the part with the heated water flow close to the heating units.
© Owned by the authors, published by EDP Sciences, 2013
2 Experimental analyses
2.1 Model of stratification tank
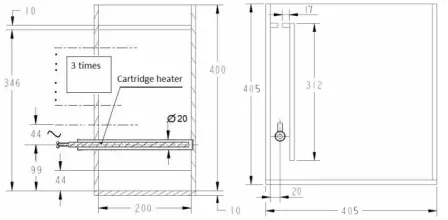
The aim of this project was a qualitative and quantitative experimental description of a development of the fluid flow inside the real model of the stratification tank as a part of SDHW system. For the purpose of this study was designed and fabricated a model of heat exchanger in real scale. The model containing three heating elements was built from extruded acrylics (PMMA). The PMMA is suitable material for its physical and temperature properties. This model is one part of the complex heat exchanger; the proportions were kept in the ratio 1:1 to the real one. The model schema with the inner build and the heating pipe unit placement is shown on figure 1. This model was designed in the consideration that the experiment would be visualized and measured by optical methods, so it enabled sufficient optical access. [7-12] We can classify this model as an indirect type of the stratified water tank configured as immersed coils in the tank. This type of heat exchanger enables keeping the thermal stratification state due the natural convection, but the energy efficiency will be decreased due the insufficient heat transfer between the separated media in the higher section with the hot water. The model of stratification tank for experimental investigation was constructed as a half cut of real heat exchanger with corresponding geometry. [13]
Fig. 1. The model of stratification tank. A) the side view on the model, B) the front view on the model with dimensions.
The heating system that in real consists of coils leading the warmed up water from the solar system was replaced by cartridge heater regulated by thermostats. For the purpose of the experiment we used the heating units DW-Easytherm with working distance 200 mm and outer diameter 20 mm. The maximum heat power was 40 W cm-2 with the wattage of each cartridge heater 500 W. The coating of the heating unit is made of stainless steel and the temperature resistance between the inner heating spiral and the coating is minimal. This ensure the minimal loses and precise regulation.
The cartridge heaters were joined in the backward closed loop and were regulated by microprocessor Microchip PIC16F631. For direct surface temperature measurement were used temperature sensors GSM-DIN2B based on
Dallas DS18S20 with digital outcome. The temperature sensor working range was from – 50 °C to + 125 °C. The regulation was set in the range from – 10 °C to +85 °C with precision +/- 0.5 °C. The regulation of thermostat was set on two temperatures. The low temperature starts heating and the upper temperature stops. The difference between those setting temperatures was 0.5 °C. Each heating unit was regulated by own microprocessor.
The cartridge heaters were built in stratification tank vertically in distance 30 mm.
Fig. 2. Thermo camera view on the heating unit with set the surface temperature at a) 60 °C and b) 80 °C. The surface temperature decrease is visible at the ends of unit. The surface
temperature also shows gradient areas.
To ensure the continuous temperature distribution we examined each cartridge heater with Fluke thermo camera (Figure 2). Using this method was also tested the heating regulation. The temperature decrease at both ends of the unit and this fact was reflected during the building the unit in the model.
2.2 Measurement technique
The heating in the real model of stratified tank was investigated using the pLIF and PIV method. Both measurement techniques can be combined into one experimental setup. Using this advanced alignment so we could get the results of temperature field and fluid velocities at one moment.
The optical measuring method Planar Laser Induced Fluorescence (pLIF) uses the fluorescence dye that is added in certain concentration in the investigated fluid. Here we used the Rhodamine B fluorescent dye for the fluids temperature measurement. The measurement was based on a well-defined relationship between the intensity of the fluorescence and the temperature, while other experimental parameters were constant. [14] The fluorescence physically corresponds to an atomic de-excitation process with emission of a photon of lower energy than the one which caused the excitation.
In principle the fluorescent dye emits the light on different wavelength then that it is required for their excitation.
re-emitted light to enter the CCD detector of the digital camera.
The fluorescence intensity varies with the local excitation energy inside the sampling volume, the temperature T inside volume V and the physical properties of the medium.
Rhodamine B is the most frequently used dye for pLIF measurements in liquids. This dye is highly soluble in polar liquids and is very chemically stable for very large range of concentration levels. It can be emitted with laser wavelength around 550 nm and the peak of emission light distribution is 590 nm. The spectral characteristics of the dye are close to the Nd:YAG lasers (the lasers with wavelength 532 nm).
Fig. 3. The emitted and emission signal of Rhodamine B fluorescent dye.
According to the measured range of temperature in range (5 - 50) °C was suitable concentration of fluorescent dye 0.1 10-4 % with the average laser light intensity. Using this concentration the calibration curve was linear (Figure 4). The certain concentration of fluorescent dye in fluid was chosen to prevent overexposure pictures in the range of expected temperatures. From previous research there exists dependence between the local concentration of fluorescent dye and the emitting light intensity (laser).
Fig. 4. The calibration curve temperature T [°C] vs. intensity I[units] for the concentration of Rhodamine B fluorescent dye
for temperature range (5 - 45) °C.
Parallel to the pLIF measurement the fluid flow was investigated on the character of flow and velocity using
Particle Image Velocimetry method (PIV). The PIV method was developed for the measurement characteristics and velocities of the fluid flow. It is based on the principle of superposition of the small particles carried by the flow. This superposition is analysed with correlation method based on FFT. The investigated area of fluid flow is illuminated with the pulse laser light sheet in certain time delay. The shifted position of particles is captured by CCD detector of camera.
The measurement using pLIF and PIV method was enabled thanks the special lens fitting adapter using two parallel cameras. For illumination was used NewWave Gemini Nd:YAG pulsed laser of energy in each pulse 120 mJ. The duration of one pulse was 10 ns. The light sheet used in this study was 3 mm thick. The image records were captured by two CCD cameras of the spatial resolution (1280x1024) px. Each camera was fitted with the lens of focal length 60 mm; the camera for the pLIF method was set up with low pass filter transmitting light of wavelength 570 nm and the one for PIV method with low pass filter passing 532 nm light wavelength. The PIV method used the seeding medium silver coated hollow glass spheres with average diameter 10 µm. This seeding medium enables high reflection of illuminated light and due its smooth surface does not capture the fluorescent dye on its surface, so the reflected light can be separated from the emission dye by the 532 nm low pass optical filter.
2.3 Experimental setup
The experiment was divided into two parts. The first part of investigation included the close surrounding of cartridge heaters. The purpose of this experiment was to observe the development of the stream of heated fluid that moves up due the natural convection. For the mathematical simulation it was important to measure the real velocity of the fluid motion and the temperature of the heated water stream in time. The measurement should also prove the turbulent characteristic of the fluid. The second part of experiment setup was focused on the whole stratification tank. Here we observed the rise of the fluid motion and the effect on its behaviour and acceleration.
For the illumination of both investigated areas was necessary to ensure the broadcast lightening of the whole area. The laser light sheet is usually brought to the model from one side and the camera view is perpendicular to it. Here the heating units created dark shadow behind. The shadows affected proper temperature measurement as well as the fluid velocity movements. This problem was partly solved using optical mirrors, which under degree reflected light back to investigated area. Using the mirrors was not totally ensured uniform lightening of the whole room, the reflection of the light was only 70 %, but the difference in the light intensity was reduced during the calibration.
The regulation of cartridge heater was set to keep the surface temperature 50 °C.
3
Results
3.1 Model with one heating unit
During the starting experiment we observed the characteristic behaviour that is close to the laminar mathematical model simulation. The first set of measurements started with only one cartridge heater and the behaviour of the heated water stream was investigated. We had results from both the k-ω model and laminar model.
Fig. 5. The comparison of experimental results, calculated k-ω and laminar models with marked distance of analysed vector
profiles.
The first part of investigation was focused on the area just above the one heating pipe. We were monitoring the temperature evolution till we reached the medium temperature peak.
The designed heat exchanger was modelled using the Fluent 6.3 software. Computation region was represented with structured mesh in 2D Cartesian coordinates. The model geometry is coming out from real proportions of stratification placing.
The walls of the model were defined with physical properties of acrylic glass (PMMA) of constant density values 1180 kg m-3, the heat conductivity 0.19 W (m K) -1 and specific thermal capacity 1465 J (kg K)-1 . The model lid and the bilge are considered perfect heat isolated. The tank model is placed in the gravity field with gravitational acceleration 9.80665 m s-2. As the storage medium was considered pure water modelled as an incompressible viscose liquid with constant heat conductivity 0.6 W (m K)-1, specific thermal capacity 4182 J (kg K)-1 and dynamic viscosity 1,003×10-3 Pa s. The liquid density was defined as a polynomial regress function of absolute temperature used in temperature range 273.15 K ≤ T ≤ 328.15 K. The simulation of viscose flow was calculated in two different models.
The first model considered the dominant laminar viscosity, in second one was used two equation turbulence viscose model k-ω SST. For the calculation of non-stationary task was applied the second order discrete schema in Fluent 6.3 software. Initialization of the
calculation was performed for the medium temperature 22 °C. The surface of the heating pipe unit was as a boundary condition with constant value 47 °C.
The experiment and the simulation proceeded in time steps 5 minutes during the 90minutes measurement run. The maximal expected flow velocities were 0.015 m s-1. There were assumed the hot water velocity 0.02 m s-1 in a realistic value of natural convection. [3] Using one heating unit the maximum velocity of hot water flow was 0.012 m s-1.
The raise of the drift velocities achieve the raise of the heat transfer coefficient. The 200 dataset were captured in every single time step for the statistical evaluation of flow velocity and stream behaviour and also same value dataset of the temperature recording images.
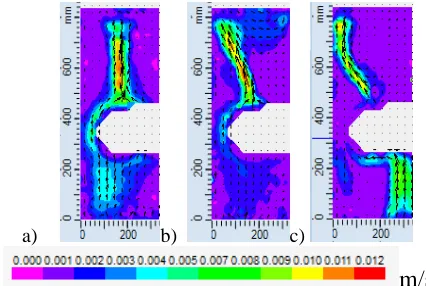
The experimental examination led to the calculation of absolute flow velocities vector maps, scalar velocity distribution and temperature field development in time. The results of the experimental measurement are show on figure 6. The temperature records are in the good agreement with the flow field behaviour.
a) b) c)
m/s
Fig. 6. The scalar and vector maps of the hot water flow, study of one heating unit. The scalar map of calculated flow velocities
in three time steps: a) 5, b) 15 and c) 25 minutes from the start of heating up.
could be developed the vortex. The vortexes influence the liquid behaviour in the whole area.
Fig. 7. The velocity profiles were taken above and below the heating pipe unit in distance 15mm from the pipe surface. The
profiles develop in the time steps 5, 15 and 25minutes.
This results show that the water heating up can be studied as a one phenomenon, because it is non stationar. At first there was a good response with k-ω model, but after 10 minutes from start up heating it turned into the laminar flow that snapped to the outer wall of the stratification tank.
3.2 Model with three heating units
The second part of the experiments was focused on the situation with three heating units, in our case the interior heating pipe system was replaced with regulated cartridge heaters.
The following set of experiment should prove the dominant behaviour of the hot water flow in independence on numbers of heating units.
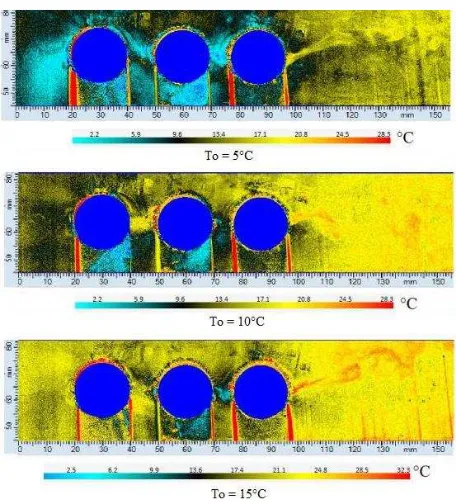
The thermostats were set on working surface temperature of cartridge heaters at 50 °C. The temperature of the inlet water T0 varied at 5 °C, 10 °C and 15 °C according to temperature changes in water pipes among the seasons. The captured data were processed with Cross-Correlation function with parameter of Interrogation area (32x32) px for the detailed view on the fluid flow between the heating units and (64x64) px for the whole model view.
Fig. 8a. The heated water flow after one minute.
After one minute from starting heating up it is visible stream of hot water ascendant and reflecting towards inner wall construction. In 15 minutes the situation changes and the stream of heated water snap to the outer wall. The outer wall of the stratification tank were not isolated to provide good optical access into the investigated room, so the stream is influenced by the surrounding of temperature 23 °C. This behaviour followed the same characteristics that were measured with only one heating unit (Figure 8a) and 8b)).
a)
b)
c)
Fig. 9.The charts of average water temperature in the distance 150 mm far from the up cartridge heater a) the starting temperature T0 in the stratification tank was 5°C, b) 10°C, c)
15°C.
In the distance of 150 mm above the up heating unit was calculated the profile plot of the temperature distribution. The plots show the average, the maximum and minimal temperature. The profiles show the dependence between the time and temperature measured in the upper levels of the stratification tank. The datasets can be interlaid with
the curve of exponential character with time constant derivate from initial temperature T0.
3.3 Evaluation of the stratification effect using PIV method
The method PIV was used here for qualitative and quantitative characteristic of the hot water flow raised by heat convection.
The measurement was divided into three parts, and there were investigated three initial water temperatures T0 5 °C, 10 °C and 15 °C. The measured velocities of fluid flow were in the range (0.003 – 0.007) m/s and there is significant time dependence and temperature gradient. The velocity of the heated water flow slow down according to the heating up of the fluid in the higher levels of stratification tank.
a)
b)
c)
Fig. 10.The relationship between the velocity of heated water flow and temperature gradient in the distance 150 mm far from
the up cartridge heater. a) the starting temperature T0 in the stratification tank was 5 °C, b) 10 °C, c) 15 °C.
3.4 Evaluation of the whole model of stratification tank
the stratification tank is balanced the gradient between the hot and cold water at the inlet. During the heating of the water in the heating section that is divided by inner wall should not occur any mixing effect.
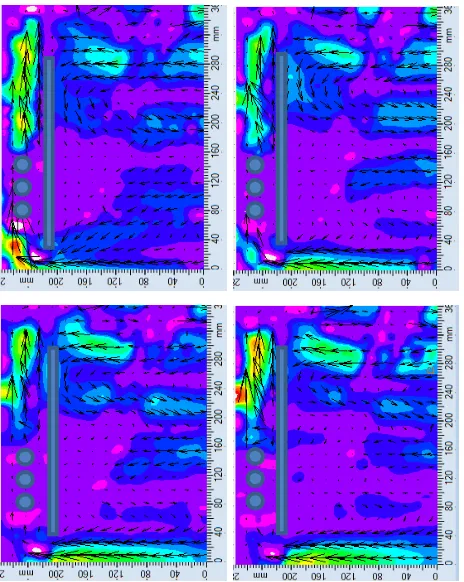
Fig. 11.The scalar and vector map of the fluid flow in the whole model of stratification tank. The picture also shows the
inner construction of the tank and cartridge heaters.
The figure 11 shows the steady of the heated water flow. The most important area is the thermoclima phase in the middle. In this area the fluid flow shows very slow motion. The highest velocities – 0.012 m s-1 were reaching in the space between the cartridge heaters and inner wall. This kind of flow is influenced by the inner construction; the flow here is accelerated towards the upper outlet zone. Due the heating up and acceleration of the water, the cold water from bottom is sucked in from the main chamber of the stratification tank. The acceleration phase slowed down, as the gradient between the surface temperature of the cartridge heaters and water decreased.
4 Discussions
The investigation of the effects formed during the storage medium heating up was realised using the visualisation of Particle Image Velocimetry parallel with Planar Laser Induced Fluorescence technique. The experimental part of the research unveiled the disagreements in numerical simulation of the physical model. The measurements proved the suitability of the numerical model for needs of the more complex research. In the real model the fluid
flow is more influenced by the complex inner arrangements of the heating up pipe system. The next research would follow the real model line in mapping the complex temperature and flow field characteristics
The placing of the inner construction also affects the implemented heating of the medium. The limited space around the implementation of the heating leads to the local temperature increase and heated water flow acceleration. The medium makes the thermal stratification more effective. This facts show the purpose of the medium dynamics investigation close to the heating unit.
It is possible to perform the numerical simulation, but only experimental data may show practicability and reliability of the simulation. To investigate the medium behaviour in storage by means of numerical simulation, the two-dimensional model was created physically identical to the tracked region.
The temperature changes of the medium inside the heat exchanger gave us the most important characteristics of the process itself.
Authors gratefully thank for the student grant support of the Technical university of Liberec and projects CZ.1.05/2.1.00/01.0005 and CZ.1.07/2.3.00/30.0024.
References
1. The project on support of science and research: SP/1A6/108/07 (2007-2011, MZP/SP).
2. M.G.Abu-Hamdan, Y. H. Zurigat, A. J. Ghajar, Int. J. Heat Mass Transfer 35, 8 (1992)
3. N. Altuntop, et.al, Applied Thermal Engineering 25 (2005)
4. J. Blumenberg, et.al, Renewable Energy 10, Z/3 (1997)
5. N. Cardinale, F. Piccininni, P. Stefanizzi, Renewable Energy 28 (2003)
6. C. A. Cruickshank, S. J. Harrison, Energy and Buildings 42 (2010)
7. P. P. Singh, Encyclopedia of Agricultural, Food, and Biological Engineering 1, (Dekker, 2004)
8. M.F.W. Distelhoff, et.al, The Canadian Journal of Chemical Engineering 75 (1997)
9. S. Furbo, E. Andersen, et.al, Solar Energy 79 (2005) 10. M. Y. Haller, et.al, Solar Energy 84 (2010)
11. M. Y. Haller, et., Solar Energy 83 (2009)
12. E. Andersen, S. Furbo, J. Fan, Solar Energy 81 (2007)
13. Y.M. Han, et.al., Renewable and Sustainable Energy Reviews 13 (2009)