Title: The Silent Partners
Author: Gal Almogy, PhD
Abstract:
Despite great advances in understanding the dynamics of viral epidemics, the emergence of rapidly spreading, highly pathogenic viruses remains a realistic and catastrophic possibility, which current health systems may not be able to fully contain. An intriguing feature in many recent zoonotic viral outbreaks is the presence of superspreaders, which are infected individuals that cause dramatically more new cases than the average. Here I study the effect of
superspreaders on the early dynamics of emerging viruses that have not gained the capacity for efficient human-to-human transmission, i.e viruses with R0 < 1. I show that superspreaders have a higher chance of rapid extinction, but under crowded conditions can lead to outbreaks, causing far more cases than regular viruses. I suggest that outbreaks of highly pathogenic superspreaders are more likely when they coincide in time and space with an unrelated
outbreak leading to increased hospital admission rates. These superspreader outbreaks may be difficult to detect, especially in the context of a different epidemic in progress, and can
significantly affect mortality patterns observed in affected areas.
Keywords:
Mathematical model; SARS; COVID-19; Superspreaders; Viral outbreaks; H7N9; Influenza; zoonotic
Author affiliation: Flurensics, Tel Aviv Contact email: [email protected]
Introduction
Mathematical models play an increasingly important role in studying pathogen dynamics and guiding public health policies. In a basic SEIR model for viral spread the host population is divided into 4 compartments: susceptibles (S), exposed (E), Infected (I), and removed (R). Susceptibles become exposed to the pathogen after interacting with infected individuals, and after an incubation period exposed hosts progress to the infected compartment. The infected then transmit the pathogen to susceptible hosts until they recover and develop immunity, or die, and are so ‘removed’ from the transmission process. The average number of new cases caused by infected individuals is denoted by R0. When R0 is greater than 1 the virus is expected to survive, and when R0 < 1 then each infected individual causes on average less than 1 new case, leading to extinction of the virus. Numerous variations on this model have been developed in efforts to represent the complex biological reality more accurately (1-5).
Data accumulated during the SARS outbreak in 2003 revealed a large variability in the number of new cases caused by SARS-CoV infected individuals, where the majority of patients caused no additional transmissions, but a small fraction of patients, termed ‘superspreaders’, caused far more transmissions than the overall R0 would suggest (6-8). Superspreader phenomenon was observed in several self-limiting outbreaks of highly pathogenic viruses that have not gained the capacity for efficient human-to-human transmission, including MERS outbreaks in Saudi Arabia and Korea (9-11), and recent Ebola virus outbreaks in West Africa (12).
It is not clear why superspreader phenomenon is so common in outbreaks where the
reproductive number of the virus is subcritical (9-12), i.e when R0 =< 1, transmission is possible but each case leads to slightly less than one additional case on average. Here I study the effect of superspreaders on the early dynamics of emerging, subcritical viruses that have not gained the capacity for efficient human-to-human transmission.
Using an Agent-Based Model (ABM) I investigate the dynamics of a generic virus, Vx, capable of creating 2 types of infected hosts: IH that can cause a large number of new cases (i.e superspreaders), and IL that cause very few cases if any (13-15).
I show that as the average number of cases caused by IH grows, Vx survives less frequently but survival can rapidly lead to large outbreaks. Importantly, even when the average R0 is set to values < 1, Vx with lower rH values often survive over multiple transmission rounds, although their incidence never reaches outbreak levels. While the survival rate of Vx with very high rH values is lowest, when these Vx survive they are more likely to cause large outbreaks; the probability of such outbreaks occurring is highly dependent on the number of susceptibles the average infected person can interact with. In healthcare facilities this number is likely to be correlated with the level of serious morbidity in the community.
Methods
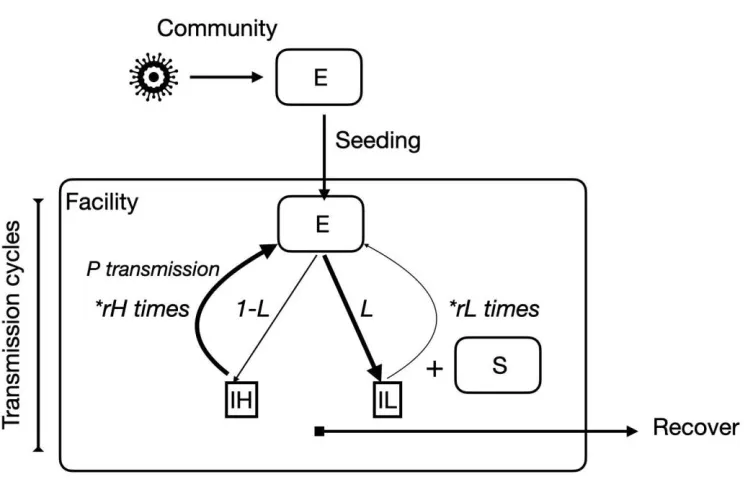
The dynamics of Vx are described using an agent-based model (ABM) with six compartments, or states for the agents: Susceptible (S), Exposed (E), Infected-low (IL), Infected-high (IH), Removed-recovered (R), and Removed-died (Rd).
The virus is introduced into new settings through “seeding events”, i.e Vx infected agents. There are two types of infected in the model: IL that transmit the virus inefficiently and cause few additional cases on average, and IH superspreaders that transmit Vx very efficiently and cause far more cases on average. The parameter L describes the proportion of E individuals that become IL, and 1-L the proportion that become IH superspreaders (1>L>0). Infected agents progress to recover, R, or die, Rd at rates gamma and 1 - gamma, respectively; I assume recovery/death rates are similar for IL and IH. The resulting dynamics are depicted graphically in figure 1.
Generally, the number of cases caused per an infected agent is a product of the number of susceptibles it interacts with during the infectivity period and the probability of transmission per interaction. Hence there are two ways to explain why IH agents cause more transmissions on average than IL: IH agents interact with more susceptible agents during the infectious period, or that the probability of transmission per encounter is much higher for IH. For the purpose of this study I assume the transmission probability per encounter, p_t, is similar for IL and IH, but the range of transmission, r, is much higher for IH, i.e:
p_t(IL) = p_t(IH)
r(IH) = rH >> r(IL) = rL
The “fitness”, or average number of new cases per infected (when the number of susceptibles is non-limiting), is hence p_t*rL for IL and p_t*rH for IH. The overall fitness of Vx is the weighted sum of the fitness for IL and IH, i.e:
Results
The effect of rH on survival and outbreak dynamics
The focus of this study is the effect of superspreaders on the outbreak dynamics of viruses with subcritical fitness, i.e an R0 value smaller than one.
Superspreaders are defined by the maximal number of cases they can cause, rH, and the proportion of infected that are IH. For simplicity I define rL = 0, and so the fitness of Vx is entirely determined by IH. When L = 0 there is only one type of infected, IH, and the fitness of Vx is equal to p_t*rH. As the proportion of infected that are superspreaders decreases (L increases) fitness is modified to:
fitness = p_t*rH*(1 - L)
And to maintain the same fitness value, rH value must grow accordingly, leading to the following ratio:
1-L = 1/rH
In which case the overall fitness is constant and equal to:
fitness = p_t*rH*(1/rH) = p_t, 0 < p_t < 1
In the trivial case when L = 0, all infection cases are IH (1-L = 1), rH = 1, and each infected can cause one additional case at probability p_t. In this trivial case the dynamics of Vx are identical to those of a regular virus with R0 = p_t, and the probability of Vx surviving past the seeding event, and then per each transmission round is simply p_t. Since the overall number of infected does not grow beyond 1, probability of extinction, per transmission round, remains constant at 1 - p_t. For L values greater than zero the situation is more complex after the first seeding event. E.g when rH = 2 (L = 0.5) only half of imported cases are IH, but these can cause 2 new cases per infection, and each new case that is IH can lead to two more cases and so on.
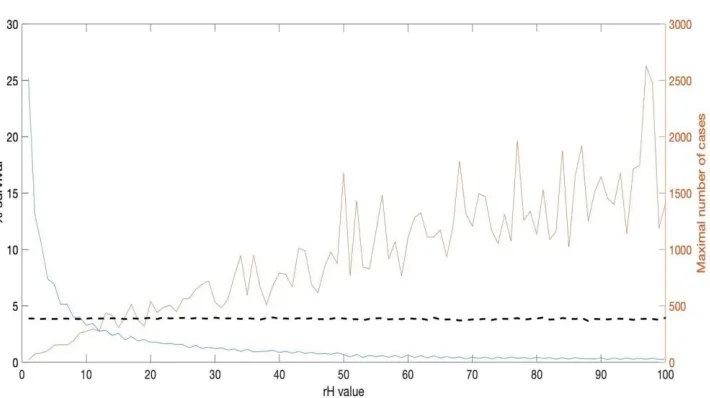
I define the probability that an imported Vx will lead to an increase in case numbers for over > N transmission cycles as P_N, and the probability of an imported case leading to some threshold number of cases as P_outbreak. I estimate the values of the above for rH values ranging from 2 to 100 by simulating 100k ‘seeding events’ per rH value (simulation details described in figure 2).
The proportion of seeding events leading to at least one additional transmission cycle decreases asymptotically with rH (P(1) =~ p_t/rH, blue line in figure 3a), and after the first transmission cycle survival probability at any generation G can be approximated by:
The maximal number of cases caused by a seeding event (IH) increases with rH (red line in figure 3a), and so despite occurring less frequently and lasting fewer generations, the average number of cases caused per seeding event, or the fitness of Vx, is similar for all rH values (dashed black line), as it should be.
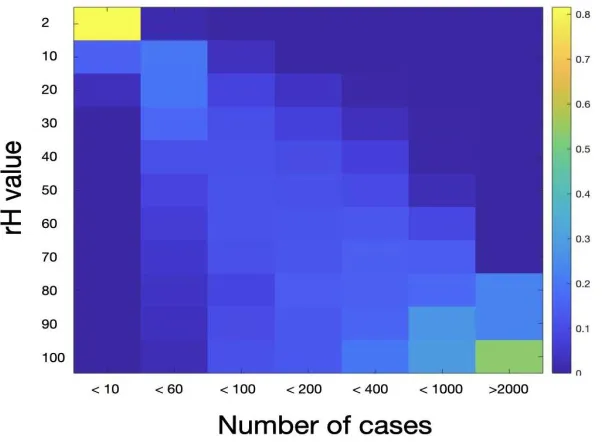
After dividing the number of cases/seeding into bins, starting from under 10 cases, under 100, 200 etc, it is clear the distribution of the number of cases shifts strongly to higher rH values (figure 3b). In fact, although seeding success rate was highest at rH = 2, over 96% of these led to fewer than 10 total infected, < 4% led to 11 to 60, and in no case was the total greater than that. In contrast, in cases where seeding is successful at higher rH values the number of infected is almost always higher than the maximal number observed for rH = 2, as shown in figure 3c.
Superspreader weakness: limited availability of susceptibles
Realistically the number of susceptibles an infected interacts with, denoted here as S_effective, is finite. Even in a crowded hospital, the total number of susceptibles an IH encounters can usually be limited to a number smaller than the higher rH values.
I denote the difference between rH and S_effective deltaS:
deltaS = rH - S_effective,
Using the fitness equation I get:
fitness_new = (1/rH)*p_t*S_effective
Rearranging terms I get the following relationship between the original and new fitness:
fitness_new = (1/rH)*p_t*(rH - deltaS) = fitness*(1 - deltaS/rH), deltaS < rH
The reduced fitness, i.e fewer average number of new cases per IH leads to reduced survival probability:
P’(G) = fitness*P’(G-1) = fitness^(G-1)*pt/rH = P(G)*(S_effective/rH)^(G-1)
Vx to the power of COVID-19
Since the causing agent behind the pneumonia cases in Wuhan was not known initially, samples were sent to the WIV (Wuhan Institute of Virology) for investigation, and COVID-19 was determined to be the probable causing agent (20-22). As a matter of a thought experiment, let us assume this conclusion is not entirely correct, and that some of the patients had a second pathogen present, Vx, which was not identified by the WIV team for any reason.
Normally, in the absence of a known pathogen patients are quarantined based on their
symptoms (figure 5 top), and that is likely what happened in Wuhan until mid-January (23-24). During this time both Vx and COVID-19 kept spreading, each at a different pace: COVID-19 spread in substantial numbers in the community, and Vx still at low rH and causing few new cases among the patients.
After COVID-19 was determined to be the causing agent and test kits became widely available, Wuhan patients were quarantined based on both symptoms and COVID-19 results (25), leading to a massive increase in the number of people put in quarantine facilities. Since at that time it was believed that it was still possible to eliminate the outbreak, Wuhan citizens were put in quarantine even with mild or no symptoms, based entirely on their COVID-19 test results (25). It is possible that such large supplies of COVID-19 patients, susceptible to Vx (figure 5 bottom), essentially guaranteed S_effective was not a limiting factor to the spread of Vx within the quarantine facilities, allowing Vx variants with high rH to infect the maximal number of susceptibles, leading to local outbreaks.
A Vx outbreak in a quarantine facility carries risks beyond increased mortality. First, transferring patients between facilities based on their COVID status carries the risk of introducing Vx into additional facilities and even the community. Second, with a large number of infected patients, there is the danger of Vx developing mutations that allow more efficient human-to-human transmission, and Vx spread beyond only healthcare facilities.
Empirical evidence for a potential Vx in the Wuhan outbreak
There is data to suggest some of the early cases in Wuhan could have been caused by something other than only COVID-19 infection. It was recently pointed out (26) that traces of fluA H7N9, a variant of avian flu, were present in specimens from 3 out of the 5 “original patients” in Wuhan.
Of note, H7N9 infections in humans are described as indistinguishable from the 2003 definition of SARS (27-29), causing fever, hypenia, long-term damage to lung and cardiac tissue in recovered patients, and high mortality rate. Moreover, H7N9 viruses can be antigenically and genetically very different from common fluA strains (e.g H1N1), making them undetectable by standard flu tests and likely to go undiagnosed in hospital settings (30-31).
Discussion
I show that survival probability of superspreader viruses with R0 < 1, referred to here as Vx, is maximal at low rH values, but Vx can cause a large number of cases only at high rH values, and these can be averted. Under normal conditions, medical staff tries to isolate patients with
symptoms of a severe respiratory disease, even if no pathogen is identified. Hence patients with Vx are likely to be separated from the general patient population based on a set of symptoms typical to Vx patients. During the 2003 SARS outbreak for example, detection of the causing agent, SARS-CoV, did not play a role in early quarantine decisions, as the causing agent was unknown at the time (20-21). Patients were quarantined based on their symptoms, and on their recent contacts and travel history.
The danger in quarantining based on symptoms is that several pathogens can initially lead to similar symptoms such as respiratory distress, cough, fever etc. If e.g. Vx causes fever and cough on the first few days, and severe pneumonia and death after 7 days on average, then based only on symptoms patients with ‘regular’ flu-like disease could be put together with Vx patients. These regular patients quarantined with Vx patients can become infected themselves, and worse, the increased availability of susceptibles leads to increased probability of outbreaks, as shown in figure 4.
Hence the combination of increased hospitalizations due to COVID-19, and more critically erroneously grouping large numbers of patients with positive covid-19 test results, and patients with SARS-like undiagnosed Vx infection, could have dramatically increased the probability of additional transmission cycles and higher mortality rates. If authorities in e.g Italy quarantined large numbers of pneumonia patients, even milder cases if they had positive COVID-19 test results (35), they may have helped create the necessary breeding grounds for local Vx
outbreaks, travelling silently alongside COVID-19, and greatly increasing CFR where present.
The model presented here differs from previous models in 2 important ways: 1. It assumes the possibility of a parallel outbreak of an as of yet unverified pathogen, and 2. Model predictions, some of which are outlined in figure 6, may be refuted/verified with already existing data. For example, the results suggest that Vx incidence will be low in most facilities, but high in facilities where patient fatality rate rose sharply for short periods. If no traces of an unusual pathogen, other than COVID-19, can be found in patient specimens from such facilities, then the ‘silent partner’ hypothesis should be dismissed. If on the other hand some pathogen is found at a high frequency in regions with high CFR, but in low frequency when/where CFR was low, then it must be considered as a possibility and an effort must be made to identify potential Vx’s.
References
1 Choisy, Marc, Jean-François Guégan, and P. Rohani. "Mathematical modeling of infectious diseases dynamics." Encyclopedia of infectious diseases: modern methodologies 379 (2007).
2 Ndii, Meksianis Z., and Asep K. Supriatna. "Stochastic mathematical models in epidemiology." Information 20 (2017): 6185-6196.
3 Stone, Lewi, Ronen Olinky, and Amit Huppert. "Seasonal dynamics of recurrent epidemics." Nature 446.7135 (2007): 533-536.
4 Gumel, Abba B., et al. "Modelling strategies for controlling SARS outbreaks." Proceedings of the Royal Society of London. Series B: Biological Sciences 271.1554 (2004): 2223-2232.
5 Almogy, Gal, et al. "Analysis of Influenza and RSV dynamics in the community using a ‘Local Transmission Zone’ approach." Scientific reports 7 (2017): 42012.
6 Wong, Gary, et al. "MERS, SARS, and Ebola: the role of super-spreaders in infectious disease." Cell host & microbe 18.4 (2015): 398-401.
7 McDonald, L. Clifford, et al. "SARS in healthcare facilities, Toronto and Taiwan." Emerging infectious diseases 10.5 (2004): 777.
8 Hsieh, Ying-Hen, Cathy WS Chen, and Sze-Bi Hsu. "SARS outbreak, Taiwan, 2003." Emerging infectious diseases 10.2 (2004): 201.
9 Cho, Sun Young, et al. "MERS-CoV outbreak following a single patient exposure in an emergency room in South Korea: an epidemiological outbreak study." The Lancet 388.10048 (2016): 994-1001.
10 Oboho, Ikwo K., et al. "2014 MERS-CoV outbreak in Jeddah—a link to health care facilities." New England Journal of Medicine 372.9 (2015): 846-854.
11 Ki, Moran. "2015 MERS outbreak in Korea: hospital-to-hospital transmission." Epidemiology and health 37 (2015).
12 Lau, Max SY, et al. "Spatial and temporal dynamics of superspreading events in the 2014– 2015 West Africa Ebola epidemic." Proceedings of the National Academy of Sciences 114.9 (2017): 2337-2342.
14 Lloyd-Smith, James O. "Maximum likelihood estimation of the negative binomial dispersion parameter for highly overdispersed data, with applications to infectious diseases." PloS one 2.2 (2007): e180.
15 Garske, T., and C. J. Rhodes. "The effect of superspreading on epidemic outbreak size distributions." Journal of Theoretical Biology 253.2 (2008): 228-237.
16 Estimating case fatality rates of COVID-19 - Piotr Spychalski, Agata Błażyńska-Spychalska, Jarek Kobiela, The Lancet Infectious Diseases - 2020
17 Zhou, Fei, et al. "Disease severity and clinical outcomes of community-acquired pneumonia caused by non-influenza respiratory viruses in adults: a multicentre prospective registry study from the CAP-China Network." European Respiratory Journal 54.2 (2019): 1802406.
18 Chaudhary, Waqas Ahmed, et al. "Primary Respiratory Bacterial Coinfections in Patients with COVID-19." The American Journal of Tropical Medicine and Hygiene (2020): tpmd200498.
19 Salathé, Marcel, and James H. Jones. "Dynamics and control of diseases in networks with community structure." PLoS Comput Biol 6.4 (2010): e1000736.
20 Wu, Fan, et al. "A new coronavirus associated with human respiratory disease in China." Nature 579.7798 (2020): 265-269.
21 Zhou, Peng, et al. "A pneumonia outbreak associated with a new coronavirus of probable bat origin." nature 579.7798 (2020): 270-273.
22 World Health Organization. (2020). Surveillance case definitions for human infection with novel coronavirus (nCoV): interim guidance v1, January 2020. World Health Organization
23 Tian, Huaiyu, et al. "An investigation of transmission control measures during the first 50 days of the COVID-19 epidemic in China." Science 368.6491 (2020): 638-642.
24 Maier, Benjamin F., and Dirk Brockmann. "Effective containment explains subexponential growth in recent confirmed COVID-19 cases in China." Science 368.6492 (2020): 742-746.
25 Pan, An, et al. "Association of public health interventions with the epidemiology of the COVID-19 outbreak in Wuhan, China." Jama 323.19 (2020): 1915-1923.
26 Abouelkhair, Mohamed. "Non-coronavirus Genome Sequences Identified from Metagenomic Analysis of Clinical Samples from COVID-19 Infected Patients: An Evidence for Co-infection." (2020).
28 Lancet, The. "From SARS to H7N9: will history repeat itself?." Lancet (London, England) 381.9875 (2013): 1333.
29 Chen, Jiajia, et al. "Long term outcomes in survivors of epidemic Influenza A (H7N9) virus infection." Scientific reports 7.1 (2017): 1-8.
30 Wang, Wen-Hung, et al. "Virus-induced pathogenesis, vaccine development, and diagnosis of novel H7N9 avian influenza A virus in humans: a systemic literature review." Journal of International Medical Research 48.1 (2020): 0300060519845488.
31 Cui, Dawei, et al. "Simultaneous detection of influenza A subtypes of H3N2 virus, pandemic (H1N1) 2009 virus and reassortant avian H7N9 virus in humans by multiplex one-step real-time RT-PCR assay." Springerplus 5.1 (2016): 2054.
32 Qi, Xian, et al. "Probable person to person transmission of novel avian influenza A (H7N9) virus in Eastern China, 2013: epidemiological investigation." Bmj 347 (2013).
33 Zhang, Wenyan, et al. "A hospital cluster combined with a family cluster of avian influenza H7N9 infection in Anhui Province, China." Journal of Infection 79.1 (2019): 49-55.
34 Zheng, Shufa, et al. "Factors associated with fatality due to avian influenza A (H7N9) infection in China." Clinical Infectious Diseases 71.1 (2020): 128-132.
Figures
Figure 1
Figure 2
Figure 3a
Figure 3b
Figure 3c
Figure 4
Figure 5
Figure 6
Legend: predicted differences between a single-cause outbreak of a known causing agent (“Only known pathogen”, e.g. only COVID-19) and outbreaks involving a known pathogen and Vx as a silent partner (“known pathogen + Vx”). The number of cases represents the number of patients testing positive for the known pathogen, and since Vx is expected to cause fewer cases, and is unidentified, this number is similar in both cases. The number of deaths on the other hand is expected to be much higher when Vx is involved. E.g for a pathogen that has some case fatality ratio CFR1, the expected number of deaths is N1*CFR1 on the left. If however Vx has a much higher ratio, CFR2 = 100*CFR1, then even small changes in the proportion of Vx cases can significantly affect the observed CFR. Consequently, in the context of a facility treating 1000 flu patients (assuming flu CFR = 0.1%), even 10 cases of a Vx-like virus, like MERS, which has a CFR of almost 50%, would change the observed CFR from 0.1% to 5%. Finally, in outbreaks involving superspreaders in health care settings, like SARS and MERS, a significant proportion of the medical staff/healthcare workers (HCW) were affected. On the other hand, when only a known pathogen is involved HCW’s usually remain healthy.