adfa, p. 1, 2011.
© Springer-Verlag Berlin Heidelberg 2011
Communicating Product User Reviews and Ratings in
Interfaces for e-Commerce: A Multimodal Approach
Dimitrios Rigas and Rajab Ghandour
University of West London, London, W5 5RF,UK
{Dimitrios.Rigas, Rajab.ghandour}@uwl.ac.uk
Abstract. This paper describes a comparative empirical evaluation study that uses multimodal presentations to communicate review messages in an e-com-merce platform. Previous studies demonstrate the effective use of multimodality in different problem domains (e.g. e-learning). In this paper, multimodality and expressive avatars are used to communicate information related to product re-views messages. The data of the rere-views was opportunistically collected from Facebook and Twitter. Two independent groups of users were used to evaluate two different presentations of reviews and ratings using as a basis an experi-mental e-commerce platform. The control group used a text-based with emojis presentation and the experimental group used a multimodal approach based on expressive avatars. Three parameters of usability were measured. These were ef-ficiency, effectiveness, user satisfaction, and user preference. The result showed that the two approaches performed similarly. These findings provide a basis for further experiments in which text, emojis and expressive avatars can be combine to communicate a larger volume of reviews and ratings.
Keywords: Multimodality, Expressive Avatars, e-Commerce, Usability, Social Media, Reviews, Effectiveness, Efficiency, User Satisfaction.
1
Introduction
social media, user reviews, emojis and multimodality. It also describes the exper-imental e-commerce platform developed, the experexper-imental design, results and conclu-sions.
2
E-commerce, Social Media and Multimodality
2.1 E-commerce
E-commerce can be defined as “the use of the Internet and other networking technol-ogies for conducting business transactions” [3]. An organisation is considered to be e-business functioning when most (or a significant proportion) of its e-business is delivered electronically. Exchanging information is often enabled through the use of information technology (IT) [4] and lowers the cost of exchanging information [5, 6]. Generally, e-commerce not just involving selling or buying products online but it extends the busi-ness process such as handling customer online queries, integrating payment from cus-tomers, promotion of product and services. E-commerce is an umbrella concept that integrates a wide range of existing and new applications [7]. The Web increases acces-sibility and defies geographical barriers [8]. This is the reason that firms across the world have implemented e-commerce. With the increasing number of companies avail-able online, it is important to understand some of the utilisation drivers of one platform over another [9].
2.2 Social Media
Web 2.0 enables users to interact and freely share information online [10]. The Oxford English Dictionary [11] defines social media as “websites and applications that enable users to create and share content or to participate in social networking”. The ability to create content online creates an influence of one user over another in social media web-sites such as Facebook and Twitter.
2.3 User Reviews
Social media appears to become the platform users rely on to get reviews. When users are sharing reviews regarding a product or service they are directly influencing the pur-chase decisions of other users. According to [35] consumers evaluate product infor-mation (e.g., product reviews) in order to achieve their consumption goals. Moreover, electronic word-of-mouth (eWOM) is created when users share information and their experiences online [36]. The eWOM is likely to be much more powerful than WOM as it could potentially reach unlimited number of users [37]. It is a powerful product in-formation source [38]. User reviews are usually categorised as positive, neutral or neg-ative. Positive product reviews provide information about satisfactory experiences with the product, and thus represent opportunities to attain positive outcomes [35].
A study focused on tripadvisor.com conducted by Vermeulen and Seegers [39] found that positive hotel reviews improve the perception of future customers. They concluded that exposure to any (positive or negative) hotel reviews increases hotel awareness, especially if the hotel is less known. A similar study conducted by Ye et al [40] suggested that positive hotel reviews result to more bookings. Reviews being shared among other users or groups have different value to other users depending on the content of review and emotional context. For example, consumers that attribute negative emotions to the reviewer's personal dispositions rather than the product, those emotions are unlikely to influence other users [38].
2.4 Multimodality
Several user interfaces communicate reviews using text with some graphics to com-municate product reviews. Although this is considered acceptable to users, it could re-sult in overloading the users with textual information [14, 15]. When presenting con-sulting user reviews and ratings, other non-textual means can be used to aid efficiency, effectiveness and user satisfaction. For example, multimodal interaction for product reviews and ratings may help to browse large volumes of this data easier [16]. Multi-modal applications may use non-speech sound, text and hypertext, animation and video, speech, handwriting, gestures and computer vision.
easier. Another study by Rigas and Memery [21] showed that multimedia helped users to learn more material than using text-and-graphics media and assisted them to perform tasks more successfully. This shows the importance of multimodality.
Multimodal systems have been developed to support functions such as increase sys-tem accessibility for diverse users [22]. Avatar is a computer-based character that has been utilised to virtually represent one party in an interactive context [23] using speech, facial expression or body gestures [34]. Avatars are often used as a tool to support e-learning environments [18]. As multimodality refers to the use of different communi-cation channels, avatars are considered as an additional metaphor to improve the visi-bility and communication aspects of any system. Avatars can be classified into three groups. These are abstract, realistic and naturalistic [24].
3
Experimental Platform
An experimental e-commerce platform was developed to act as basis for this empirical investigation. Two interfaces were designed. These were a text-based with emojis and a multimodal with expressive avatars. Both interface versions communicated the same information relating to the reviews and ratings of products. All the reviews were sourced from Facebook and Twitter. The presentations were designed to deliver the same information about the products being displayed. This information included dif-ferent type of reviews (positive or negative) along with ratings score (1 to 5). The products used in this platform were laptops with different specifications, prices and ratings. Figure 1 shows the conceptual model for this experiment.
Fig. 2. Table 1.The allocation of metaphors to the information communicated
The presented content included three sections the product, product specification and the reviews. The complexity of the reviews communicated increased in every task. Table 1 shows the mapping allocation of the multimodal metaphors to the information com-municated. Customer review comments were communicated using text and the differ-ent ratings using text and multimodal metaphors. Guidelines for multimodal infor-mation presentation [22] were followed for the development of the interfaces. The expressive avatars used in the experiment had facial expressions correlating to the review rating (positive, negative or neutral). These followed established guidelines in the literature [25]. Figure 2 shows the facial expressions used in the expresive avatars.
Fig. 3. Facial expressions used in the expressive avatars
4
Experiment
The experiment measured efficiency, effectiveness and user satisfaction. Each user was presented with different presentations of reviews and ratings using four experimental tasks. The user sample consisted of 24 users that were opportunistically divided into
Experiment Interaction Metaphor
Content
T
ex
t
Gr
ap
h
ics
C
o
lo
u
rs
E
x
p
res
siv
e
Av
atar
Product Description
Price
Customer Reviews
Reviews Ratings
two groups. The independent variable was the method used to communicate reviews and ratings. This variable has two versions. These were the text-based with emojis and an avatar-based design. The experiment consisted of four parts:
1. Pre-experimental questionnaire. 2. Perform tasks.
3. Post-task questions.
4. Post-experimental questions.
4.1 Procedure
For consistency throughout the experiment, the same procedure was applied for the two groups. The experiment started by requesting users to answer a pre-experimental ques-tions that aimed to collect data relating to:
1. General user profile (e.g. age, gender and education).
2. Previous experience with computers, Internet and online shopping. 3. The frequency of use of social media networks.
During the pre-experimental questionnaire, users were presented with a video tutorial for five minutes. The tutorial presented an introduction to the experimental e-commerce platform. Two tutorial videos were used (one for each group of users). The control group was presented with a tutorial demonstrating the interface with the text-based re-views and emojis. The experimental group was presented with the facial expression avatar-based interface. The link between facial-expressions and the ratings of the re-views was also highlighted in the tutorials. Thereafter, the users in both groups per-formed the same tasks (i.e. four tasks) but using the different interface according to the group (i.e. control and experimental). On completion of the experimental tasks, users answered a user satisfaction questionnaire.
4.2 Experimental Proposition and Hypotheses
The experimental proposition is that multi-modal metaphors and facially expressive avatars will provide more effective, efficient and user satisfying presentations of social media based product reviews in an e-commerce platform compared to a textual based with emojis approach. This paper focuses on the effectiveness and efficiency parame-ters of the above proposition. The hypotheses are:
1.Presentations of reviews and ratings using facially expressive avatars will be more effective than text-based with emojis in terms of tasks completed successfully. 2.Presentations of ratings using facially expressive avatars will be more efficient than
the text-based with emojis in terms of users’ products comparisons.
4.3 Tasks
Each group performed the same four tasks but with the corresponding interface. Previ-ous studies showed that the metaphor affect user performance depended on the level [20, 25] and the type of a task being examined [28, 29]. Hence, the tasks were designed to follow the same procedures as previous experiments. The level of difficulty in each task was gradually increased in a way that the first task was the simplest and the fourth task was the most complex. Therefore, the tasks were classified into easy, moderate and difficult. Each task had a set of requirements. Users had to choose the correct product based on criteria based on the reviews. The actual reviews varied from one task to another. For instance, for the Group 1 and task 1, the reviews were simply presented one-by-one (one product review presentation) but for task 2, reviews of prod-ucts were presented together so as the user could compare prodprod-ucts. In the multimodal presentation, as the user proceeded from one task to another, the complexity of the review rating also increased. Therefore, the more difficult the task, the more infor-mation was communicated. The complex tasks contained larger volumes of inforinfor-mation compared to the easy and moderate tasks. On completion of each task, users answered questions based on that task. The aim of these questions was to evaluate the perfor-mance of the user based on the information and the review interface presented by the task.
4.4 Sample
The user sample consisted of 24 users who had no prior exposure to the experimental platform. All users had no prior knowledge on the multimodality metaphors as used in the experiment. They were requested to perform all tasks and answer all questionnaires. These 24 users were opportunistically assigned to two groups (n=12) to evaluate the two conditions (i.e. text-based with emojis and facially expressive avatars). This vol-ume of sample is considered to be sufficient for this usability evaluation [30].
5
Results and Discussion
Fig. 4. Users’ profile in terms of age, gender, and education level in the three groups
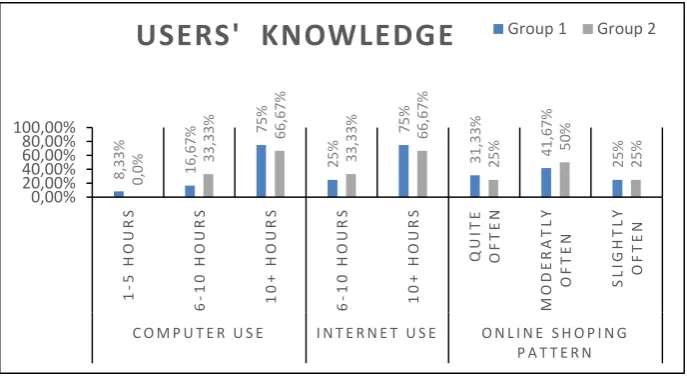
Fig. 5. Users’ knowledge in terms of using computers, Internet and online shopping frequency
5.1 Profile of the Sample
Pre-experimental questionnaires were used to collect the users’ profile information (e.g. gender, age, education or prior experience). Figure 3 presents the profile of the sample. The control group (text-based with emojis) consisted of 58.33% of users aged between 25 and 34, 36.11% between 18 and 24 and 5.56% between 35 and 44. The second group (multimodal) had an age range of 58.33% between 25 and 34, 36.34% between 18 and 24 and 5.33% between 35 and 44. The gender distribution was 25% females and 75% males in the control group and 16.67% females and 83.33% males in the experimental group. The education level of the sample was predominantly undergraduates. Figure
75% 25% 36,11% 58,33% 5,56% 50% 36,11% 13,89% 83,33% 16 ,67% 36,34% 58,33% 5,33% 50% 41,67% 8,33% 0% 20% 40% 60% 80% 100% Male Fe
male 18-24 25-34 35-44
Un d erg rad u ate M as te rs PhD
Gender Age Education Level
Users' Profile
Group 1 Group 28,
33% 16,67%
75% 25% 75% 31, 33% 41, 67% 25% 0, 0% 33, 33% 66, 67% 33, 33% 66,67% 25% 50% 25% 0,00% 20,00% 40,00% 60,00% 80,00% 100,00% 1 -5 H O U R S 6 -1 0 H O U R S 1 0 + H O U R S 6 -1 0 H O U R S 1 0 + H O U R S Q U IT E O F T E N M O D E R A T L Y O F T E N S L IG H T L Y O F T E N
C O M P U T E R U S E I N T E R N E T U S E O N L I N E S H O P I N G P A T T E R N
4 shows the sample’s prior experience relating to the use of computers and the Internet. The data suggests that the sample was knowledgeable and experienced. This was ex-pected given that the sample was drawn from University students.
5.2 Effectiveness
The effectiveness was measured by the frequency of tasks completed successfully by users during the experiment. This measure was considered for all the tasks in total and for task complexity (easy, moderate, and difficult). Users in the experimental group performed marginally better than the users in the control group.
Fig. 6. Percentage of correctly completed tasks achieved by the users in the two groups for all tasks (A) and for task complexity (B).
The total number of correctly completed tasks in the experimental group (facially ex-pressive avatars) was 43 compared to the 37 for the control group (text-based with emojis). The mean value of successfully completed tasks per user for the experimental and control groups was 3.58 and 3.08 respectively. This experimental group demon-strates marginal improvement of successfully completed tasks compared to the control group. The ANOVA test results showed that that the variance was not significant (p at 0.05). The experimental group outperformed the control group in the easy tasks only. The experimental group had 87%, 75% and 66.7% completion rate for easy, moderate and difficult tasks respectively. The control group had 83%, 75% and 67%. Although these results do not show that one method is better than the other in terms of efficiency, there is a prima facie case that in principle the application of expressive avatars does not hinder the effectiveness of users. This results points to the fact that the two ap-proaches can be collaboratively employed to communicate reviews and ratings. The emojis also helped users to quickly browse reviews that in turn accelerated the com-pletion of tasks. Figure 6 shows the total number of successfully completed tasks
77% 83
,3%
75%
67,0%
79,1% 87,5% 75%
66,7%
0% 20% 40% 60% 80% 100%
All Tasks Easy Moderate Complex
All Taskls (A) Task complexity (B)
achieved by each user for both groups. Results show that 4 users successfully com-pleted all tasks in the control group (users 1, 2, 3 and 6) while 3 users in experimental group (users 8, 9 and 12). The mean value of tasks completed successfully per user was 3.08 and 3.17 for the control and experimental groups respectively.
Fig. 7. Total number of successful completed tasks by each user
6
Conclusion and Future Work
The variance between the control and experimental groups was not significantly differ-ent in terms of tasks completed successfully. This indicates that both approaches taken to communicate reviews and ratings are valid. It is important to investigate further un-der different task circumstances. The use of emojis shown to be particular useful. Users obtained an overall viewpoint relating to the review and rating (positive, negative or somewhere in between) at a glance. This makes a strong prima facie case for the use of emojis as additional element of the review and rating entry. There is a need to under-stand the way in which emojis and expressive avatars can be combined to communicate larger volumes of data.
References
1. Nielson, M. Jacob, Taher, 2001. Building Web Sites With Depth. Web Techniques.
2. Meera, M.B., Ephraim, P.G., 1996. Multimodal Integration. IEEE Multimedia 3, 14–24.
3. Turban E., King D., Lee J. and Viehland D., 2004. Electronic Commerce (2004): A
Man-agerial Perspective. Prentice Hall.
4. Skipper, J.B., Craighead, C.W., Byrd, T.A. and Rainer, R.K, 2008. Towards a theoretical
foundation of supply network interdependence and technology-enabled coordination strate-gies. International Journal of Physical Distribution & Logistics Management, Vol. 38, No. 1, pp. 39-56.
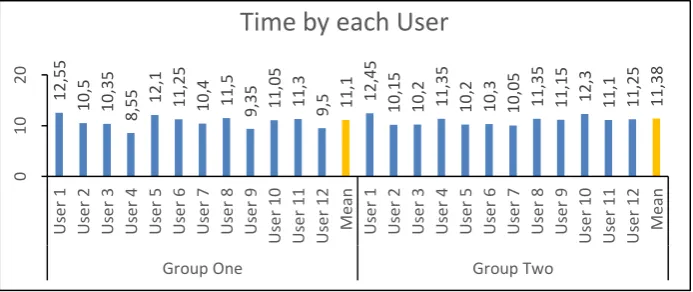
12,55
10
,5
10,35 8,55 12,1 11,25 10,4 11,5 9,35 11,05 11,3 9,5 11,1 12,45 10,15 10,2 11,35 10,2 10,3 10,05 11,35 11,15 12
,3
11,1 11,25 11,38
0 10 20 Us e r 1 U se r 2 Us e r 3 Us e r 4 Us e r 5 Us e r 6 Us e r 7 Us e r 8 Us e r 9 Us e r 10 Us e r 11 Us e r 12 Me an Us e r 1 U se r 2 Us e r 3 Us e r 4 Us e r 5 Us e r 6 Us e r 7 Us e r 8 Us e r 9 U se r 10 Us e r 11 Us e r 12 Me an
Group One Group Two
5. Clemons, M.C. E. K. Reddi S. P. & Row, 1993. The impact of information technology on the organization of economic activity: the move to the middle hypothesis. Journal of Man-agement Information Systems 2, pp. 9–36.
6. Chaffey, D., 2004. E-business-and-e-commerce-management-strategies. Pearson
Ed-ucation Limited, Edinburgh Gate, Harlow, England.
7. Zwass, V., 1996. Electronic commerce: structures and issues. Management Information
Sys-tems, 1, pp. 3–23.
8. Jakob N. and Marie T., 2001. Homepage Usability: 50 Websites Deconstructed. 1st Edition.
New Riders.
9. Deborah E.Rosen, E.P., 2004. Website design: Viewing the web as a cognitive landscape.
Jornal of Business Research 57, pp. 787–794.
10. Scott, S.V., Orlikowski, W.J., 2012. Reconfiguring Relations of Accountability:
Materiali-zation of the Social Media in the Travel Sector. Journal of Accounting, OrganiMateriali-zations and Society, 37, pp. 26–40.
11. Oxford, D., 2014. Oxford English Dictionary - Multimedia. Available from:
http://www.ox-forddictionaries.com/definition/english/social-media?q=social+media
12. Forbes, L.P., 2013. Does Social Media Influence Consumer Buying Behaviour? An
Investi-gation Of Recommendations And Purchases. Journal of Business & Economics Research (JBER) 11, pp. 107–112.
13. L.Gary, B., 2009. Social Media: Influence or control. Accounting Today 23, 38.
14. Brewster, A Stephen and Crease, G Murray, 1997. Making menus musical, in
Human-Com-puter Interaction, INTERACT’97, Springer, pp. 389–396.
15. Brewster, Stephen, Leplâtre Grégory, and Crease Murray, 1998. Using non-speech sounds
in mobile computing devices. Proceedings of the First Workshop on Human Computer In-teraction with Mobile Devices, pp. 26-29.
16. Zeljko O., and Dusan S., 2004. Modelling multimodal human-computer interaction. IEEE
Computer Magazine. Vol 37, pp. 65-72
17. Alseid, M., Rigas, D., 2009. Utilising Multimodal interaction metaphors in e-learning
appli-cations: an experimental study, in: Advanced Information Networking Applications. AINA’09. International Conference. IEEE, pp. 945–950.
18. A.Annetta, L., Holmes, S., 2006. Creating Presence and Community in a Synchronous
Vir-tual Learning Environment Using Avatars. International journal of instructional technology and distance learning 3, pp. 27–43.
19. Rigas, D., Memery, D., 2003. Multimedia e-mail data browsing: the synergistic use of
vari-ous forms of auditory stimuli. Information Technology: Coding and Computing [Computers and Communications]. Proceedings ITCC 2003. International Conference, pp. 582 - 586.
20. Rigas, D., Hopwood, D., 2003. The Role of Multimedia in Interfaces for On-Line Learning.
9th PanHellenic Conference Informatics (PCI’2003).
21. Rigas D., and Memery D., 2002.Utilising audio-visual stimuli in interactive information
sys-tems: a two domain investigation on auditory metaphors. Information Technology: Coding and Computing, 2002. Proceedings. International Conference. IEEE, pp. 190-195.
22. Sarter, Nadine B.,2006. Multimodal information presentation: Design guidance and research
challenges. International journal of industrial ergonomics 36, no. 5, pp. 439–445.
23. Bartneck C., Takahashi T., and Katagiri Y., 2004. Cross Cultural Study of Expressive
Ava-tars. International workshop on Social Intelligence Design.
24. Salem B. and Earle N., 2000. Designing a non-verbal language for expressive avatars.
25. Fabri, M. Moore, J D, and Hobbs J D, 2002. Expressive agents: Non-verbal communication in collaborative virtual environments. Proceedings of Autonomous Agents and Multi-Agent Systems.
26. Rigas D. and Ciuffreda A., 2007. The use of Multi-Modality in Delivering Web Results: An
Empirical Investigation. IADIS International Conference in Computer Graphics and Visu-alisation. Lisbon, Portugal.
27. Rigas D. and Ciuffreda A.,2007. An empirical Investigation of Multimodal Interfaces for
Browsing Internet Search Results. Proceedings of the 7th WSEAS International Conference on Applied Informatics & Communication, pp. 194-199.
28. Rashid S. and Rigas D., 2008.A two-group evaluation to e-note. International Journal of
Education and Information Technologies, NAUN, vol. 2, pp. 7-11, 2008.
29. Alotaibi M. and Rigas D.,2008. A Usability Evaluation of Multimodal Metaphors for
Cus-tomer Knowledge Management. International Journal of Computers and Communications, university press, UK, vol. 2, pp. 59-68.
30. Jakob Nielsen, 1993. Usability Engineering. Edition. Academic Press Inc.
31. Aborokbah, Majed. 2014. Multimodal ecommerce: usability and social presence. PhD
the-sis, De Montfort University Faculty of Technology.
32. Kranzler, J. H., 2003. Frequency Distributions, Statistics For The Terrified. 3rd edition,
Prentice Hall, pp. 36-37.
33. Field, A. P, 2013. Exploring data, Discovering statistics using SPSS. 4th edition, SAGE
Publications, pp. 65-109.
34. Beskow, J., 1997.Animation of Talking Agents, Proceedings of AVSP'97, ESCA Workshop
on Audio-Visual Speech Processing. Rhodes, Greece.
35. Duan, W., Gu, B. and Whinston, A.B., 2008. Do online reviews matter?—An empirical
in-vestigation of panel data. Decision support systems, 45(4), pp.1007-1016.
36. Cox C., Burgess S., Sellitto C. and Buultjens J., 2009. The role of user-generated-content in
tourists’ travel planning behaviour. Journal of hospitality marketing and management, vol. 18, pp. 743-764.
37. Ghandour, R and Bakalova ,R.,2014. Social media influence on the holiday decision-making
process in the UK. Journal of Organisational Studies and Innovation, vol 1, pp 41—54.
38. Junyong, K and Pranjal, G,.2012. Emotional expressions in online user reviews: How they
influence consumers' product evaluations. Journal of Business Research, vol 65, pp. 985-992.
39. Vermeulen I., Seegers D.,2009. Tried and tested: The impact of online hotel reviews on
consumer consideration, Journal of Tourism Management, Vol. 30, pp 123-127.
40. Ye Q., Law R., Gu B., Chen W., 2011. The influence of user-generated content on traveller
behaviour: An empirical investigation of the effects of e-word of-mouth to hotel online bookings. Computers in Human Behaviour Journal, Vol. 2, pp. 634-639.