Data Descriptor
Taguchi Orthogonal Array Dataset for the Effect of
Water Chemistry on Aggregation of ZnO
Nanoparticles
Rizwan Khan, Muhammad Ali Inam, Du Ri Park, Saba Zam Zam and Ick Tae Yeom *
Graduate School of Water Resources, Sungkyunkwan University (SKKU) 2066, Suwon 16419, Korea; [email protected] (R.K.); [email protected] (M.A.I.); [email protected] (D.R.P.);
[email protected] (S.Z.Z.)
* Correspondence: [email protected]; Tel.: +82-31-299-6699
Abstract: The dynamic nature of engineered nanoparticle (ENP) aggregation behavior and kinetics are of paramount importance in the field of toxicological and environmental nanotechnology. The Taguchi orthogonal array (OA) L27(313) matrix based on a fractional factorials design was applied to
systematically evaluate the contribution and significance of water chemistry parameters (pH, temperature, electrolyte, natural organic matter (NOM), content and type) and their interactions in the aggregation behavior of zinc oxide nanoparticles (ZnO NPs). The NPs were dispersed into the solution using a probe-sonicator cell crusher (Bio-safer, 1200-90, Nanjing, China). The data were obtained from UV–Vis spectroscopy (Optizen 2120 UV, Mecasys, Daejeon, Korea), Fourier Transform Infrared Spectrometery (FT-IR 4700, spectroscopy, a JASCO Analytical Instruments, Easton, Pennsylvania, USA) and particle electrophoresis (NanoZS, Zetasizer, Malvern Instruments Ltd., Worcestershire, UK). The dataset revealed that Taguchi OA matrix is an efficient approach to study the main and interactive effects of environmental parameters on the aggregation of ZnO NPs. In addition, the aggregation profile of ZnO NPs was significantly influenced by divalent cations and NOM. The result of the FT–IR data presents a possible mechanism of ZnO NP stabilization in the presence of different NOM. This data may be helpful to predict the aggregation behavior of ZnO NPs in environmental and ecotoxicological contexts.
Dataset: Available as the supplementary file.
Dataset License: CC-BY
Keywords: aggregation; Fourier transform infrared spectrometer; Taguchi orthogonal array; UV-Vis spectrophotometer; water chemistry; zinc oxide nanoparticles
1. Summary
With the development of nanotechnology, production, and utilization of engineered nanoparticles (ENPs) has increased in consumer products and commercial applications. Among the diverse ENPs, zinc oxide nanoparticles (ZnO NPs) are the third most frequently used metal-containing nanomaterials due to their unique structural properties [1]. The estimated annual global production is currently between 570–33,400 t/year, and is anticipated to reach 58,000 t/year by 2020 [2]. However, such broad applications and production of ZnO NPs have generated concern to both the scientific and public communities due to their environmental release, which may increase the bioavailability and NPs’ toxicity in an aqueous environment [3]. The potential adverse effects of ZnO NPs on phytoplankton, plants, and even human cell lines are well-known [4]. However, limited knowledge is available regarding the nanoparticle–liquid interaction and aggregation among NPs. Thus, understanding the aggregation phenomena of ZnO NPs under various parameters of water chemistry is important to properly assess their risk.
Several researchers have studied the ZnO NP fate and mobility in an aqueous environment [5– 7]. ZnO NP aggregation phenomena are highly influenced by physicochemical properties and solution chemistry [8]. NP properties such as size, shape, and coating may cause substantial variation in their aggregation kinetics [9]. Few studies [10,11] have reported that large size particles tend to aggregate, however, tiny size particles remain suspended in solution and increase the risk of harm to aquatic species. The variation in solution pH and temperature affect the surface potential and solubility of ZnO NPs which may also influence their agglomeration phenomena [7,12]. Fast aggregation has been reported in high-salt content solutions due to compression of the electrical double layer (EDL) [9,13]. The studies also showed that ubiquitous natural organic matter (NOM) stabilizers kept ZnO NPs suspended in water due to steric hindrance and potential charge reversal [14,15]. Furthermore, few studies have demonstrated that the presence of divalent cations i.e., Ca2+,
Mg2+ may form intermolecular bridging between NOM and ZnO NPs, to promote aggregation [16].
Additionally, the presence of trivalent electrolytes such as aluminum sulfate (Al2(SO4)3) with the strong potential to form a bridge between metal NPs and aggregates, may enhance the hetero-aggregation due to the formation of aluminum complexes [17,18]. These results further suggest that different electrolytes play a significant role in the aggregation of ENPs in aqueous matrices.
In previous studies [19–22], the influence of various environmental parameters on agglomeration phenomena of ZnO NPs has generally been studied using individual factors and has been limited to pure water. Additionally, the interaction of multiple parameters affecting this phenomenon has been rarely investigated by environmental scholars. Therefore, it is important to evaluate the aggregation phenomena of ZnO NPs together with a combination of different parameters that may affect their function and toxicity in an ecosystem.
A recent study has shown a significant influence of several environmental parameters on sedimentation and aggregation of ZnO NPs [23]. Numerous datasets on such phenomena of other ENPs i.e., copper oxide (CuO) and titanium dioxide (TiO2) have been reported [22,24]. However, to
the knowledge of the authors, there are no datasets available regarding the effect of combined multiple environmental parameters on ZnO NP aggregation. In light of this, ZnO NP aggregation phenomena in single and multiple environmental parameters were investigated. The fractional factorial method based on Taguchi orthogonal array (OA) L27 (313) design matrix was used to measure
the main and interactive effects of multiple factors. This study quantitatively presents a ZnO NPs aggregation dataset obtained from UV–Vis spectrophotometry, Fourier transform infrared spectrometry (FT–IR), zeta potential analysis and Optizen view 4.2.5 PC interference software.
The dataset obtained from the UV/Vis spectrophotometer presents the absorbance data of ZnO NPs at various environmental conditions such as pH, electrolyte type and concentration, and NOM type and concentration. Earlier, the zeta potential and FT–IR spectra of ZnO–NOM complexes were elucidated under different aqueous matrices [23]. This data may contribute to a better understanding of the agglomeration phenomena and fate of ZnO NPs in complex heterogeneous environments.
2. Data Description
interfering ions on the aggregation phenomena of ZnO NPs in an aqueous environment. Table S7 shows the time-resolved optical absorbance measured at 370 nm across various solution matrices. The aggregation rate k can be estimated from this data using Stokes sedimentation theory; it also indicates that aggregation kinetics may vary substantially in the presence of high electrolyte and NOM concentrations. Table S8 shows the data derived from FT/IR spectra of pristine ZnO NPs before and after interaction with high concentration of various NOM i.e., humic acid, salicylic acid and citric acid. It shows the percent transmittance against the wave numbers (500–4000 cm−1). This data is
helpful in providing the information about modification in the surface of ZnO NPs after interaction with NOM.
Table 1. Type of experiment and condition of single parameter experiments.
Experiment Parameter Unit Condition
A pH - 3 to 12
B KCl, Na2SO4 mM 0.01 to 100 MgCl2 mM 0.01 to 25 C HA, SA, CA mg∙L−1 0.5 to 100
D Synthetic Environmental water samples
Where HA, SA and CA corresponds to humic acid, salicylic acid and citric acid respectively.
Table 2. The input parameter and their corresponding levels for the Taguchi L27 (313) experiment.
Parameter Units Level
1 2 3
pH - 7.0 8.0 9.5
Electrolyte Concentration mM 25 50 100 NOM Concentration * mgL−1 5 10 25
Electrolyte type - KCl Na2SO4 MgCl2
NOM type - HA SA CA
Temperature °C 15 25 35
* NOM corresponds to natural organic matter.
Furthermore, Tables S9–S11 show the data of residual absorbance and corresponding aggregation efficiencies, variance and range analysis obtained from Taguchi OA L27 (313) matrix for
multi-parameters experiments. This data is important to determine the analysis of variance (ANOVA) and, consequently, the dominant parameters influencing the ZnO NPs aggregation in a real environment. In addition, the data in Tables S12 and S13 shows the residual absorbance and aggregation efficiencies obtained across various environmentally tested waters. This data is helpful in providing ZnO NPs aggregation phenomena in real environmental conditions.
3. Methods
3.1. Solution and Synthetic Waters Preparation
The nanopowder of ZnO NPs assay 97%; humic acid sodium salt (HA), salicylic acid (SA) and citric acid (CA) were purchased from the Sigma-Aldrich (St. Louis, MO, USA) and used without further purification. While inorganic salts i.e., potassium chloride (KCl), sodium sulfate (Na2SO4),
magnesium chloride (MgCl2.6H2O), nitric acid (HNO3), hydrochloric acid (HCl), sodium hydroxide
(NaOH) used in this study were obtained from local suppliers. According to the vendor, NPs have particle size <50 nm with a specific surface area 15–25 m2/g and it contain 6% Al as dopant. The 100
rpm for overnight to improve further stability [25]. All the stock solutions’ pH values were adjusted to 7 prior to storage in the dark at 4 °C. The stock solutions of inorganic salts with 0.1 M ionic strength (IS) were prepared by adding 7.45 g KCl, 14.2 g Na2SO4 and 20.32 g MgCl2.6H2O in 1 L solution
respectively. Four synthetic waters were prepared in the laboratory, while tap water and wastewater were collected from Sungkyunkwan University, Suwon and metal processing industry located at Ulsan, Korea respectively. The detailed characteristics of all water samples are already presented in our previous study [23]. The IS (Ie) was calculated from the electrical conductively (EC) [26] according to the following equation.
𝐼𝑒 = 0.01442 × 𝐸𝐶1.009 (1)
3.2. Standard Calibration Curve Analysis
Prior to the aggregation experiments, optical absorption analysis was conducted using a UV/Vis spectrophotometer (Optizen 2120 UV, Mecasys, Daejeon, Korea) using a 100 mm path length quartz cuvette. The device was equipped with high-quality Tungsten–Halogen lamp and a Deuterium lamp which allows the analysis of ZnO NPs at relatively low concentrations (100 to 1000 µg/L). The absorption spectra of the colloids were collected between 200–800 nm at 25 °C. The background was set up with the proper solvent and then, each colloid sample was examined. Since UV–Vis spectra fit well to Beer–Lamber law; thus, a standard calibration curve was collected at 370 nm and used as a quantitative criterion of ZnO NPs.
3.3. Aggregation Efficiency of Nanoparticles
The ZnO NPs concentration and aggregation efficiencies were estimated using fitted curve equation having R2 of 0.9993 as shown in Equations (2) and (3). In current study, initial concentration
of ZnO NPs in vial was maintained at 100 mg/L.
𝑌 = 0.0086𝑥 − 0.0116 (2)
where Y represents the concentration of ZnO NPs and x indicates residual absorbance [24].
𝐴 = 𝐶𝑖 − 𝐶𝑡
𝐶𝑖 × 100 (3)
where A corresponds to aggregation efficiency, Ci and Ct are concentration of ZnO NPs before and after aggregation experiments.
3.4. Aggregation and Sedimentation Experiments
ln 𝐶𝑡 = ln 𝐶𝑖 − 𝑘𝑡 (4)
where t represents the time; Ci and Ct are ZnO NPs concentrations at initial and t time points,
respectively; and k is the sedimentation rate constant in (h−1). Moreover, the settling velocity Vt of
NPs under controlled conditions i.e., pH 7, 100 mg/L ZnO NPs having primary particle size 50 nm and density 5.60 g/cm3 at various temperature levels (15–35 °C) were calculated using Stoke’s law
equation (Table 3).
𝑉𝑡= 𝑔𝑑2(𝜌
𝜌−𝜌𝑚)
18𝜇 (5)
where g represents acceleration of gravity (m/s2), d particle diameter (m), 𝜌
𝜌 density of particle
(g/cm3), 𝜌
𝑚 density of medium (g/cm3), 𝜇 viscosity of medium (g/m·s) and Vt settling velocity of
particles respectively.
Table 3. Calculated Vt of ZnO NPs at various water temperature under controlled conditions.
Temperature (°C) 15 25 35 Vt (× 10−3 cm/hour) 1.978 2.533 3.105
3.5. Sample Preparation for FTIR Measurement
The Fourier transform infrared spectra (FT/IR-4700, spectroscopy, JASCO Analytical Instruments, Easton, Pennsylvania, USA) of ZnO NPs before and after interaction with various NOM were recorded. Spectroscopy has been used as a useful tool for the identification of structures and functional groups. The extracted aliquots of ZnO NOM complexes after aggregation experiment were collected and NPs were separated by centrifugation (Hettich Centrifuger Universal 320R, Tuttlingen, Germany) at 3000 RPM for 15 min. The resultant ZnO NP pellets were subjected to vacuum drying for 24 h to remove any moisture content. The high sensitive Mercury–Cadmium–Telluride (MCT) focal-plane array detector was cooled for 30 min with liquid nitrogen (LIN). The dried samples were inserted into the sample platform to characterize the attachment of functional groups in the range of wave number 500–4000 cm−1. The Thermo Scientific OMNIC FTIR software was used to analyze the
data and exported in the text file format for further processing.
3.6. Zeta Potential Analysis
After the aggregation experiments, an aliquot was removed from the suspension and placed into the zeta potential cell. The cell was filled up with the colloids avoiding the formation of bubbles. The electrophoretic mobility of the particles was measured using a Zetasizer Nano-ZS (Malvern Instrument Ltd., Worcestershire, UK). The temperature in the Zetasizer was set to 25 ± 0.1 °C. Three electrophoretic mobility measurements were made for each sample. The value of electrophoretic mobility was directly converted by default function of equipment. The default Smoluchowski equation is given [28] below.
ζ = 4πη (v
E)/ε (6)
where ζ represents zeta potential (mV),(𝑉
𝐸) electrophoretic mobility (microns/sec × volt/cm), η
solvent viscosity (poise) and ε is dielectric constant.
3.7. Characterization of Water Samples
The aliquot obtained from tap and industrial wastewater were filtered through a 0.45-µm glass fiber filter; digested with 99% pure HNO3 prior to analysis [29]. The Inductively coupled plasma mass spectrometry (ICP-MS, 7700x, Agilent Technologies, Palo Alto, CA, USA) was used to analyze the concentration of common element i.e., potassium (K+), sodium (Na+), copper (Cu+2), iron (Fe),
magnesium (Mg+2), arsenic (As), calcium (Ca+2) and antimony (Sb). The industrial wastewater filtered
and SO4−2) using ion chromatography with metrosep A Supp5 column in (861 Advanced Compact IC,
Metrohm, Herisau, Switzerland).
3.8. Taguchi Orthogonal Array Experimental Design
In recent years, many design of experiments (DOE) including full factorial and fractional factorial design have been developed and widely used in many engineering fields to optimize and design experiments [30–32]. A full factorial design may become onerous to be completed with the increase of number of parameters. Therefore, the concept of Taguchi orthogonal array (OA) based on fractional factorial design was developed by Dr. Genichi Taguchi to study a large number of variables with a small number of experimental trials [33]. Using the OA approach significantly reduce the number of experimental configurations to be studied and provides the main and interactive effects. The parameters and levels are selected according to the experimental design. The term parameters correspond to the number of experimental variables while the term levels show the number of different values a variable can assume according to its discretization.
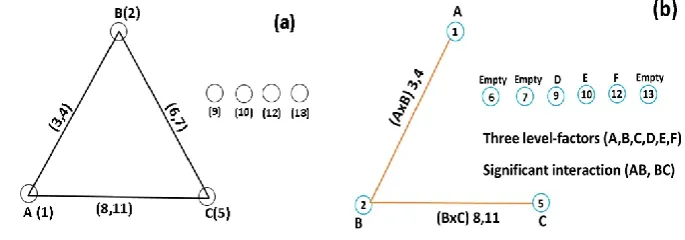
In the current study, the variation of all input parameters was systematically studied at three levels as shown in Table 2. We applied the standard OA L27(313) (Figure 1a) of Taguchi method using
various parameters of water chemistry to investigate ZnO NP aggregation behavior. The standard OA was modified (Figure 1b) using a line separation method to assign the parameters and interactions to various columns. The ZnO NPs aggregation phenomena were evaluated under the control of six parameters i.e., pH (A), electrolyte concentration (B), NOM concentration (C), electrolyte type (D), NOM type (E) and temperature (F) with three levels and two potential interactions i.e., A × B and B × C. The OA L27(313) which has 27 rows corresponds to a number of trials
with 13 columns at 3 levels as shown in Table S9. The plan of the experiment was as follows. The pH (A) was assigned in the first column, electrolyte concentration (B) in the second column, NOM concentration (C) in the fifth column, electrolyte type (D) in ninth column, NOM type (E) in tenth column and temperature (F) in the twelfth column. The possible two parameter interactions (A × B)1
and (A × B)2 were assigned to third and fourth columns while eighth and eleventh were assigned to
(B × C)1 and (B × C)2 interactions. The remaining sixth, seventh and thirteenth columns were left
empty in order to calibrate the standard matrix. The experiments were conducted for each combination of parameters as per selected OA in triplicate and average values were reported.
Figure 1. Standard linear graph for L27 (313) array (a); and modified linear graph for column assignment (b).
3.9. Statistical Analysis
3.10. Optizen View 4.2.5
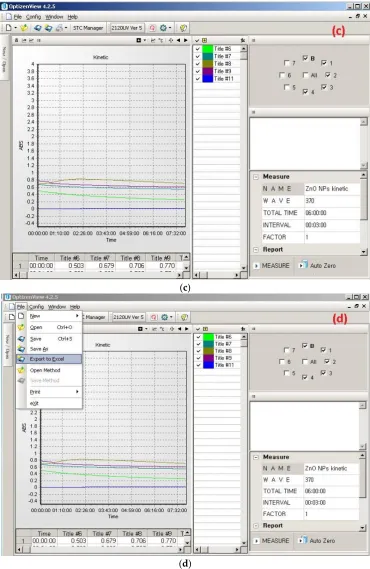
A UV–Vis spectrophotometer was connected with a PC interference software “Optizen view 4.2.5” to obtain the absorbance and real-time kinetics data of ZnO NPs in solution. The method adopted for obtaining sample survey scans and kinetic data is illustrated in Figure 2a–d.
(a)
(c)
(d)
Figure 2. An illustration of Optizen view 4.2.5 software showing (a) main screen of user interference; (b) survey scan for determination of ZnO NPs wavelength; (c) time-resolved kinetic study of ZnO NPs under various solution chemistry; (d) procedure to export data to Excel.
4. User Note
of a global scale, one may use the dataset to incorporate more information of water chemistry parameters present in the local environments to assess other parameters that were not covered in the current matrix data.
Supplementary Materials: The following are available online at www.mdpi.com/xxx/s1. Table S1: Survey scan of ZnO NPs suspension in nanopure water, Table S2: Standard linear Curve of ZnO NPs at 365 nm, Table S3: Turbidity of the solution at various time and power levels of sonicator, Table S4: Absorbance and zeta potential of ZnO NPs at various pH range, Table S5: Absorbance of ZnO NPs at different electrolyte concentration of KCl, Na2SO4 and MgCl2, Table S6: Absorbance and corresponding zeta potential of ZnO NPs at various NOM concentrations of humic, salicyclic and citric acid respectively, Table S7: Normalized absorbance of ZnO NPs at various experimental conditions, Table S8: FT-IR spectra of ZnO NPs before and after interaction with 100 mg/L concentration of various NOM, Table S9: Column assignment for various parameters and two interactions in Taguchi L27 (313) orthogonal array and experimental absorbance, Table S10: The detail of the range analysis, Table S11: The detail result of the variance analysis, Table S12: Aggregation kinetic of Environmental Water samples, Table S13: Characterization of various environmental water samples and corresponding residual absorbance.
Author Contributions: R.K. and I.T.Y. conceived and designed the study. R.K. and M.A.I. conducted the experiment. S.Z.Z. and D.R.P. were responsible for experimental setup arrangements. R.K. and M.A.I. analyzed and revised the dataset. R.K. led the writing of the manuscript.
Funding: This research received no external funding.
Conflicts of Interest: The authors declare no conflict of interest.
References
1. Keller, A.A.; McFerran, S.; Lazareva, A.; Suh, S. Global life cycle releases of engineered nanomaterials. J. Nanopart. Res. 2013, 15, doi:10.1007/s11051-013-1692-4.
2. Handy, R.D.; Von Der Kammer, F.; Lead, J.R.; Hassellöv, M.; Owen, R.; Crane, M. The ecotoxicology and chemistry of manufactured nanoparticles. Ecotoxicology 2008, 17, 287–314, doi:10.1007/s10646-008-0199-8. 3. Xia, T.; Kovochich, M.; Liong, M.; Mädler, L.; Gilbert, B.; Shi, H.; Yeh, J.I.; Zink, J.I.; Nel, A.E. Comparison
of the Mechanism of toxicity of Zinc and Cerium Oxide Nanoparticles Based on Dissolution and Oxidative Stress Properties. Am. Chem. Soc. Nano 2008, 2, 2121–2134, doi:10.1021/nn800511k.
4. Brunner, T.J.; Wick, P.; Manser, P.; Spohn, P.; Grass, R.N.; Limbach, L.K.; Bruinink, A.; Stark, W.J. In vitro cytotoxicity of oxide nanoparticles: Comparison to asbestos, silica, and the effect of particle solubility. Environ. Sci. Technol. 2006, 40, 4374–4381, doi:10.1021/es052069i.
5. Majedi, S.M.; Kelly, B.C.; Lee, H.K. Combined effects of water temperature and chemistry on the environmental fate and behavior of nanosized zinc oxide. Sci. Total Environ. 2014, 496, 585–593, doi:10.1016/j.scitotenv.2014.07.082.
6. Baalousha, M. Aggregation and disaggregation of iron oxide nanoparticles: Influence of particle concentration, pH and natural organic matter. Sci. Total Environ. 2009, 407, 2093–2101, doi:10.1016/j.scitotenv.2008.11.022.
7. Zhang, Y.; Chen, Y.; Westerhoff, P.; Hristovski, K.; Crittenden, J.C. Stability of commercial metal oxide nanoparticles in water. Water Res. 2008, 42, 2204–2212, doi:10.1016/j.watres.2007.11.036.
8. Degen, A.; Kosec, M. Effect of pH and impurities on the surface charge of zinc oxide in aqueous solution. J. Eur. Ceram. Soc. 2000, 20, 667–673.
9. Zhou, D.; Keller, A.A. Role of morphology in the aggregation kinetics of ZnO nanoparticles. Water Res. 2010, 44, 2948–2956, doi:10.1016/j.watres.2010.02.025.
10. Mudunkotuwa, I.A.; Rupasinghe, T.; Wu, C.-M.; Grassian, V.H. Dissolution of ZnO Nanoparticles at Circumneutral pH: A Study of Size Effects in the Presence and Absence of Citric Acid. Langmuir 2012, 28, 396–403, doi:10.1021/la203542x.
11. Liu, W.S.; Peng, Y.H.; Shiung, C.E.; Shih, Y.H. The effect of cations on the aggregation of commercial ZnO nanoparticle suspension. J. Nanopart. Res. 2012, 14, doi:10.1007/s11051-012-1259-9.
13. Van Hoecke, K.; De Schamphelaere, K.A.C.; Van Der Meeren, P.; Smagghe, G.; Janssen, C.R. Aggregation and ecotoxicity of CeO2 nanoparticles in synthetic and natural waters with variable pH, organic matter concentration and ionic strength. Environ. Pollut. 2011, 159, 970–976, doi:10.1016/j.envpol.2010.12.010. 14. Philippe, A.; Schaumann, G.E. Interactions of dissolved organic matter with natural and engineered
inorganic colloids: A review. Environ. Sci. Technol. 2014, 48, 8946–8962, doi:10.1021/es502342r.
15. Zhu, M.; Wang, H.; Keller, A.A.; Wang, T.; Li, F. The effect of humic acid on the aggregation of titanium dioxide nanoparticles under different pH and ionic strengths. Sci. Total Environ. 2014, 487, 375–380, doi:10.1016/j.scitotenv.2014.04.036.
16. Keller, A.A.; Wang, H.; Zhou, D.; Lenihan, H.S.; Cherr, G.; Cardinale, B.J.; Miller, R.; Zhaoxia, J.I. Stability and aggregation of metal oxide nanoparticles in natural aqueous matrices. Environ. Sci. Technol. 2010, 44, 1962–1967, doi:10.1021/es902987d.
17. Zhang, J.; Dong, Q.; Liu, Y.; Zhou, X.; Shi, H. Response to shock load of engineered nanoparticles in an activated sludge treatment system: Insight into microbial community succession. Chemosphere 2016, 144, 1837–1844, doi:10.1016/j.chemosphere.2015.10.084.
18. Zhou, X.; Huang, B.-C.; Zhou, T.; Liu, Y.C.; Shi, H. Aggregation behavior of engineered nanoparticles and their impact on activated sludge in wastewater treatment. Chemosphere 2015, 119, 568–576, doi:10.1016/j.chemosphere.2014.07.037.
19. Li, X.; Lenhart, J.J.; Walker, H.W. Aggregation kinetics and dissolution of coated silver nanoparticles. Langmuir 2012, 28, 1095–1104, doi:10.1021/la202328n.
20. Zhang, Y.; Chen, Y.; Westerhoff, P.; Crittenden, J. Impact of natural organic matter and divalent cations on the stability of aqueous nanoparticles. Water Res. 2009, 43, 4249–4257, doi:10.1016/j.watres.2009.06.005. 21. Peng, Y.H.; Tsai, Y.C.; Hsiung, C.E.; Lin, Y.H.; hsin Shih, Y. Influence of water chemistry on the
environmental behaviors of commercial ZnO nanoparticles in various water and wastewater samples. J. Hazard. Mater. 2017, 322, 348–356, doi:10.1016/j.jhazmat.2016.10.003.
22. Peng, C.; Shen, C.; Zheng, S.; Yang, W.; Hu, H.; Liu, J.; Shi, J. Transformation of CuO Nanoparticles in the Aquatic Environment: Influence of pH, Electrolytes and Natural Organic Matter. Nanomaterials2017, 7, doi:10.3390/nano7100326.
23. Khan, R.; Inam, M.A.; Zam, S.Z.; Park, D.R.; Yeom, I.T. Assessment of Key Environmental Factors Influencing the Sedimentation and Aggregation Behavior of Zinc Oxide Nanoparticles in Aquatic Environment. Water 2018, 10, doi:10.3390/w10050660.
24. He, G.; Chen, R.; Lu, S.; Jiang, C.; Liu, H.; Wang, C.; He, G.; Chen, R.; Lu, S.; Jiang, C.; et al. Dominating Role of Ionic Strength in the Sedimentation of Nano-TiO2 in Aquatic Environments. J. Nanomater.2015, 2015, 1–10, doi:10.1155/2015/851928.
25. Dong, Y.; Li, X.; Huang, Y.; Wang, H.; Li, F. Coagulation and dissolution of zinc oxide nanoparticles in the presence of humic acid under different pH values. Environ. Eng. Sci. 2016, 33, 347–353.
26. Marion, G.M.; Babcock, K.L. Predicting specific conductance and salt concentration in dilute aqueous solutions. Soil Sci. 1976, 122, 181–187.
27. Kato, H.; Fujita, K.; Horie, M.; Suzuki, M.; Nakamura, A.; Endoh, S.; Yoshida, Y.; Iwahashi, H.; Takahashi, K.; Kinugasa, S. Dispersion characteristics of various metal oxide secondary nanoparticles in culture medium for in vitro toxicology assessment. Toxicol. Vitr. 2010, 24, 1009–1018.
28. Smoluchowski, M. Handbuch der Elektrizitat und Magnetisums 1914; Graetz, L. Ed.; Barth-Verlag: Leipzig, Germany, 1921.
29. Fang, L.; Xiao, X.; Kang, R.; Ren, Z.; Yu, H.; Pavlostathis, S.G.; Luo, J.; Luo, X. Highly Selective Adsorption of Antimonite by Novel Imprinted Polymer with Microdomain Confinement Effect. J. Chem. Eng. Data 2018, 63, 1513–1523, doi:10.1021/acs.jced.7b01074.
30. Phadke, M.S. Quality Engineering Using Robust Design; Prentice Hall: Upper Saddle River, NJ, USA, 1989; ISBN 0137451679.
31. Lan, W.G.; Wongt, M.K.; Chen, N.; Sin, Y.M. Orthogonal array design as a chemometric method for the optimization of analytical procedures. Part 5. Three-level design and its application in microwave dissolution of biological samples. Analyst 1995, 120, 1115–1124.