T E C H N I C A L A D V A N C E
Open Access
The cloud paradigm applied to e-Health
Jordi Vilaplana
1, Francesc Solsona
1, Francesc Abella
2, Rosa Filgueira
3and Josep Rius
4*Abstract
Background: Cloud computing is a new paradigm that is changing how enterprises, institutions and people understand, perceive and use current software systems. With this paradigm, the organizations have no need to maintain their own servers, nor host their own software. Instead, everything is moved to the cloud and provided on demand, saving energy, physical space and technical staff. Cloud-based system architectures provide many advantages in terms of scalability, maintainability and massive data processing.
Methods: We present the design of an e-health cloud system, modelled by an M/M/m queue with QoS capabilities, i.e. maximum waiting time of requests.
Results: Detailed results for the model formed by a Jackson network of two M/M/m queues from the queueing theory perspective are presented. These results show a significant performance improvement when the number of servers increases.
Conclusions: Platform scalability becomes a critical issue since we aim to provide the system with high Quality of Service (QoS). In this paper we define an architecture capable of adapting itself to different diseases and growing numbers of patients. This platform could be applied to the medical field to greatly enhance the results of those therapies that have an important psychological component, such as addictions and chronic diseases.
Keywords: Cloud systems, e-Health, Queue systems, Quality of service
Background
A recent study [1] showed as personalized follow-up by using of telematic tracking applications by means of SMS messaging improved the results in the quitting smokers patients. Related experiments also proved that the same method is useful for application related with the treatment of hypertensive patients [2] and in patients with chronic diseases in general [3]. By using telematic applications, the time dedicated to personalized clinical attention to patients increase, and clinicians more effectively sched-uled and managed that time. Also avoids unnecessary travel by patients, while allowing them to feel closely followed by the clinician. This is just one example of the benefits that can bring telematic applications, whose implementation in health centres is increasing.
This article presents the design of a cloud platform with QoS guarantees (based on waiting time for services) applied to e-Health. It is thought to include a wide range
*Correspondence: [email protected]
4ICG Software, Pol. Industrial Torrefarrera C. Mestral, s/n 25123 Torrefarrera, Lleida, Spain
Full list of author information is available at the end of the article
of telematic as well as usual programs (administration, specialised, general purpose, etc.). Cloud computing can offer many opportunities to improve health care services from the viewpoint of management, technology, security and legality [4]. By moving the infrastructure to the cloud, valuable data extracted from the different databases of treatment, patients, diseases, and so on will be accessible to doctors to perform analytical studies and see statisti-cal results. By hiding personal patient details, data could be shared between doctors and even hospitals, and could also be cross-reference information from different dis-eases and treatments. In [5], the authors examine how the biomedical informatics community, especially consor-tia that share data and applications, can take advantage of cloud computing. Cloud computing systems offer the illu-sion of infinite computing resources available on demand, allowing an expansion of the resources when needed. Hardware and software services are more efficiently han-dled than in other High Performance Computing (HPC) infrastructure as they can be added and released dynam-ically [6]. However, problems arise when scaling the sys-tem, this is, when trying to deploy a platform to support
Vilaplanaet al. BMC Medical Informatics and Decision Making2013,13:35 Page 2 of 10 http://www.biomedcentral.com/1472-6947/13/1/35
the computing needs of many hospitals, with different clinical departments, with their corresponding clinicians and patients. We can say that this health approach can be extrapolated to many other areas, administration, educa-tion, social care, etc.
Cloud computing has gained worldwide attention from many researchers, but only a small portion of them have addressed the QoS performance problem [7]. QoS per-formance includes indicators such as response time, task blocking probability, probability of immediate service, and mean number of tasks in the system [8], all of which may be determined using the tools of queuing theory [9].
We use Cloud computing and queuing system theory to address the problem of cloud scaling. By modelling a queue system we aim to provide scalability to the cloud infrastructure running on a given virtualized platform. Thus the cloud system can automatically scale out in an optimal way in order to guarantee the QoS (e.g. wait-ing time), plannwait-ing the proper deployment and removal of virtual machines according to the system load [10]. Platforms like Xen [11] or VMWare [12] offer virtual com-puting environments that allow for flexible cloud system management and configuration. Despite this, they do not offer tools to manage the computational resources (mainly virtual servers) in a dynamic and flexible way given a defined Quality of Service (QoS). In order to achieve that, OpenStack [13] can be used, an open source software for managing virtual machines.
Quite different, our work does not focus on the inves-tigation of specific queuing theory challenges but on the use of existing models for designing and testing perfor-mance of cloud systems in e-Health. We are interested in modelling QoS performance by scaling e-Health cloud platforms, leaving aside other issues such as reliability, security or availability.
Preliminary concepts and related work
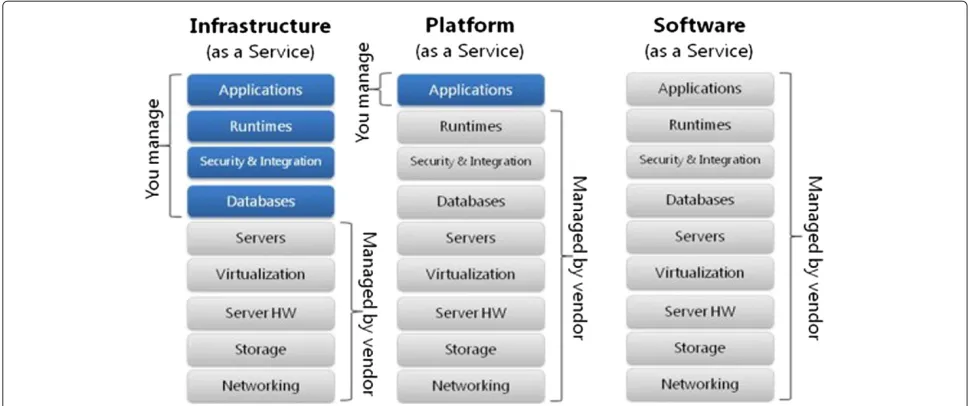
A cloud system is a network of computer servers that are offered under demand as a service, and they are designed to be scalable and flexible. Cloud systems can be served in three different ways (see Figure 1). The first layer is Infrastructure as a Service (IaaS), which means offering hardware, storage and physical devices over the Inter-net; The second layer is Software as a Service (SaaS), which means offering software and hosted applications over the Internet; And as a combination of both, Platform as a Service (PaaS), which means offering the capability to deploy applications created using programming lan-guages, libraries, services, and tools supported by the provider. The consumer does not manage or control the underlying cloud infrastructure, but has control over the deployed applications [7,14]. In our case, we are interested in modelling a private cloud system, maintained by one organization/institution, of the SaaS kind, which mainly
provides software services to its members or end users, clinicians and patients.
In [15], the authors obtained the response time distri-bution of a cloud system modelled by means of queu-ing theory on a classical M/M/mopen network with m
servers, assuming an exponential density function for the inter-arrival and service times (M). By using the response time distribution, they determined the level of service and the relationship between the maximum number of tasks and the minimum number of resources (virtual machines). The response time takes into account both waiting time in the queue and service time. In [16], the authors obtained the response time distribution for a cloud with a M/M/m/m+r system model. Having in addition a finite number of buffers (i.e. connections) of size m+r. M/M/m/m+r models can be more suit-able when we have a known finite buffer for arrivals. M/M/m models are useful when these maximum con-nections are unknown or not relevant, and the result-ing analysis is not as complex as in the M/M/m/m+r models.
The study of the case where the time between arrivals and/or service time does not follow an exponential dis-tribution is much more complex, as for example G/M/m, M/G/m and G/G/m models. Many theoretical studies have been based on extensive research in performance evaluation, including those that analysed the M/G/m model (e.g. [17]). The complexity in these cases comes from the impossibility of obtaining a closed formula to represent the probability distributions of the response or waiting time of customers in the queue, and therefore requires finding approximate models.
As stated in [18], the majority of current cloud comput-ing infrastructure as of 2009 consists of services that are offered up and delivered through a service centre such as a data centre that can be accessed from a web browser anywhere in the world. Our proposal also relies on that.
Figure 1Cloud services.Classification of cloud systems according to the services they offer.SaaSallows users to run online applications. The vendors own the applications and the users pay a fixed subscription fees.PaaSallows users to create their own cloud applications, providing all the execution and compilation of software as well as operating systems.IaaSallows users to run any applications they want to on cloud hardware of their choice.
However, traditional queuing results are not directly applicable to performance analysis of cloud computing when one or more of the three following issues holds [7], the number of servers is huge, this is cloud systems made up by hundreds or thousands of nodes [19]; the distribution of service times is unknown, and does not follow a “well-behaved” probability distributions such as exponential distribution; finally, the traffic intensity can vary in an extremely wide range. Cloud centres must pro-vide expected QoS at widely varying loads due to its dynamic nature [15,20], so load peaks are badly modelled by queuing systems.
Cloud architecture
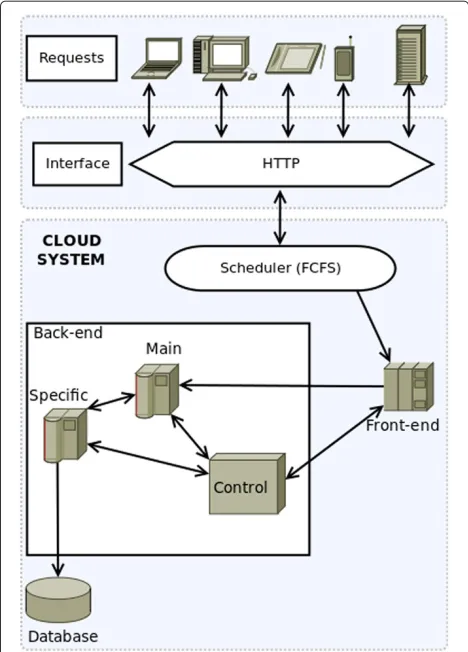
The architecture of our cloud platform consists of two main parts: Front-end and Back-end (see Figure 2).
Front-end
The Front-end is the gateway to the cloud and consists of the software components and the interfaces needed to connect to the platform by using remote client appli-cations. These applications usually use standard Web protocols to access the system and an authentication pro-tocol which allows access to authorised users (clinicians and patients). All requests are processed by the sched-uler, which sends the selected tasks to the queue of the Back-end. For simplicity, a First Come First Serve (FCFS) scheduling policy was assumed.
As we are proposing a generic system, medical work-flows will not be implemented as part of our model. Instead, these medical workflows will be implemented
via software. All arriving tasks in our model will consist of web requests, avoiding deadlock situations that could otherwise arise when using a FCFS queue policy.
Back-end
The Back-end functions include management of the job queue, the servers and their virtual machines and the stor-age servers with their database system. Database inconsis-tencies are avoided by considering only one storage (i.e. database) server. All requests from the Front-end are man-aged by a scheduler to be allocated in a queue. The server system consists of multiple virtual machines managed by OpenStack and connected to a database server.
The Back-end is made up of three different kinds of servers:
Primary servers: virtual machines running the multi-threading application. The parallel degree of the applica-tions will depend on the threads (tasks making up the application when executed) it can be decomposed. These servers are responsible for performing most of the com-putation.
Specific Servers: virtual machines whose main task is to perform specific calculations and handle the Front-end interface. Moreover, they manage the communication with the database and with other servers (even the pri-mary servers).
Vilaplanaet al. BMC Medical Informatics and Decision Making2013,13:35 Page 4 of 10 http://www.biomedcentral.com/1472-6947/13/1/35
Figure 2Cloud system modelling.Design of the proposed cloud architecture. User requests from multiple devices go through a HTTP interface to the cloud system. A First-Come-First-Serve scheduler distributes all these requests to the Front-end nodes, which forward these to the Back-end nodes. The Back-end nodes process the requests and compute the expected user result, accessing the system database if needed. In the Back-end, there are also control nodes that monitor the state of the system, and are able to create or destroy virtual machines according to that state.
OpenStack
The cloud architecture presented in previous section can be implemented with OpenStack [13]. OpenStack is an open source software that provides a massively scalable and pluggable framework for building private and public clouds. Notice that our cloud was characterised as private and scalable, so it ideal for our purpose. It goes beyond a classic hypervisor (i.e. VirtualBox [21], Xen [11], VMware [12]), and allows the setup of virtual machines dynami-cally, as computational resources are needed. This guar-antees high QoS in periodic traffic spikes, when the arrival rate of the requests to be served increases. OpenStack can be set up to create new instances when current servers are overwhelmed and to shut them down when traffic decreases. This feature ensures you that the number of instances in the cloud system scales up when your system
grows, and is particularly well suited for applications that experience deep variability in usage.
OpenStack offers a set of APIs (Application Program-ming Interface) that allow to interact dynamically with the installed OpenStack platform. Using these APIs, it is possible to authenticate and interact with the system from the command line or programmatically. For exam-ple, in Python we have available the python-nova client API [22,23] avaialble, where thenova bootandnova delete
commands allow us respectively to boot a new server and immediately shut down and delete a server dynamically.
Methods
System analysis and design
The main aim of this work is the design of the Back-end, composed of the primary, specific and control servers. The design has to take into account the analysis of require-ments, which in our case exclusively focus on the charac-terisation of arrival frequency of the users and the QoS in serving them with our cloud platform.
The e-Health application we are targeting must be scal-able in order to provide a service to an unlimited number of users which will be mainly healthcare staff and patients from various hospitals. Taking into account the cloud architecture (Section Back-end), the primary servers of the Back-end are the ones in charge of serving the plat-form users’ requests.
Furthermore, several specific servers will be in charge of the communications with the database containing the healthcare information.
Finally, the control server will be in charge of manag-ing the creation and disposal of thespecificandprimary
servers. In order to control the system we propose the creation of a queuing system that models system perfor-mance. This model is described in SectionModelling.
Figure 2 shows the design of the cloud system, includ-ing how service requests are planned by the “Scheduler” via a FCFS queue. Then, the requests are forwarded to the Front-end in charge of submitting tasks to the Back-end. Finally, the communication among the Back-end compo-nents is also shown.
Modelling
In this section, we will focus only on the Back-end, which is managed by thecontrol server. Its basic function is to create and remove specific and primary servers. These decisions are taken according to the waiting time of the user tasks.
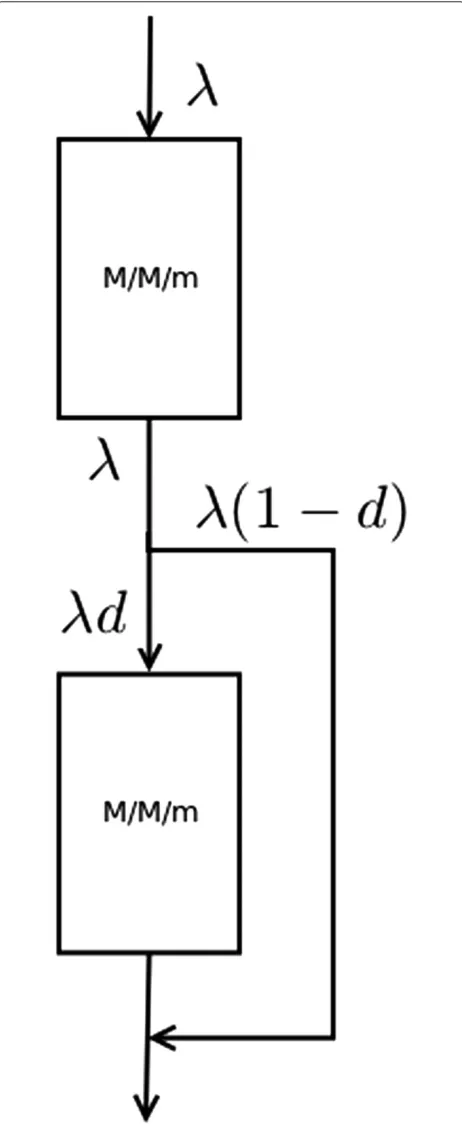
Figure 3Model.Graphical representation of the two system queues. Both of them are of the same type (M/M/m). The firstM/M/mqueue models the access to the primary servers, and is always accessed when new requests enter the system. The secondM/M/mqueue models the access to the database cluster, which is accessed based on a probability depending on the Back-end nodes.
primary serverswhile the second one models thespecific serversthat interact with the database.
Abstracting away the details of the application prob-lem, we propose a model of a queueing system composed by two M/M/m queues connected serially, as can be seen in Figure 4. The user tasks enter the system though the first queue; then they move on to the second queue (this represents the database system) with probabilityd. Conversely, a user has(1−d) probability of leaving the system without passing through the second queue. In this way, we are modelling a system in which each user requires a computing operation and a database access with probabilityd.
According to Burke’s theorem [24], the output of a stable
M/M/mqueue with an input parameterλand a service parameterμfor each one of themservers is a Poisson pro-cess with the same input parameterλ. This means that the serial connection of twoM/M/msystems (without cycles) is independent between them and these systems keep the same density distributions, both for arrival and service.
Our two queues can be analysed independently, and they form an open Jackson network. The interconnection and behaviour between the queues is ruled by Burke’s [25] and Jackson’s theorems. Burke states that we may connect many multiple-server nodes together in a feedforward network and still preserve the node-by-node decompo-sition. Jackson [26,27] states that to calculate the total
Vilaplanaet al. BMC Medical Informatics and Decision Making2013,13:35 Page 6 of 10 http://www.biomedcentral.com/1472-6947/13/1/35
average arrival rate we must sum the arrivals from outside the system plus arrivals from all internal nodes.
M/M/m
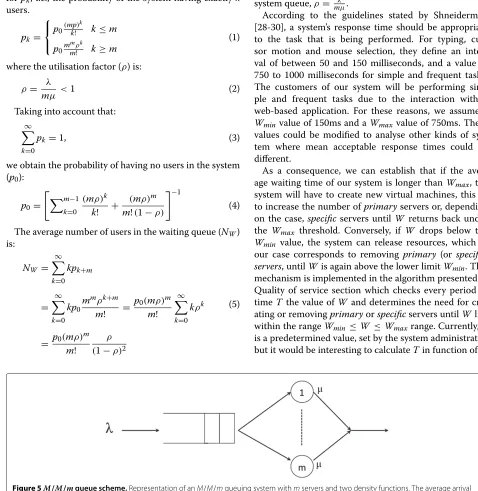
In this section we analyze theM/M/mqueuing system, withmservers and two density functions, that represents the average arrival (λ) and service rate per server (μ), as can be seen in Figure 5.
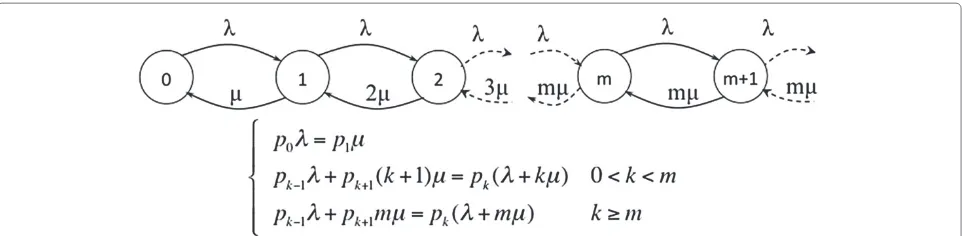
Figure 6 shows the state transition diagram of the system in equilibrium, as well as the equations that define it.
Solving the system of equations we can obtain the value forpk, i.e., the probability of the system having exactlyk
users.
pk =
⎧ ⎨ ⎩
p0(mp) k
k! k≤m
p0m mρk
m! k≥m
(1)
where the utilisation factor (ρ) is:
ρ= λ
mμ <1 (2)
Taking into account that: ∞
k=0
pk=1, (3)
we obtain the probability of having no users in the system (p0):
p0=
m−1
k=0 (mρ)k
k! +
(mρ)m
m!(1−ρ)
−1
(4)
The average number of users in the waiting queue (NW)
is:
NW=
∞
k=0 kpk+m
=
∞
k=0 kp0
mmρk+m
m! =
p0(mρ)m m!
∞
k=0 kρk
= p0(mρ)m m!
ρ (1−ρ)2
(5)
The average waiting time in the queueW (this is the QoS parameter we have chosen for this work) is defined as:
W= NW
λ (6)
Quality of service
As was said before, the selected Quality of Service (QoS) criterion is the waiting time in the queue. This waiting time depends on the utilization factor ρ. In an M/M/m
system queue,ρ= mλμ.
According to the guidelines stated by Shneiderman [28-30], a system’s response time should be appropriate to the task that is being performed. For typing, cur-sor motion and mouse selection, they define an inter-val of between 50 and 150 milliseconds, and a inter-value of 750 to 1000 milliseconds for simple and frequent tasks. The customers of our system will be performing sim-ple and frequent tasks due to the interaction with a web-based application. For these reasons, we assume a
Wmin value of 150ms and aWmaxvalue of 750ms. These values could be modified to analyse other kinds of sys-tem where mean acceptable response times could be different.
As a consequence, we can establish that if the aver-age waiting time of our system is longer thanWmax, the
system will have to create new virtual machines, this is, to increase the number ofprimaryservers or, depending on the case,specific servers untilW returns back under the Wmax threshold. Conversely, if W drops below the Wmin value, the system can release resources, which in
our case corresponds to removing primary (or specific)
servers, untilWis again above the lower limitWmin. This
mechanism is implemented in the algorithm presented in Quality of service section which checks every period of timeT the value ofW and determines the need for cre-ating or removingprimaryorspecificservers untilW lies within the rangeWmin ≤W ≤Wmaxrange. Currently,T
is a predetermined value, set by the system administrator, but it would be interesting to calculateTin function ofρ.
Figure 6Transition state diagram and equilibrium equations ofM/M/mqueue.State transition diagram of theM/M/mqueue and the equilibrium equations that define it. The state space records the number of customers in the queueing system. The valuesλandμrepresent the arrival and service rates of customers.
In the same way, it would also be interesting to incorpo-rate some kind of control mechanism in the algorithm in order to decide which type of virtual machines (primary or specific) should be created or removed when necessary.
Algorithm 1 QoS control Ensure:Wmax=750ms Ensure:Wmin=150ms
whileTRUEdo ifW >Wmaxthen
whileW>Wmaxdo start−virtual−server end while
else
ifW <Wminthen whileW<Wmindo
stop−virtual−server end while
end if end if sleep(T) end while
Results and discussion
The following section presents an analysis about how the response time is affected by increasing the number of servers in anM/M/mqueue. Figure 7 shows how the wait-ing times (in generic units) of the first queue increases by increasing the occupation ratio ρ for one, two, ten and a hundred servers. These values have been obtained by using the queue simulator server Queue 2.0 [31].
For the second queue, the entering rate is based on λd. Figure 8 shows the same results as Figure 7 by using instead the second queue. We have assumed a value ofd=
0.9 as the probability of one user accessing the database servers.
The mean access rate to the database d can widely vary from one application to another. We have assumed a 0.9 value due to our experimental application making requests to the database for 90% of the user requests. We also did some testing with slightly modified values ofdand proportional results were obtained.
As was expected, the waiting time of the queue 2 is smaller than that of queue 1. As the user flow lowers in the queue 2 also decreases its mean waiting time. Thus,
Vilaplanaet al. BMC Medical Informatics and Decision Making2013,13:35 Page 8 of 10 http://www.biomedcentral.com/1472-6947/13/1/35
Figure 8Waiting time on queue 2 (M/M/m).Graph plotting how the waiting times (in generic units) of the second queue increases by increasing the occupation ratioρfor one, two, ten and a hundred servers. It shows that increasing the number of servers significantly decreases the resulting waiting time.
waiting times decreases withd.W is the sum of waiting times in queue 1 and 2.Wmax andWmin will determine the number of clients/connections to be served simultane-ously. For example, we could setWmax=13 if this generic
time value corresponds to 750ms in the real cloud. It has been shown how a widely used and tested kind of queuing model can be used to model cloud computing systems.
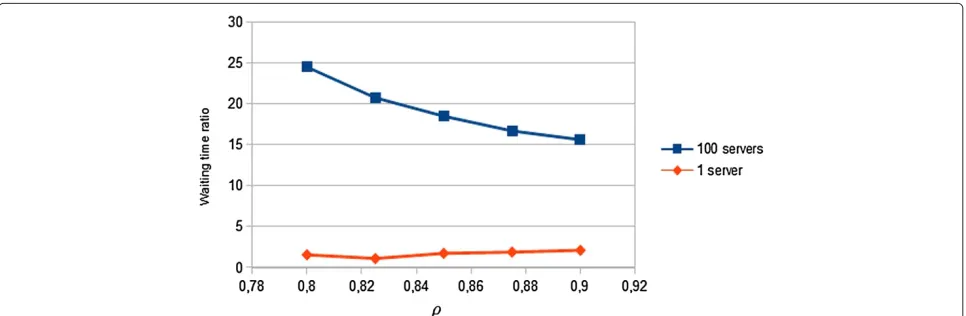
We would like to highlight that for small numbers of servers, the relation between the waiting time of both queues does not change, keeping it at constant levels. On the other hand, for large computing systems, with huge computing requirements (virtual servers), the wait-ing time between the first and the second phase tends to stabilize when we increase the parameterρ. Furthermore, as Figure 9 shows, this relation suffers a significant drop in large systems with high number of virtual machines. This explain why queuing systems cannot be applied to model huge cloud farms of servers.
Conclusions
In this paper, a new application of cloud computing paradigm is presented by designing a system model applied to e-Health. The design of a cloud system requires the use of scalable, centralized, flexible, and dynamic architectures with a high level of integration. We have selected queuing theory as the basic mean to model the performance of the cloud system. As a result, the dynam-ics of the system based on the creation/deletion of the virtual systems is controlled by a queuing system model.
Through a preliminary analysis, the design of a cloud architecture with e-Health requirements has been pro-posed. The combination of two systems M/M/m in sequence has been proposed to model the cloud e-Health platform. The first offers compute services, and the sec-ond provides service access to a database server. Our work has shown that to provide good QoS, in terms of aver-aged waiting times, the the waiting time between the first
and the second phase tends to stabilize. This reduction becomes much more significant when we increase the number of virtual machines.
The proposed system can improve the e-Health field by providing a model to support medical software, sav-ing resources and enhancsav-ing the control and management of the patients. Pay-per-use service would lower overall costs. The proposed system would also allow tendencies that could be used to improve the current treatments to be generated and analysed. Also, having an electronic clin-ical history would save paper, physclin-ical space and would improve the efficiency of those who need to access it. The design can easily satisfy the needs of e-Health related applications without major changes, allowing the con-struction of web-based applications that implement all the needed medical workflows. The proposed system guar-antees high scalability, ensuring that when the system requirements grow, the underlying platform will be able to handle the situation. Also, the proposed system suggests the usage of a large shared infrastructure, which would result in many hospitals and treatments having homo-geneous data that would facilitate correlations and data mining.
Future work
As explained above, we would like to extend the algorithm presented in Quality of service section to determine the value ofT based onρ. We would like to run more tests in order to explain how fast can W (waiting time) change and the proposed system reaction to these changes. Fur-thermore, it would be of great interest to incorporate mechanisms for deciding the type of virtual machines that should be created/deleted (primary or specific servers). Moreover, we would like to replace both queues with a more realisticM/M/m/m+r/Kmodel, withmservers,
m+ruser connections (the maximum number of users in the system, that is, users receiving the service, being at mostm, plus users who are waiting, at most r), and a maximum number ofKusers as presented in [7]. In our case, if patients can enter the system, aM/M/msystem could be used, as we would have not a clear reference to the maximum number of users in the system. In the other case, if patients can not enter the system, we could take the M/M/m+r/K approach because we would have a more specific set of customers. We would want to create an adaptive system that could select the best model for each situation. As future work, we also plan to develop an application by using OpenStack, which will emulate the requirements of the Tobacco Control Unit in Santa Maria Hospital (Lleida, Spain), using real data based on user numbers and requirements. We have already imple-mented a preliminary prototype [32]. The aim of this work would be to estimate the computing resources that such a Tobacco Control Unit would require. In this way, by
knowing the hospital users, we will design a cloud system applied to e-Health in a specific hospital. This application should be extended to emulate the behaviour of the system assuming the scalability of the system by increasing the number of hospitals. We would also like to extend the scal-ability tests to more than one hundred servers. We would like to test up to one million servers in order to verify the scalability of the system.
Competing interests
The authors declare that they have no competing interests.
Authors’ contributions
JV, RF and DR contributed to the study concept and design of the experimental tests. JV and JR performed the experimental tests and the data analysis. FS contributed to the development of the model and the algorithms presented in this paper, and took the lead in drafting this paper. FS, JV and JR wrote the first version of the manuscript. All five authors contributed to the preparation of the manuscript. All authors read and approved the final manuscript.
Authors’ information
JV received his BS and MS in computer science from Universitat de Lleida (UdL) in 2006 and 2008 respectively. Currently he is a PhD student in the same University and his research interests are Cloud computing, e-Health, and parallel simulation.
FS received the B.S., M.S. and Ph.D. degrees in computer science from the Autonomous University of Barcelona, Spain, in 1991, 1994 and 2002 respectively. At the present time, he is an associate professor in the Department of Computer Science at the University of Lleida (Spain). His research interests include distributed processing and HPC.
JR received his B.S., M.S. and Ph.D. in computer science from University of Lleida (UdL) in 2006, 2008 and 2012 respectively. Currently he is leading the research division at ICG Software and he is an assistant lecturer at University of Lleida. His main research interests are high-performance computing, P2P systems and Cloud computing.
RF received the MS degree in computer science from the University Deusto of Bilbao in 2003 and the Ph.D degree in computer science University Carlos III of Madrid in 2010. She had been an assistant professor since 2004 at the Universidad Carlos III de Madrid. Nowadays she is working as Research Assistant in University of Edinburgh. Her main reseach interest are high performance computing, data stream transfer and Cloud Computing. DR received his BS and PhD in Physics from University of Cantabria in 1998 and 2007 respectively. Currently he is an associate researcher at the Edinburgh Data Intensive Research group (School of Informatics) and the Brain Research Imaging Centre (Division of Clinical Neurosciences) of the University of Edinburgh. His main research interests are information governance, privacy protection in the e-Health context and data intensive science.
Acknowledgements
This work was supported by the MEyC under contract TIN2011-28689-C02-02. Some of the authors are members of the research group 2009 SGR145, funded by the Generalitat de Catalunya.
Author details
1Computer Science Department, University of Lleida, Jaume II 69, 25001 Lleida, Spain.2Unitat de Tabaquisme of Hospital Santa Maria de Lleida, Alcalde Rovira Roure, 44, 25198, Lleida, Spain.3Edinburgh Data-Intensive Research Group, School of Informatics, The University of Edinburgh, Edinburgh, UK.4ICG Software, Pol. Industrial Torrefarrera C. Mestral, s/n 25123 Torrefarrera, Lleida, Spain.
Received: 17 September 2012 Accepted: 19 February 2013 Published: 14 March 2013
References
Vilaplanaet al. BMC Medical Informatics and Decision Making2013,13:35 Page 10 of 10 http://www.biomedcentral.com/1472-6947/13/1/35
2. Bobrie G, Chatellier G, Genes N, et al.:Cardiovascular prognosis of “masked hypertension” detected by blood pressure
self-measurement in elderly treated hypertensive patients.JAMA 2004,291(11):1342–1349.
3. Le ´on A, et al.:A new multidisciplinary home care telemedicine system to monitor stable chronic human immunodeficiency virus-infected patients: A randomized study.PLoS ONE2011, 6(1):e14515. doi:10.1371/journal.pone.0014515.
4. Kuo AMH:Opportunities and challenges of cloud computing to improve health care services.J Med Internet Res (JMIR)2011, 13(3):e67.
5. Rosenthal A, Mork P, Li MH, Standford J, Koester D, Reynolds P:Cloud computing: A new business paradigm for biomedical information sharing.J Biomed Inform2010,43(2):342–353.
6. Armbrust M, Fox A, Griffith R, Joseph A, Katz R, Konwinski A, Lee G, Patterson D, Rabkin A, Stoica I, Zaharia V:Above the clouds: A berkeley view of cloud computing.Technical Report No. UCB/EECS-2009-28. 7. Khazaei H, Misic J, Misic V:Performance analysis of cloud computing
centers using M/G/m/m+r. queuing systems.IEEE Trans Parallel Distributed Syst2012,23:5.
8. Wang L, von Laszewski G, Younge A, He X, Kunze M, Tao J, Fu C:Cloud computing: A perspective study.New Generation Comput2010, 28:137–146.
9. Kleinrock L:Queueing Systems: Theory, vol. 1.Wiley-Interscience, 1975. Published in Russian, 1979. Published in Japanese, 1979. Published in Hungarian, 1979. Published in Italian 1992.
10. Mao M, Li J, Humphrey M:Cloud auto-scaling with deadline and budget constraints.InGrid Computing (GRID), 2010 11th IEEE/ACM International Conference; 2010:41–48.
11. Barham P, Dragovic B, Fraser K, Hand S, Harris T, Ho A, Neugebauer R, Pratt I, Warfield A:Xen and the art of virtualization.SIGOPS Oper Syst Rev 2003,37(5):164–177.
12. WMWare Staff:Virtualization overview. White paper.[http://www. vmware.com/pdf/virtualization.pdf]. 2012-08-25.
13. The OpenStack Project:OpenStack: The open source cloud operating system.[http://www.openstack.org/software/]. 2012-08-25.
14. Mell P, Grance T:The NIST definition of cloud computing. Gaithersburg: NIST Special Publication 800-145; 2011. 20899-8930. 15. Xiong K, Perros H:Service performance and analysis in cloud
computing.Proc IEEE World Conf Serv2009,1:693–700.
16. Yang B, Tan F, Dai Y, Guo S:Performance evaluation of cloud service considering fault recovery.Proc First Int’l Conf Cloud Comput (CloudCom’09)2009:571–576.
17. Ma N, Mark J:Approximation of the mean queue length of an M/G/c queueing system.Oper Res1998,43:158–165.
18. Tech:What is Cloud Computing.[http://jobsearchtech.about.com/od/ historyoftechindustry/a/cloud computing.htm]
19. Amazon elastic compute cloud, user guide. API version ed., Amazon web service LLC or its affiliate.2010. [http://aws.amazon.com/ documentation/ec2]
20. Baker J, Bond C, Corbett J, Furman JJ, Khorlin A, Larsonand J, Leon JM, Li Y, Lloyd A, Yushprakh V:Megastore: Providing scalable, highly available storage for interactive services.Proc Conf Innovative Data Syst Res (CIDR) 2011:223–234.
21. Watson J:VirtualBox: bits and bytes masquerading as machines. Linux J2008,2008(166).
22. Beloglazov A, Buyya R:OpenStack neat: A framework for dynamic consolidation of virtual machines in OpenStack clouds – A blueprint.Technical Report CLOUDS-TR-2012-4, Cloud Computing and Distributed Systems Laboratory, The University of Melbourne2012. 23. Beloglazov A, Fotuhi S, Alrokayan M, Buyya R:Deploying OpenStack on
CentOS using the KVM Hypervisor and GlusterFS distributed file system.Technical Report CLOUDS-TR-2012-3, Cloud Computing and Distributed Systems Laboratory, The University of Melbourne2012. 24. Burke P:The output of a queuing system.Oper Res2010,4:699–704. 25. Burke PJ:The Output of a Queueing System. New York: Bell Telephone
Laboratories-New York; 1956.
26. Jackson JR:Networks of waiting lines.Oper Res1957,5:518–521. 27. Jackson JR:Jobshop-like queueing systems.Manag Sci1963,
10:131–142.
28. Nah F:A study on tolerable waiting time: how long are web users willing to wait?Behavior and Information Technology2004, 23(3):153–163.
29. Hoxmeier JA, DiCesare C:System response time and user satisfaction: an experimental study of browser-based applications.InProceedings of the Association of Information Systems Americas Conference; 2000. 30. Shneiderman B:Designing the user interface: strategies for effective
human-computer interaction.Addison-Wesley Longman Publishing Co., Inc.; 1986. 0-201-16505-8.
31. Queue 2.0 Website.[http://www.win.tue.nl/cow/Q2/]. 2012-08-25. 32. Hesoft Group SCP.[http://www.hesoftgroup.com]. 2012-08-25.
doi:10.1186/1472-6947-13-35
Cite this article as:Vilaplanaet al.:The cloud paradigm applied to e-Health. BMC Medical Informatics and Decision Making201313:35.
Submit your next manuscript to BioMed Central and take full advantage of:
• Convenient online submission
• Thorough peer review
• No space constraints or color figure charges
• Immediate publication on acceptance
• Inclusion in PubMed, CAS, Scopus and Google Scholar
• Research which is freely available for redistribution