Mean Failure Cost Extension Model towards Security
Threats Assessment: A Cloud Computing Case Study
Mouna Jouini
*, Latifa Ben Arfa Rabai
Department of computer science, ISG, Tunis, Tunisia.
* Corresponding author. Tel.: +21696670070; email: [email protected] Manuscript submitted January 10, 2015; accepted March 8, 2015.
doi: 10.17706/jcp.10.3.184-194
Abstract: The development of information technology leads to several kind of security threats which can cause different damages like financial losses. Security threat breaches affect specially the confidentiality, the integrity and the availability of a system. Indeed, as the environment continues to become more dynamic the process of making good security decisions is becoming more and more challenging. Hence, managers have to adopt successful policies and practices to prevent security breaches. They need to evaluate or assess security threats breaches. The main contributions of this paper is a new a quantitative analysis of information systems based threat classification approach. The proposed approach used threat classification to assess and evaluate threat impacts to develop strategies to mitigate the effects of threats classes on the system. The idea is to consider an average presence of threats in a class of threats in order to achieve a certain stability of this class in time. Then, we propose an approach that estimates the security of information systems.
Key words: Cloud computing, cyber security metrics, information security, mean failure cost (MFC), security threats assessment, threat, threat classification.
1.
Introduction
With the development of Information and Communication Technologies and increasing accessibility to the Internet, organizations become vulnerable to many threats. In fact, their information becomes also exposed to cyber attacks risks. Managers need to know the level of the damage that a cyber attack can cause and the possibility of occurrence, so they can determine what they need to do to prevent the attack by selecting appropriate safeguards or repairing damage. In addition to that, information systems security risks are a topic that has become increasingly significant in recent years. Its impacts of information system security violations have become more and more costly [1], [2]. In [3], the 2008 survey from the Computer Security Institute reported losses averaging $345.000 among the 39% of respondents who are able to estimate the losses caused by various types of computer security incidents. The survey reported, as well, that the percentage of attacks comes especially from inside an organization versus those from outside. In fact, the percentage of losses attributed to outsiders attacks jumped from 36% in 2007 to just 53% in 2008 from total losses [3]. Another survey in 2010 presented on 738 organizations by the Computer Security Institute reported a total estimated annual loss of $190 million caused by information systems security incidents [4]. Besides, it reported that, 67.1% of the total losses are caused by malware infection (like viruses).
may be manifested via a threat agent using a particular penetration technique to cause undesired effects [5]-[8]. Security threats classification allows identifying and evaluating threats to propose appropriate security solutions.
We propose in this paper, to quantify security breaches, a quantitative security risk model based on threat classifications to identify critical security threats classes and assess accurately threats risks. Our solution focuses on quantifying security threats in order to find countermeasures per threats class. The proposed approach lead to a security assessment model illustrates how a quantitative risk analysis of an information system can be carried.
The rest of our article is organized as follows. In the next section, we discuss how to assess security threats using the mean failure cost (MFC) model. Then, we introduce a security risk assessment model, which we name MFC Extension, in order to quantify threats based on a threats classification. In addition to that, we illustrate the use of the MFCE model on Cloud Computing. Finally, we propose a method to validate our quantitative security risk model.
2.
Related Work
To make effective security decisions, managers need to assess or estimate the security of the system and well characterize it. There are many measures in literature to support the analysis of how well a system meets its security objectives. There are several quantitative security risk assessment models that estimate the dependability of a system which can be assessed according to the reliability, availability, maintainability and security metrics
2.1.
Risk analysis Model for Cloud Computing System
In [7], a risk assessment approach from the perspective of a cloud user is presented to analyze the data security risks before putting his confidential data into a cloud computing environment. This work allows helping cloud computing users to evaluate the risk of their data security. It allows users to perform risk analysis before putting their critical data in a security sensitive cloud. The method used trust matrix to evaluate the trust degree of data location. It contains two parameters: data cost and provider’s history. Data cost is assigned by the users based on the criticality of the data and history includes a provider’s profile of past services. This approach is easy to be adopted; however, it is not a structured an analysis approach that can be used for a deep risk analysis in cloud computing environments.
2.2.
SecAgreement Security Assessment Framework
In [9], a framework called SecAgreement (SecAg) is presented, that extends the current SLA negotiation standard, to allow security metrics to be expressed on service description terms. It enables cloud service providers to include increasing the likelihood that their services will be used. The approach defines a cloud service matchmaking algorithm to assess and rank SecAg enhanced SLA by their risk, allowing organizations to quantify risk, identify any policy compliance gaps that might exist, and thus select the cloud services that best meet their security needs. This framework can be used just to compare between cloud providers to select the best one basing on calculation of risk factor of each one.
2.3.
Quantitative Risk and Impact Assessment Framework (QUIRC)
which map to that SO category.
The advantage of this quantitative approach of risk assessment is that it enables providers and customers to comparatively assess the relative robustness of different Cloud vendor offerings and approaches in a defensible manner. However, this approach is the collection of historical data for threat events probability calculation, which requires data input from those to be assessed Cloud computing platforms and their vendors.
2.4.
MTTF-Like Metrics
The Center for Internet Security [11] proposed a set of MTTF-like metrics that capture the concept of cyber security. These include: the mean time to failure (MTTF) the mean time to incident discovery, the incident rate and mean time between security incidents.
The mean time to failure (MTTF) is a quantity that reflects the failure rate of a system. It describes the expected time that a system will operate before the first failure occurs. It is the number of total hours of service of all devices divided by the number of devices [10].
The mean time between failures (MTTB) is a measure of reliability for repairable product and MTTF (Mean Time To Failure) for non repairable product. It describes the expected time between two consecutive failures for a repairable system. These values are calculated by the following equation. These models present several shortcomings. In fact, they reveal the failure rate of the whole system and ignore the variance stakes amongst different stakeholders.
2.5.
The MFC Model
Ben Aissa et al. introduced, in [12], the concept of mean failure cost (MFC) as a measure of dependability in general, and a measure of cyber security in particular. The MFC represents a stochastic model that quantifies this random variable in terms of financial loss per unit of operation time (e.g. $/h) due to security threats.
The MFC provides a measure of security that depends on security requirements, stakeholder’s interest and architectural component of a system. In fact, it varies by stakeholder and takes into account the variance of the stakes that a stakeholder has in meeting each security requirement, the variance in failure cost from one requirement to another, the variance in failure probability from one component to another and the variance in failure impact from one stakeholder to another.
The mean failure cost is defined by the following formula [12]:
MFCST DP IM PT (1)
where:
MFC is a vector with as many entries as there are system stakeholders, and MFCi is a random variable that represents the cost to stakeholder Hi that may result from a security failure.
ST is the stakes matrix: a matrix where rows represent stakeholders, columns represent security requirements and the cell ST(H, R) is the stake that stakeholder H has in satisfying requirement R. A stake is a financial interest that can be lost by a stakeholder when R fails. The stakes matrix is filled, row by row, by the corresponding stakeholders.
DP is the dependability matrix: a matrix where rows represent security requirements of the system, columns represent system components and DP(R, C) is the probability that the system fails to meet requirement R if component C is compromised. DP matrix is filled by the architect of the system who knows the role that each component plays in achieving each requirement.
materialized. IM is filled by the Verification and Validation team, who know how the various security threats compromise system components.
PT is the threat vector: a vector that has as many entries as there are threats in our threat model, and PT(T) is the probability that threat T. PT is filled the security team, which knows the threat configuration (i.e. the probability of occurrence of each threat per unit of operation time) within which the system operates.
The MFC model is used to evaluate security breaches in many real word applications like: An Ecommerce system [12] and a Cloud Computing (CC) system [13]-[15]. We will present in the next section a new threat assessment model which extends the MFC metrics.
3.
The MFC Extension (MFCE) Model
In this section, we propose a new cyber security metric, extension of the mean failure cost (MFC) metric, based on threats classification and especially on our proposed threat classification model [7]. We illustrate, then, this infrastructure by means of a cloud computing application.
3.1.
Motivation
Security threats may be originating from within or from outside threats that may be manifested, as well, via a threat agent using a particular penetration technique to cause dangerous effects [13]-[17],. Thus, managers need to know and find threats that influence their assets and identify their impact to determine what they need to do to prevent attacks by selecting appropriate countermeasure. Then, they need to evaluate the extent of the damage caused by these threats.
Therefore, it is necessary to have an understanding of the threats and the vulnerabilities. Security threat classification allows detecting, understanding, and evaluating threats in order to propose appropriate security solutions and it helps, as well, to assess accurately and evaluate threat impacts. In fact, security threats can be observed and classified in different ways by considering different dimensions or classes of the system like its source code, attacker’s motivation or its users or their roles. Based on the obtained assessment, we will propose a quantitative risk analysis of an information system based on a threat classification model to estimate security breaches. We aim at the following to amend the MFC model to obtain a more comprehensive model. Based on several threats classes, we propose a new cyber security metric, extension of the mean failure cost (MFC) metric. After the study and analysis of security threats and the MFC metric, we noticed the following MFC limits:
Security threats are evolutive and variable over time and have several characteristics and in PT vector, there is no logical or hierarchical structure between the different catalogued threats as they are not based on a particular attribute to classify them.
Underestimation of the MFC. In fact, in the presented threat vector PT, the term used to define the threat can be ambiguous; this can lead to an overlap between the various threats i.e each threat may belong to several classes at once and thus it is computed many times, so we have an underestimation of the mean failure cost.
Users who may use this method to derive threats may have completely different results.
Because of that, we propose an extension of the MFC model in which we focus on refining the estimation of the impact matrix IM and the threat vector PT. We call this model the MFC Extension model (MFCE).
3.2.
The New Cyber Security Model
Our cyber security model allows studying the impact of a class of threats rather than a threat. Indeed, threats are variables in time and security solutions change over time. The basic idea is to consider a class of threats and tries to find solutions to this class and consider the probability that a class is present, will be the average of the probabilities of present threats in this class threats in order to achieve a certain stability of this class in time. This allows converging towards a stability of existence of a class.
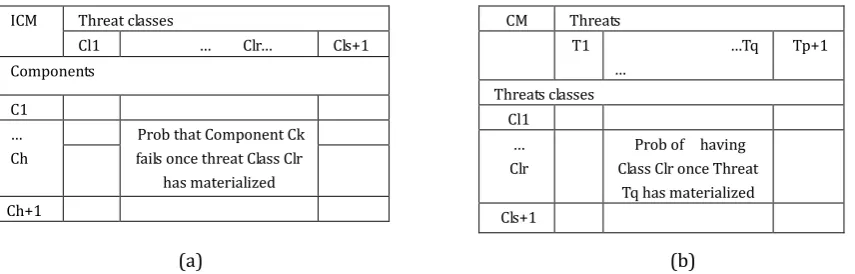
For the impact matrix IM, we generate two matrices: the new impact matrix IMC and the threat classes Matrix CM, as shown in Fig. 1. Thus, the MFC Extension (MFCE) has the following new formula:
MFCEST DP ICM CM PT (2)
where:
MFCE is a vector that represents the mean loss that the stakeholder may experience due to security failure.
ICM is the impact class matrix: a matrix where rows are system components, columns are security threats classes that we consider and ICM (C, Cl) is the probability that component C fails once threat Class Cl has is materialized.
CM is the class matrix: A matrix where rows are threats classes, columns are security threats under consideration and CM (Cl, T) is the probability of having Class Cl once Threat T has materialized.
The MFCE model is a formula in the form of a hierarchical linear system composed of stakeholders, security requirements, architectural components of the system, security threats classes, and threats. In fact, an information system has its stakeholders who have stakes in meeting some security requirements when a security threat occurs. The proper functioning of a system requires certain attributes of dependability named as security requirements. Security requirements failures depend on architectural components failures which are prone to several threats. Finally, a threat has several criteria like source, users and motivation, intention that affect information systems.
(a) (b)
Fig. 1. (a) the Impact threat classes matrix structure; (b) the Threat Classes matrix structure.
4.
Illustration of the MFC Extension Model: A Cloud Computing System
We illustrated in previous work the use of the MFC model on Cloud Computing (CC) system [13]-[15]. In this section, we show the use of our model (MFCE) on the same case study in order to compare the derived results.
We identify, firstly, the security requirements, the stakeholders and their stakes in meeting these requirements, the architectural components and the security threats that affect the cloud computing system. Then, we fill the matrixes ST, DP, ICM, CM and PT using empirical data from [18] to obtain the following MFC Extension (MFCE) vector.
As for security requirements, we identify seven generic security requirements classified based on the levels ICM Threat classes
Cl1 … Clr… Cls+1 Components
C1 … Ch
Prob that Component Ck fails once threat Class Clr
has materialized Ch+1
CM Threats
T1 …Tq …
Tp+1
Threats classes Cl1
… Clr
Prob of having Class Clr once Threat
of criticality of data as shown in our previous work [13], namely: Availability of critical data (AVC), availability of archival data (AVA), integrity of critical data (INC), integrity of archival data (INA), confidentiality of classified data (CC), confidentiality of proprietary Data (CP), and confidentiality of public data (CB).
Table 1. Stakes Matrix
Security Requirements AVC AVA INC INA CC CP CB
Stakeholders
PR 500 90 800 150 1500 1200 120
CS 150 40 220 80 250 180 60
GS 60 20 120 50 2500 30 12
IS 0,05 0,015 0,3 0,2 0,3 0,1 0,01
We consider, also, four classes of stakeholders in this case study, namely: a cloud computing provider (PR), a corporate subscriber (CS), a governmental subscriber (GS), and an individual subscriber (IS).
Based on a quantification of these stakes in terms of thousands of dollars ($K) per hours of operation, we produce the following stakes matrix ST as shown in Table 1.
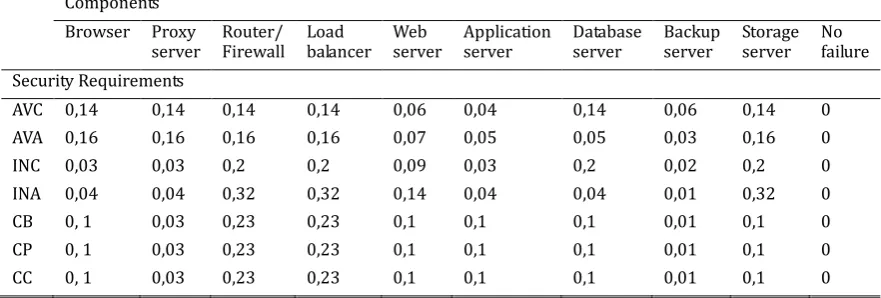
Based on the Cloud Computing system architecture defined in our previous work [13], we generate the dependency matrix shown in Table 2. We consider that the cloud computing system components includes: a browser, a proxy server, a router/firewall, a load balancer, a web server, an application server, a database server, a backup server and a storage server [13].
Table 2. Dependency Matrix
Components Browser Proxy
server Router/ Firewall Load balancer Web server server Application Database server Backup server Storage server No failure Security Requirements
AVC 0,14 0,14 0,14 0,14 0,06 0,04 0,14 0,06 0,14 0
AVA 0,16 0,16 0,16 0,16 0,07 0,05 0,05 0,03 0,16 0
INC 0,03 0,03 0,2 0,2 0,09 0,03 0,2 0,02 0,2 0
INA 0,04 0,04 0,32 0,32 0,14 0,04 0,04 0,01 0,32 0
CB 0, 1 0,03 0,23 0,23 0,1 0,1 0,1 0,01 0,1 0
CP 0, 1 0,03 0,23 0,23 0,1 0,1 0,1 0,01 0,1 0
CC 0, 1 0,03 0,23 0,23 0,1 0,1 0,1 0,01 0,1 0
4.1.
The Impact Threats Classes Matrix
The following step in our model is to derive the impact threat classes matrix ie, the derivation of the set of threat classes that we wish to consider in our system. We applied our hybrid threat classification presented in previous work [7] on this case study to generate threat classes. In fact, we proposed in earlier work, [7] a dynamic and multidimensional threat classification model that allows better defining and articulating of threat characteristics. The model contains the following criteria:
Threat source: Origin of threat either internal or external.
Threat agents: Agents that cause threats that can be human, accidental environmental or technological. Security threat motivation: Goal of attackers on a system which can be malicious or non-malicious. Security threat intention: The intent of the human who caused the threat that is intentional or accidental.
malicious intentional threat (IHNMI), outsider human malicious accidental threat (OHMA), outsider human malicious intentional threat (OHMI), outsider human non malicious threat (OHNMA), outsider human non malicious intentional threat (OHNMI), environmental threat (EV), insider technological threat (IT) and outsider technological threat (OT).
Components in a system may fail to meet security requirements due to malicious activity when a threat class is materialized. The ICM matrix represents eleven columns, one for each threat class plus one for the absence of threats classes (NoC), and ten rows, one for each component plus one for the event that no component has failed during one period of time (NoF). The impact threats classes matrix is given in Table 3.
Table 3. Impact Threat Classes Matrix Threats classes
IHMA IHMI IHNMA IHNMI OHMA OHMI OHNMA OHNMI EV IT OT NoC Components
Brws 0,011 0,03 0,005 0,015 0,04 0,027 0,02 0,013 0,01 0,03 0,03 0,769 Prox 0,011 0,03 0,005 0,015 0,04 0,027 0,02 0,013 0,01 0,03 0,03 0,769 R/FW 0,011 0,03 0,005 0,015 0,04 0,027 0,02 0,013 0,01 0,03 0,03 0,769 LB 0,011 0,03 0,005 0,015 0,04 0,027 0,02 0,013 0,01 0,03 0,03 0,769 WS 0,011 0,03 0,005 0,015 0,04 0,027 0,02 0,013 0,01 0,03 0,03 0,769 AS 0,011 0,03 0,005 0,015 0,04 0,027 0,02 0,013 0,01 0,03 0,03 0,769 DBS 0,011 0,03 0,005 0,015 0,04 0,027 0,02 0,013 0,01 0,03 0,03 0,769 BS 0,011 0,03 0,005 0,015 0,04 0,027 0,02 0,013 0,01 0,03 0,03 0,769 SS 0,011 0,03 0,005 0,015 0,04 0,027 0,02 0,013 0,01 0,03 0,03 0,769 NoF 0 ,09 0,08 0,09 0 ,09 0,08 0,08 0,09 0,09 0,09 0,08 0,08 0,06
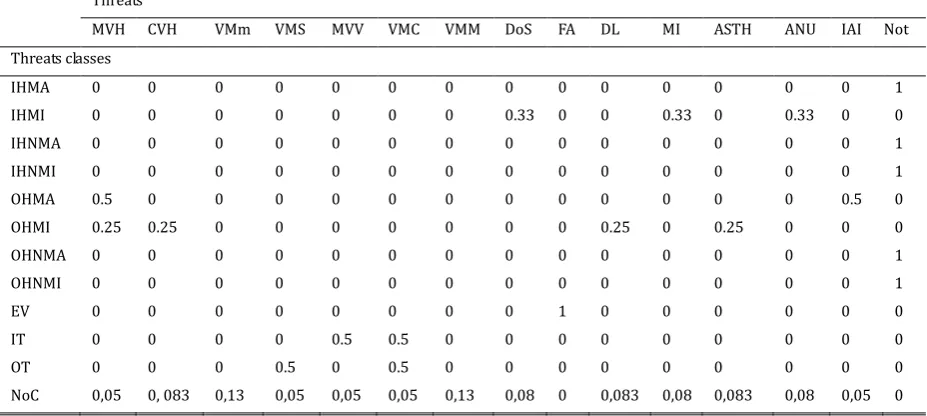
Table 4. Threat Classes Matrix Threats
MVH CVH VMm VMS MVV VMC VMM DoS FA DL MI ASTH ANU IAI Not Threats classes
IHMA 0 0 0 0 0 0 0 0 0 0 0 0 0 0 1
IHMI 0 0 0 0 0 0 0 0.33 0 0 0.33 0 0.33 0 0
IHNMA 0 0 0 0 0 0 0 0 0 0 0 0 0 0 1
IHNMI 0 0 0 0 0 0 0 0 0 0 0 0 0 0 1
OHMA 0.5 0 0 0 0 0 0 0 0 0 0 0 0 0.5 0
OHMI 0.25 0.25 0 0 0 0 0 0 0 0.25 0 0.25 0 0 0
OHNMA 0 0 0 0 0 0 0 0 0 0 0 0 0 0 1
OHNMI 0 0 0 0 0 0 0 0 0 0 0 0 0 0 1
EV 0 0 0 0 0 0 0 0 1 0 0 0 0 0 0
IT 0 0 0 0 0.5 0.5 0 0 0 0 0 0 0 0 0
OT 0 0 0 0.5 0 0.5 0 0 0 0 0 0 0 0 0
NoC 0,05 0, 083 0,13 0,05 0,05 0,05 0,13 0,08 0 0,083 0,08 0,083 0,08 0,05 0
4.2.
The Threat Classes Matrix
materialized: f a class defines n threats, then this is 1/n and 0 if it is outside.
The different possibilities of attacks that can exploit the weaknesses of this case study are presented in Table 5.
Table 5. Threat Vector
Threats Probability
Monitoring virtual machines from host (MVM) 8,063 10-4
Communications between virtual machines and host (CBVH) 8,063 10-4
Virtual Machine modification (VMm) 8,063 10-4
Placement of malicious VM images on physical systems (VMS) 8,063 10-4
Monitoring VMs from other VM (VMM) 40,31 10-4
Communication between VMs (VMC) 40,31 10-4
Virtual machine mobility (VMM) 40,31 10-4
Denial of service (DoS) 14,39 10-4
Flooding attacks (FA) 56,44 10-4
Data loss or leakage (DL) 5,75 10-4
Malicious insiders (MI) 6,623 10-4
Account, service and traffic hijacking (ASTH) 17,277 10-4
Abuse and nefarious use of cloud computing (ANU) 17,277 10-4
Insecure application programming interfaces (IAI) 29,026 10-4
No Threats (NoT) 0,9682
We have catalogued fourteen distinct types of threats and eleven threat classes. To compute the MFC Extension (MFCE), we need to know the probability of the attack class for each threat during one hour (see Table 3). We need also to fill the values in Table 4 and the threat vector values (see Table 5), which comes from an empirical study [18].
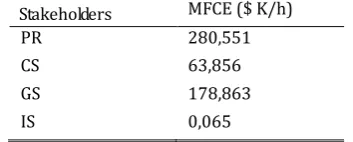
Using the 4 Matrices (Stakes, Dependency, Impact threat classes and Threat classes) and the threat classes vector we can compute the vector of mean failure costs Extension (see Table 6) for each stakeholder of Cloud Computing system using formula 2.
Table 6. Stakeholder Mean Failure Cost Extension
Stakeholders MFCE ($ K/h)
PR 280,551
CS 63,856
GS 178,863
IS 0,065
5.
Validation of the MFCE Model
System stakeholders seek secure information systems to reduce cost and protect their assets from damage and the confidentiality, availability and the integrity of information. To help stakeholders, the MFC metric gives a quantitative value of security system without any qualification of it that is the security quantification did not allow deciding whether the system is secured or not. The question for all stakeholders is that the system is secure or not?
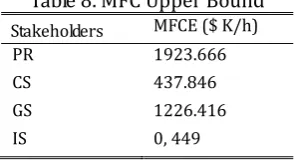
Therefore, we say that a system is secure if its MFC is lower than the average between the upper bound and the lower bound that is if the MFC<([Blow+Bupp]/2) and the system is not secure if MFC>([Blow+Bupp]/2). Finally, we proceed to the classification of our MFCE vector either it is secure or not.
Table 7: MFC Lower Bound
Stakeholders MFCE ($ K/h)
PR 8.018
CS 1.824
GS 5.111
IS 0, 001
Table 8. MFC Upper Bound
Stakeholders MFCE ($ K/h)
PR 1923.666
CS 437.846
GS 1226.416
IS 0, 449
Assuming that the system is secure, the probabilities of failure of system components are low see null. For this goal, we modify the matrix IM in this way: we put 0 for lines, 1 at the last column and the last line is made complementary to the columns and the equilibrium of the line. For an unsecured system, we make the reverse of founded bounds. We compute, finally, the lower bound vector of mean failure costs and the upper bound vector of MFC as shown in Tables 7 and 8.
To validate our MFC Extension vector (MFCE) presented in Table 6 for Cloud Computing system, we propose to evaluate the stakeholders’ security costs in order to decide if this system is secure or not. As we notice that the MFC values for Cloud Computing system are lower the average of the MFC bounds for each stakeholder presented in Tables 7 and 8, so we can say that the considered information system is a secure system.
In addition to this contribution in the application of MFC model, we can say that the new model satisfies the Bayesian formula. Furthermore, in certain level of Cloud Computing services like the Infrastructure As A Service layer (IaaS), it is very difficult to specify a threat in a system component because we can find a large number of components, in this layer, so it can be better to associate for each component a class of threats rather than a specific threat. Indeed, as countermeasures, one solution will solve several problems rather one problem.
6.
Conclusion
Information security is a critical problem for individuals and organizations because it leads to great financial losses. This work dealt with quantitative security risk analysis problem in order to propose a quantitative security metrics that estimates security cost breaches. We propose, in this paper, a cyber security metric based on threats classifications model to well estimate security breaches. We have also illustrated the use of this metric (MFC Extension (MFCE)), on a cloud computing system. This quantitative model enables system’s stakeholders to quantify the risks they take with the security of their assets and to make security related decisions on the basis of quantitative analysis. In fact, we propose to qualify security breaches costs that are we suggest a cost interval to classify the security quantification for information system to decide whether the system is secure or not.
We develop a cyber security metric as a decision making technique to derive relevant decision making security solutions. This quantitative decision making metric allows selecting countermeasures per threats class rather than a threat to better studying and identify security threats.
References
Proceedings of 8th IEEE World Congress on Services.
[3] Richardson, R. (2008). CSI/FBI Computer Crime and Security Survey. Computer Security Institute, San Francisco.
[4] Gordon, L. A., Loeb, M. P., & Lucyshyn, W. (2010). CSI/FBI Computer Crime and Security Survey. Computer Security Institute, San Francisco.
[5] Shiu, S., Baldwin, A., Beres, Y., Mont, M. C., & Duggan, G. (2011). Economic methods and decision making by security professionals. Proceedings of The Tenth Workshop on the Economics of Information Security (WEIS).
[6] Sun, L., Srivastava, R. P., & Mock, T. J. (2011). An information systems security risk assessment model under the dempster/shafer theory of belief functions. Journal of Management Information Systems,
22(4), 109–142.
[7] Jouini, M., Ben A. A., et al. (2014). Classification of security threats in information systems. Proceedings of ANT/SEIT (pp. 489–496).
[8] Sangroya, A., Kumar, S., Dhok, J., & Varma, V. (2010). Towards analyzing data security risks in cloud computing environments. Proceedings of International Conferenceon Information Systems, Technology, and Management. Bangkok, Thailand.
[9] Hale, M., & Gamble, R. (2012). SecAgreement: Advancing security risk calculations in cloud services.
Proceedings of 8th IEEEWorld Congress on Services.
[10]Saripalli, P., & Walters, B. (2009). QUIRC: A quantitative impact and risk assessment framework for cloud security. Proceedings of the IEEE 3rdInternational Conference on Cloud Computing (pp. 280–288).
[11]The Center for Internet Security (CIS). (2009). The CIS Security Metrics v1.0.0.
[12]Ben, A. A., Abercrombie, R. K., Sheldon, F. T., & Mili, A. (2010). Quantifying security threats and their potential impact: A case study. Innovation in Systems and Software Engineering, 6(4), 269–281.
[13]Ben, A. R., Mili, A., et al. (2013). A cybersecurity model in cloud computing environments. Journal of King Saud University–Computer and Information Sciences, 25(1), 63–75.
[14]Jouini, M., Ben, A. R., Ben, A. A., & Mili, A. (2012). Towards quantitative measures of Information Security: A Cloud Computing case study. International Journal of Cyber-Security and Digital Forensics (IJCSDF), 1(3), 265–279.
[15]Jouini, M., Mili, A., et al. (2012). An economic model of security threats for cloud computing systems.
Proceedings of International Conference on Cyber Security, Cyber Warfare and Digital Forensic (CyberSec) (pp. 100–105).
[16]Mohammed, A., Abdullah, A., Phu, D., & Bala, S. (2010). Information security threats classification pyramid. Proceedings of IEEE 24th International conference on Advanced Information Networking and Applications Workshops (WAINA) (pp. 208–213).
[17]Sandro, G., & Zeljko, H. (2007). Information system security threats classifications. Journal of Information and Organizational Sciences, 31(1), 51-61.
[18]Ben, A. A., (2012). Vers une mesure économétrique de la sécurité des systèmes informatiques’. Doctoral dissertation, Faculty of Sciences of Tunis, University of Compus El Manar, Tunis, Tunisia.
and security measurement and quantification. She has published. She has participated in several international conferences including topics related to the computer science, cloud computing, cyber security.