Spatial Distribution of Non-point Source Pollution in
Vembanad Lake
Kichu Paul, Binoy Alias M. & Shiny Varghese
Department of Civil EngineeringM.A. College Of Engineering Kothamangalam, Kerala
Abstract—The Vembanad Lake, the largest backwater system on the southwest coast of India, is subjected to indiscriminate exploitation beyond its supportive capacity. This is a study conducted to assess the status of the non point source pollution distribution of the Vembanad lake using Geographical Information System (GIS). Water qualities, such as acidity, alkanity, Hardness, Chloride, COD, Total Solids, Iron and Sulphate were determined for water samples collected from 35 representative sites of known latitude and longitude for both wet season and dry season. An open source GIS, QGIS, is used to analyse the spatial distribution of these parameters. The analysis indicates Iron, acidity and COD in the wet season and dry season have not undergone significant change. But the values of alkalinity, hardness, chlorine and sulphate have undergone dramatic change. These values have been graphically plotted using GIS interface.
Keywords-Vembanad, water quality, GIS (key words)
I.
I
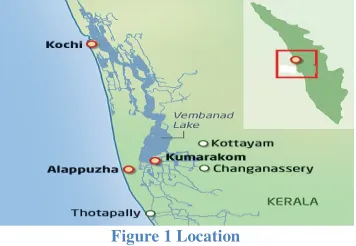
NTRODUCTIONKerala has a continuous chain of lagoons or backwaters along its coastal region. These water bodies are fed by rivers and drain into the Lakshadweep Sea through small openings in the sandbars called ‘azhi’, if permanent or ‘pozhi’, if temporary. The Vembanad wetland system (Figure1) and its associated drainage basins lie in the humid tropical region between 09˚00’ -10˚40’N and 76˚00’-77˚30’E. It is unique in terms of physiography, geology, climate, hydrology, land use and flora and fauna. The rivers are generally short, steep, fast flowing and monsoon fed. The Vembanad wetland system includes the
Vembanad backwater, the deltaic lower reaches of the rivers draining into it and the adjoining Kol lands. The Vembanad Lake is bordered by Alappuzha (Alleppey), Kottayam and Ernakulam districts of Kerala covering an area of about 200 sq km and extending 80 km in a NW-SE direction from Munambam in the north to Alleppey in the south. The width of the lake varies from 500 m to 4 km and the depth from <1m to 12m. Manimala, Meenachil, Pamba and Achenkovil flow into the lake south of Thanneermukkom and Muvattupuzha river flows into the Cochin backwaters north of Thanneermukkom
Considering the fragile ecosystem of the wetland, deterioration of water quality and consequent damage to
aquatic organisms and the shrinkage of Vembanad Lake, this wetland system was included in the National Lake Conservation Programme (NLCP) by the National River Conservation Authority, chaired by the Hon’ble Prime Minister under the Ministry of Environment and Forests (MoEF). Under the NLCP, projects of conservation and management of polluted lakes are taken up on 70:30 cost sharing between the Central and State Governments as in the case of river action plans.
Point source pollution, on the most basic level, is water pollution that comes from a single, discrete place. The term "point source" means any discernible, confined and discrete conveyance, including but not limited to any pipe, ditch, channel, tunnel, conduit, well, discrete fissure, container, rolling stock, concentrated animal feeding operation, or vessel or other floating craft, from which pollutants are or may be discharged. This term does not include agricultural storm water discharges and return flows from irrigated agriculture.
Diffuse water pollution is mainly related to the way we use and manage land and soil. It can affect rivers, lakes, coastal waters and ground waters. Ground waters are vulnerable from, and can be affected by, pollutants that leach from the land surface and from areas of contaminated land. Surface waters are affected by rainfall that washes over and off the land (run-off).Rivers can also be influenced by springs and seepages from groundwater
that contribute to their flow. If the groundwater connection with surface waters is high, pollution can pass from one to affect the other. Run-off has increased as agriculture has intensified and as we have built more roads and houses. This often happens where we have degraded the natural permeability of the landscape and reduced its capacity to retain water.
Unlike point source pollution, we cannot easily control diffuse pollution by issuing licenses or permits. Regulatory approaches have to be more subtle and in many cases need to be well connected to the land use planning system
.
II.
S
TATE OF THE
A
RT
The Vembanad Lake has been subjected to various environmental studies by different agencies. The water quality study conducted by Binu & Harikumar1made an assessment on Eutrophication of this lake using Dynamic Model. This study was aiming at point source pollutions. Vincy et.al.2conducted a water quality assessment of the Vembanad Lake with reference to backwater tourism. This study indicates the degradation or decline of water quality especially acidity, alkalinity, salinity, hardness, DO etc. Another detailed study conducted by Nazir3 indicates the degradation of water quality and higher spread of the non source point pollution. Balachandran4
indicates the progressive deterioration of many of the Indian estuaries including Vembanad Lake caused by anthropogenic activities is of concern because these areas have never been considered as primary targets of conservation. Abhirosh et.al5 increased prevalence of indicator and pathogenic bacteria in Vembanadu Lake. Prevalence of faecal indicator bacteria, Escherichia coli and pathogenic bacteria, Vibrio cholerae, Vibrio parahaemolyticus and Salmonella were analyzed in Vembanadu lake.
The objective of this study was to determine the spatial distribution of the various pollutants across the Vembanad Lake. The scope of the study covers the following
Identification of the polluted zones in Vembanad lake.
Policy development to mitigate the pollution due to various sources on the lake.
Development of strategies for eco restoration.
Facilitation of the government for maintaining bio diversity of lake.
III.
METHODOLOGY
The Vembanad wetland system and its associated drainage basins lie in the humid tropical region between 09˚00’ -10˚40’N and 76˚00’-77˚30’E. It is unique in terms of physiography, geology, climate, hydrology, land use and flora and fauna. The rivers are generally short, steep, fast flowing and monsoon fed. The Vembanad wetland system includes the Vembanad backwater, the deltaic lower reaches of the rivers draining into it and the adjoining Kol lands. The Vembanad Lake is bordered by Alappuzha (Alleppey), Kottayam and Ernakulam districts of Kerala covering an area of about 200 sq km and extending 80 km in a NW-SE direction from Munambam in the north to Alleppey in the south.
Analysis of water quality was done both spatially and temporally. 35 representative sites were taken into consideration for a statistically robust analysis. These sites were located between 9° 32’ 1.03” N - 76° 22’ 2.28” E and 9° 40’ 27.99” N - 76° 25’ 0.4” E. These sites were chosen taking into consideration the various ecological and human effect that were observed as probable pollution causes, including areas adjacent to resorts and other tourism hotspots; commercial areas such as boat jetties and residential areas such as the R- Block, etc.
The geographical spread of lake can be collected from various sources like toposheets, survey map of India etc. The water samples are collected from the pre-determined sites of the lake. To determine temporal variation the water samples are collected in two seasons, pre monsoon season and post monsoon season.
WATER QUALITY PARAMETERS
For the analysis of the water sample collected, following tests were conducted according to IS specifications.
1. Acidity
2. Alkalinity
3. Hardness
4. Chloride
6. Total Solids
7. Iron
8. Sulphate
Temporal Variation
The analysis of water quality from the representative sites were done in two seasons, namely, the wet season (Oct-Nov) and the dry season (Jan-Feb). Water quality was checked across 10 parameters, namely, acidity, hardness, alkalinity, sulphates, chlorides, pH, iron, turbidity, solids and COD. These parameters were chosen taking into consideration the type of occupations around the lake and the probable pollution causing agents associated with it. For example, hardness was chosen as a parameter because of the high number of residential and tourism settlements around the lake which discharge untreated soap water into the lake. All the water quality tests were conducted as per Indian Standards.
Another important factor affecting the variation of results in the two seasons was the Thaneermukkam Bund. In the wet season, the bund was open to let flow through to the other side and in the dry season, the bund was closed which reduced the flow of water. Moreover, the level of water in the dry season was very low compared to the wet season.
Spatial Variation
The analysis of water quality was done in 35 representative sites. The above mentioned 10 parameters were analyzed and tests were done similarly as per Indian Standards. The parameters varied with reference to space and this variation can be analyzed with the help of GIS.
GIS (Geographic Information System)
A Geographical Information System (GIS) is a collection of soft-ware that allows you to create, visualize, query and analyze geospatial data. Geospatial data refers to information about the geographic location of an entity. This often involves the use of a geographic coordinate, like a latitude or longitude value. Some typical types of analysis include computing:
1. Distances between geographic locations
2. The amount of area (e.g., square meters) within a certain geographic region
3. What geographic features overlap other features
4. The amount of overlap between features
5. The number of locations within a certain distance of another
The results of analysis may be shown on a map, but are often tabulated into a report to support management decisions.
QGIS 1.8.0 (Quantum GIS)
Quantum GIS (often abbreviated QGIS) is a cross-platform free and open source desktop geographic information systems (GIS) application that provides data viewing, editing and analysis capabilities. It helps to create, edit and export spatial data using digitized tools for vector features, field and raster calculator, georeferencer plug in.
IV.
FIELD
STUDY
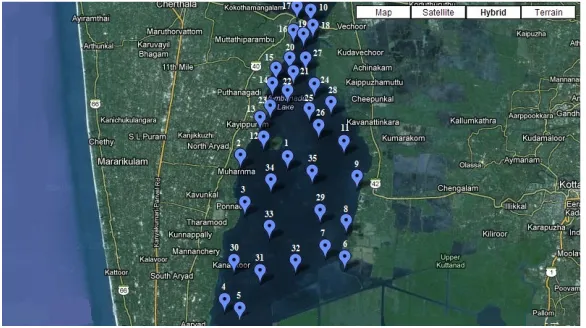
Reconnaissance survey was done on to identify the 35 randomly located critical points (Figure 2). Sample collection for the wet season was conducted. 5 litres of each sample was collected in air-tight containers and shifted to the laboratory within 24 hours. Tests for total acidity, total alkalinity, hardness, chloride, solids, turbidity, sulphate, iron, COD and pH were conducted according to Indian Standard methods.
Vembanad lake is selected for study because large area of water body is being polluted. To find the maximum possible variation in pollutant 35 locations were selected.
Figure 2 Sampling Sites
V.
R
ESULTA
NALYSISThe water quality parameters for the 35 sites mentioned above are analysed . The major observations are given below.
Acidity: Acidity of water is its quantitative capacity to neutralize a strong base to a designated pH. Strong mineral acids, weak acids such as carbonic and acetic acid and hydrolysing salt such as ferrous or aluminium sulphate contributes to the measured acidity. Figure 3 shows the spatial distribution of acidity. The figure
indicates that there is only a slight increase in the value of acidity from wet season to dry season.
Alkalinity: The alkalinity of water is its capacity to neutralize acids. Alkalinity of water is a measure of weak acid present in it and of the cations balanced against them. Total alkalinity of water is due to presence of mineral salt present in it. It is primarily caused by the carbonate and bicarbonate ions. Figure 4 shows the spatial distribution of alkalinity. The figure indicates that there is a decrease in the value of alkalinity in dry season compared to that of wet season.
Chlorides: Chlorides in the form of Cl- ions is one of the major anions in water. Waters having 250 mg/L chloride may have a salty taste if the cation is sodium. On the other hand, the typical salty taste may be absent even in water containing as much as 1000 mg/L chloride, if the predominant cations are Ca and Mg. As per Indian Standards, the desirable limit of chloride is 250 mg/L. However, the Chloride levels at all 35 stations are below the desirable limit for the wet season. But the values for the dry season are very high.
COD: As per Indian standards the COD value of the effluent discharged into the inland waters should not exceed a permissible value of 250mg/l. Figure 6 shows the spatial distribution of COD, and the COD levels at 35 stations are below the desirable limits in both seasons. But for the dry season the COD values are comparatively higher.
Hardness: Total hardness is the parameter of water quality used to describe the effect of dissolved minerals (mostly Ca and Mg), determining suitability of water for domestic, industrial and drinking purpose attributed to presence of bicarbonates, sulphates, chloride and nitrates of calcium and magnesium. As per Indian Standards, the desirable limit of hardness for drinking purpose is 300 mg/L. The hardness levels at all 35 stations are below the desirable limits for the wet season. But for the dry season the hardness values are comparatively higher.
Figure 3 Acidity Wet Season (mg/l) Figure 3 Acidity Dry Season (mg/l)
Figure 4 Alkalinity Wet Season (mg/l) Figure 4 Alkalinity Dry Season (mg/l)
Sulphate: According to Indian Standards the permissible limit of sulphate in drinking water is 200 mg/L. The concentration of sulphate for the wet season is low. But the concentration in the dry season is abruptly higher.
Total solids: According to Indian Standards the permissible limit of total solids in inland surface water is 2200 mg/L. None of the samples in wet season crossed the permissible limit, but during dry season most of the samples crossed the permissible limit of total solids.
VI.
CONCLUSION
Analysis of water was done from 35 undefined points to assess diffuse pollution characteristics. From the analysis of the results, it can be concluded that the parameters- Iron, acidity and COD in the wet season and dry season have not undergone significant change. But the values of alkalinity, hardness, chlorine and sulphate have undergone dramatic change. These values have been graphically plotted using GIS interface. The variation of the parameters throughout the 35 stations was spatially analyzed.
concentrations. Also, the dry season was the tourism season which saw increased number of houseboats on the lake and increased outflow of wastes from these boats and resorts into the lake.
The spatial distribution of the parameters was carried out in the GIS software and the spatial variation of different parameters across the lake and across the two seasons could be analyzed. These analysis results were used for obtaining the relatively higher polluted areas and can help to adopt measures in future.
VII. REFERENCES
[1] Bindu K.R. and Harikumar P.S., Centre for Water Resources Development and Management
[2] Vincy M.V., Brilliant Rajan and Pradeep Kumar A. P. International Research Journal of Environment Sciences Vol. 1(5), 62-68, December (2012)
[3] Nasir P. Thesis Calicut university
[4] K.K Balachandran “Ecosystem modeling of Vembanadu lake”