Int. J. of Engg. Sci. & Mgmt. (IJESM), Vol. 4, Issue 3: July-September: 2014, 14-20
INTERNATIONAL JOURNAL OF ENGINEERING SCIENCES &
MANAGEMENT
A STUDY OPTIMIZATION OF WEARS ANALYSIS OF FORGING DIES
Ranjeet Kumar
1, Dr. Pushpendra Kumar Sharma
2, Prof. Suneel Kumar Shukla
3 1, 2, 3Mechanical Engineering Department, NRI Institute of Science and Technology, Bhopal
(M.P.) India
ABSTRACT
The service lives of dies in forging processes limited by wear, fatigue fracture and plastic deformation, etc. in hot forging processes, wear is the predominant factor in the operating lives of dies. In this study, the wear analysis of a closed die hot forging process has been realized. This study aims to reduce die wear. As part of these initiative guidelines has been developed for
a) Die design under hot and warm forging Conditions, and b) Selection of optimum lubrication systems for increased die life.
INTRODUCTION
Among all manufacturing processes, forging technology has a special place because it helps to produce parts of superior mechanical properties with minimum waste of material. In forging, the starting material has a relatively simple geometry; this material is plastically deformed in one or more operations into a product of relatively complex configuration. Forging usually requires relatively expensive tooling. Thus, the process is economically attractive when a large number of parts must be produced and or when the mechanical properties required in the finished product can be obtained only by a forging process. [1]
Die costs can constitute up to 30% of the production cost of a part and also affect its profitability directly (die manufacturing cost) and indirectly (repair, press downtime, scrap, rework etc). Hot and warm forging processes subject the dies to severe thermal and mechanical fatigue due to high pressure and heat transfer between the dies and the workpiece. High cyclic surface temperatures result in thermal softening of the surface layers of the dies, subsequently increasing die wear and susceptibility to heat checking. [2]
In forging process the service life of dies is very important due to economical reasons and also
finishing quality of productions. The factors influencing die life are thermal fatigue, plastic deformation, wear, etc. Amongst these, wear is the Predominating factor in hot forging process. Lange reported that wear is the dominating failure mechanism for forging dies, being responsible for approximately 70% of failures. [3]
CLASSIFICATION OF WEAR
Int. J. of Engg. Sci. & Mgmt. (IJESM), Vol. 4, Issue 3: July-September: 2014, 14-20
Table1. Distinction between mild and sever wear[4]
Mild wear Severe Wear
Results are extremely smooth
Results in rough, deeply torn
Surfaces- often smoother than original
Surfaces- much rougher than the original
Debris extremely small. Typically only Large metallic wear debris, typically up to
100 nm diameter
Large metallic wear debris, typically up to 100 nm diameter 0.01 mm diameter
High electrical contact resistance, little true metallic contact
Low contact resistance, true metallic junctions formed
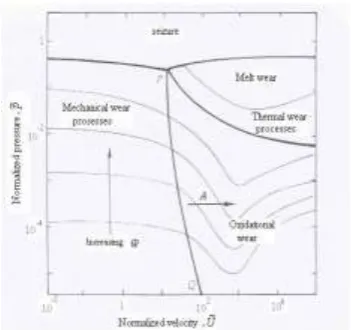
One way of exploring wear broad pattern, and of indicating the way in which changes in the service conditions can influence the material wear response, is to construct an appropriate map of wear behaviour. Two approaches are possible, one is empirical: mechanism maps are built up by plotting experimental data for wear rates on suitable axes, identifying at each point the mechanism by direct experimental observation. The other uses physical modelling: model-based equations describing the wear rate for each mechanism are combined to give a map showing the total rate and the field of operation within which each is dominant. An immediate difficulty is the choice of the most appropriate coordinate axes on which to display the chosen data. The general form of such a map is illustrated in Figure 1, and various regimes of wear are identified [5].
Fig. 1 Wear map for steel using a pin-on disc Configuration [6]
Figure 2.1 shows the essential features of a load-speed wear map for steel using a pin-on disc configuration. Load and speed have both been normalized. Thick lines delineate different wear mechanisms and thin lines are contours of equal w.
Mechanisms of Wear
1. Seizure: When metal surfaces are brought into contact the real area over which they touch is a comparatively small fraction of the nominal contact area. The high normal pressure generated at these asperity contacts forge metallic junctions which, when they are sheared by the application of a load tangential to the interface, can grow until actual area of metallic contact approaches the nominal area; this is the phenomenon of ‘junction growth’. The
behavior of an individual asperity contact can be described by a relationship of the form. [5]
P2
In this equation P is the normal pressure at the
Int. J. of Engg. Sci. & Mgmt. (IJESM), Vol. 4, Issue 3: July-September: 2014, 14-20
2. Melt Wear: Localized melting of the uppermostlayer of the wearing solid is always a possibility; evidence for its occurrence has been found in wear tests on steels even at sliding speeds as low as 1 m/sec [5]. At higher velocities the coefficient of friction can drop, eventually to very low values, as a film of liquid metal forms at the interface which acts in the same way as a hydrodynamic lubricating film. The heat generated by viscous work in such a ‘melt lubrication’ situation continues to melt more solid so
that the wear rate can be high despite the fact that the
coefficient of friction is low. The metal removed from the surface can be ejected as sparks or incandescent debris, or even in extreme cases, squirted out as a molten stream. This leads an Equation of the form [5].
3. Oxidation-dominated Wear: Figure 1.1 includes a large region at higher speeds designated ‘oxidational wear’. The existence and extent of this regime, and
the wear rates within it, are dependent on the ability of the wearing material to undergo oxidation and, equally of course, on the availability of oxygen in the immediate vicinity of the sliding contact. When dry steel surface slide at speeds below about 1 m/s the wear debris is largely metallic; at higher speeds it consists mainly of iron oxides [7]. A velocity of 1 m/s (which translates to a normalized velocity value of about 100) is just sufficient to give flash temperatures Tflash sufficient to cause oxidation, that is, of about 700 oC. The value of Tflash is strongly dependent on velocity but varies hardly at all with load, hence the near verticality of the boundary PQ in Figure 2.1. The presence of an oxide film at the interface may be sufficient to reduce the wear rate merely by its role of suppressing or at least reducing, the degree of the mechanical interaction. Close to the line PQ the oxide film is thin, patchy, and brittle, and wear is caused largely by its splitting off form the surface.
This spalling away exposes more metal which rapidly oxidizes once again. This regime known as mild oxidational wear which is of the form [8] 4. Mechanical Wear Processes: At normalized velocities below about 10 (equivalent in the case of steels to actual velocities less than 0.1 m/s) surface heating is negligible; the effect of the frictional force is principally to deform the metal surface, shearing it in the sliding direction and ultimately causing the removal of material usually in the form of small particles of wear debris. In this regime the wear behavior often follows the archard [9] equation W= k x (FN / H)
where, FN is normal load on contact interface (N).
(a)Running-in: When mass produced lubricated machine components are run together for the first time their ultimate load-carrying capacity is often very much less than would be the case if they had been preconditioned by running together for an initial period at a comparatively light load. This process, during which they improve in conformity, topography, and frictional compatibility, is known as running-in.
Fig.2 Typical wear behaviour over the life of a component [6]
Int. J. of Engg. Sci. & Mgmt. (IJESM), Vol. 4, Issue 3: July-September: 2014, 14-20
simultaneously. Once running-in is complete thesteady low-wear-rate regime is maintained for the operational life of the component; the wear rate rises again once the operating time becomes sufficiently long for fatigue processes in the upper layer of the loaded surface to start making a significant contribution to material loss driven by the cyclic nature of the component loading.
(b) Adhesive Wear: Models of adhesive wear have a long pedigree-they are all based on the notion that touching asperities adhere together and that plastic shearing of the junctions so formed ‘plucks’ off the
tips of the softer asperities leaving them adhering to the harder surface. Subsequently these tips can become detached giving rise to wear particles or fragments. Sever damage of this type can result in the tearing of macroscopic chunk of material from the surface and this situation is sometimes known as galling. It can be a particular problem when both members of the tribological contact are made of the same sort of material (e.g. both of ferrous alloy) or when there is poor lubrication and temperature or sliding speeds are high. The term scuffing is used specially to describe the onset of adhesive wear between lubricated surfaces which has arisen from the break down or failure of the lubricant film for whatever reason.
Even at first sight this would seem to be a relatively rare event, since the original contacting interface is likely to have both the smallest cross sectional area and the highest density of defects, and so represents the path of lest resistance[6]. However, on occasion, particularly if the asperities interact so that the plane AB in inclined to the sliding direction, a transferred particle can be formed. archard model is formed as: W= Kadh X (FN/H)
Where W is volume of wear per sliding distance (mm3/mm), K
adh is non-dimensional adhesive wear coefficient, FN is normal contact load (N) and H is hardness (Pa).
(C)Abrasive Wear: Abrasive wear is damage to a component surface which arises because of the motion relative to that surface of either harder asperities or perhaps hard particles trapped at the interface. Such hard particles may have been introduced between the two softer surface as a contaminant from the outside environment, or they may have been formed in situ by oxidation or some other chemical or mechanical process. On the other hand, abrasion may take place simply because the counter face is both rough and essentially harder than the wearing component. If wear depends on the presence of free particles the situation is known as three-body abrasion; if the wear producing agent is the hard counter face itself we have two-body abrasion.
Abrasive wear gives a characteristic surface topography consisting of long parallel grooves running in the rubbing direction. The volume and size of the grooves varies considerably from light ‘scratching’ at one extreme to severe ‘gouging’ at
the other and industrial surveys invariably indicate that abrasive wear account for up to about 50 percent of wear problems.
Abrasive wear in practice can often be described by an equation of the same form as archard wear equation:
W = Kabr x (FN/ H)
Where Kabr is non-dimensional abrasive wear coefficient. The volumetric loss of material in a given situation is proportional to the distance slid and the intensity of the loading. If we define the abrasive wear resistance of a material as simply the inverse of the wear volume we should expect this quantity to be proportional to the hardness H. the classical experiments confirmation of this effect was carried out in many experimental observations (Kruschov [10]) since 1950’s.
Int. J. of Engg. Sci. & Mgmt. (IJESM), Vol. 4, Issue 3: July-September: 2014, 14-20
process, more accurate prediction can be done fordie life during design of die.
A .Material Properties: There are the forging specific material models available for either cold forging or hot forging operations in the material library of the software. MSC. Super Forge provides elastic-plastic models for work piece material, for dies rigid-plastic models are used. In this study the work piece material is X20Cr13 (DIN 1.4021), Heat Resisting Stainless steel. Figure 3 shows the workpiece stress-strain curve at a constant temperature of 1100 oC for three different strain rates [11].
The die material is alloy tool steel AISI L6, Plasticity model for this material is as below [11]
Fig. 3 Work piece material stress-strain curve at 1100 o C and different strain rates [11].
max[
Y
,
C
.
N] (4.1)
Where: Y: Y: Minimum Yield Stress: 645 MPa C: Yield Constant: 1.1735 GPa N: Strain Hard Exp.: 0.128 Initial Temperatures:
The initial temperatures of workpiece and dies have great effect on the simulation of hot forging process as they influence the plastic behaviour of materials. In industry, the dies are generally preheated before using in hot forging process. The initial temperatures in this study are
Initial temperature of workpiece: 1100 oC Initial temperature of die: 300 oC
Other parameters that used for the simulation are 1. Heat transfer coefficient to ambient:
50 watt/m2.K 2. Heat transfer coefficient to workpiece:
6000t/m2.K 3. Emissivity for heat radiation to ambient: 0.25 Friction Model:
τ = σn. µ
Where, µ is the coefficient of friction and σn denotes
the normal stress at the workpiece-die interface. As the workpiece and the die have rough surfaces and are forced to move tangentially with respect to one another, frictional stresses will develop at the interface. Therefore, a friction model should be applied to both of the dies. For forging operations involving relatively low contact pressure between dry contact surfaces, the Coulomb’s friction model
is most appropriate [11]. If the frictional shear stress reaches a critical value, the workpiece will slip along the die. According to Coulomb’s law of
friction, this value is given by:
Assigning Simulation Type and Parameters
Int. J. of Engg. Sci. & Mgmt. (IJESM), Vol. 4, Issue 3: July-September: 2014, 14-20
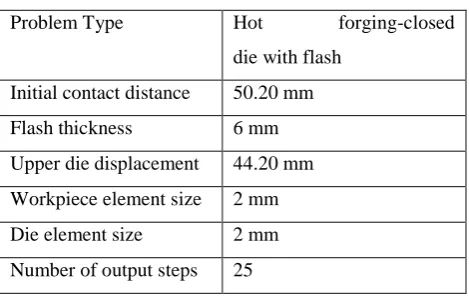
Table 2 Operation parameters assigned tocomplete the simulation.
Problem Type Hot forging-closed die with flash
Initial contact distance 50.20 mm
Flash thickness 6 mm
Upper die displacement 44.20 mm Workpiece element size 2 mm
Die element size 2 mm Number of output steps 25
Recent Studies of Hot Forging Die Wear Analysis Several researches have been done on wear phenomenon of hot forging operation including the wear model and, wear prediction, wear reduction, etc.
In hot forging process main appearance of wear is due to mechanical wear mechanism. Conditions like high pressure (close to hardness of die material), high sliding velocity (over 1 m/sec) and flash temperature (over 700oC) that cause other wear mechanisms such as melt wear and oxidation wear, hardly appears during operation, although oxidation wear may appear on flash land due to high sliding velocity. Then mechanical wear mechanism seems to be appropriate for hot forging operations wear analysis. General archard’s [9] wear model has been applied to predict die wear in most of hot forging process studies. The amounts of wear, as explained, are proportional to the wear coefficient between the die and the workpiece, the surface pressure of the die, the relative length movement between the die and the workpiece and inverse to the hardness of the die. The surface pressure and relative sliding length can be obtained from computer simulation using commercial codes. Hardness of die material in operation conditions can be found from metal hand books, in special cases like high temperature or different heat treatments, hardness test can be done for better results. The non-dimensional wear
coefficient is introduced to provide agreement between theory and experiment, it has great influence on result of wear, its value changes for different materials in contact and different conditions (Table.2.3) therefore it is not possible to offer a certain value of wear coefficient for different contact problems.
Table 3 Typical values of dimensionless wear coefficients for various materials against tool steel sliding in dry, unlubricated pin-on-disc tests
in air [9].
The most used method for obtaining wear coefficient is pin-on-disk or ring-on-disk tests, by knowing sliding length, material properties, normal contact pressure and volume of material lost, wear coefficient can be calculated in form of
K= ∆V. H / L.FN
Where, K is non-dimensional wear coefficient, ∆V is measured wear volume (mm3) and L is the sliding length (mm).
CONCLUSION
Warm and hot forging processes subject the dies to extreme temperatures due to heat transfer between the dies and workpiece. The thermal cycling of the die surface causes softening in the surface layers of the die, which decreases wear resistance. The dies also experience mechanical fatigue because of high pressures at the die-workpiece interface. In forward extrusions, a large reduction in cross section of the
Material K
Mild steel (on mild steel) 7
PTFE
Copper-beryllium
Hard tool steel
Ferritic stainless steel Polythene
Int. J. of Engg. Sci. & Mgmt. (IJESM), Vol. 4, Issue 3: July-September: 2014, 14-20
workpiece substantially increases the velocity atwhich the material is flowing. This velocity, in conjunction with the pressure at which the material flows, affects the wear rate of the material. The following focus areas were selected to be emphasized:
1. Determination of interface conditions of the extrusion process during start up and steady state conditions.
2. Selection and comparison of alternative die materials to extend die life under the
current process conditions. 3. Prediction and estimation of die wear using
existing wear models and FEM solutions. The results of this study are obtained through a combination of computer simulations and validation from production trials.
REFERENCES
[1] T. Altan, G. Ngaile and G. Shen, “Cold and Hot
Forging – Fundamentals and Applications”, March
2004.
[2] T. Altan, advanced die materials and lubrication
systems to reduce die wear in hot and warm forging
[3] L. Cser, M. Geiger, K. Lange, “Tool life and tool quality in bulk metal forming”, Proc. Inst.
Mech. Eng. 207 (1993) 223-239.
[4] “Metals Handbook – Forging and Casting”,
Vol. 5, 8th Edition, ASM Handbook Committee,
USA, 1971.
[5] S. C. Lim, M. F. Ashby, “Wear mechanism maps”, Acta Metallurgica, 35(1), 1-24, 1987.
[6] J.A. Williams, Engineering Tribology, Oxford
Univey Press, ISBN 0 19 856503 8, 1998
[7] K. Nakajima and Y. Mizutani, “structural
change of the surface layer of low carbon steels due
to abrading”, Wear 13, 283, 1969.
[8] T. F. J. Quinn, J.L. Sullivan and D. M. Rowson,
“Origins and development of oxidational wear at low ambient temperature”, Wear 94, 175, 1984. [9] J.F. Archard, “Contact and rubbing of flat surfaces”, J. Appl. Phys. 24981, 1953.
[10] M. M. Kruschov, “Resistance of metals to wear by abrasion, as related to hardness”, Proc. of Conf.
on Lub. and Wear. Inst. of Mech. Engrs, London,
PP. 655-59, 1957.
[11] MSC. Superforge Material Library User
Guide, the MacNeal-Scwendler Corporation,
Release 2002.
[12] MSC. SuperForge 200, User Guide, Sample
![Fig. 3 Work piece material stress-strain curve at 1100 o C and different strain rates [11]](https://thumb-us.123doks.com/thumbv2/123dok_us/7826866.1666192/5.595.66.277.345.519/work-piece-material-stress-strain-curve-different-strain.webp)