Dynamic Analysis of Stone Cladding System in
Multi Storey Building
Hussain. A. Ginwala Roshni John
PG Student Professor
Department of Civil Engineering Department of Civil Engineering
Saraswati College of EngineeringMaharashtra, India Saraswati College of Engineering Maharashtra, India
Abstract
Consideration of stone cladding in a multi storey building as resistance to lateral forces will significantly change the behavior of the structure especially under heavy dynamic forces. Current procedures and standards do not propose any method to include the stiffness and lateral load resisting properties in our design procedure. Only the additional load and moments generated due to the self-weight of the cladding is considered and added to the supporting structural member. In this study not only the stiffness but the lateral load resisting properties of the stone cladding have been considered for dynamic analysis of a seven and twenty one storey hotel structure for which various parameters like displacements and time period namely are compared with the results from conventional dynamic analysis. The outcomes of the analysis obtained from this paper will help to understand how the support conditions and different orientations affect the dynamic behavior of the structure. Also the effect of cladding on structural members i.e. column and beam and change in their bending behavior is studied. Along with the computational analysis manual calculations of the stone cladding systems and their components are compared with actual on site results.
Keywords: Stone Cladding, Stone Envelope, Dynamic effect, Seismic Resistance due to cladding, clamps
________________________________________________________________________________________________________
I. INTRODUCTION
Wall cladding is the process of layering one material on top of another material which will create a skin layer over the walls. Wall cladding is a great way to protect a building from adverse weather elements, as well as other types of irritants that could have a negative effect on the building. Cladding is almost exclusively used as a control feature, preventing the walls and the internal workings of a room or building being damaged by water or allowing the leakage of water that could potentially become a hazard for people who are walking around or inside the structure. Depending on the task at hand, different types of materials can be used for wall cladding, such as wood, brick, metal plastic or imitation stone.
Stone cladding is one of the most common materials used for wall cladding, as it is very durable, versatile, as well as long lasting. Cladding will make sure that the mechanical structure of the building remains sound, as it will be able to adapt to changing weather conditions. Since these cladding systems are effectively external envelopes for a structure it makes them more susceptible to dynamic conditions. Their failure in seismic and wind conditions can cause extreme damage to the adjoining property as well as pose a threat to the immediate living population. Hence it is of utmost importance to carry out dynamic analysis of these external claddings and study their behaviour and failure patterns to avoid such accidents. Another important factor that designers neglect in terms of dynamic analysis of cladding systems is their inclusion as shear diaphragms in the overall design. These systems can be quite effective against seismic and wind forces and can also reduce the overall base shear and moments acting on the entire building envelope. In the present thesis, effect of stone cladding on the seismic response of the selected multi storey building is studied.
II. LITERATURE REVIEW
Mahendran M and Mahaarachichi D et al. (1991) stated that crest-fixed steel claddings made of thin, high strength steel often suffer from local pull-through failures at their screw connections during high wind events such as storms and hurricanes. A series of two-span cladding and small scale tests was conducted on a range of crest-fixed steel cladding systems under simulated wind uplift loads. The strains in the sheeting around the critical central support screw fastener holes were measured until the pull-through failure occurred. He suggested that the local pull-through failures in the less ductile steel claddings are initiated by transverse splitting at the fastener holes.
Mahendran M and Mahaarachichi D et al. (1991) studied the failures of roof claddings and observed that they are very often caused by the uplifting force from the wind. The uplifting force normally caused damage to the support of the roof cladding which were attached to the purlins. In this study, a finite element model of trapezoidal cladding was developed and subjected to wind uplift/ suction force, the study observed that local dimpling or pull- through failure occurs prematurely at their screw connections because of large stress concentration in the cladding at the vicinity of the screw heads.
loading. The study revealed that uplift loading caused severe cross sectional distortion of the cladding since the wide pan separated the screwed ribs.
John D Ginger et al. (1994) evaluated cladding in terms of the velocity fluctuations created by it due to the openings provided for ventilation. Wind induced pressures were tested on two base models at Texas Tech University. One model was given nominal cladding with air gaps and the other was with large openings. The study revealed that the larger the opening the more the building excites under dynamic conditions due to the dominant windward force that causes increase in the net wind pressure causing uplift force.
Matthew C. Farmer et al. (1994) evaluated cladding failure in a ten storey class B building in Lebanon, L shaped in plan. It had alternating horizontal bands of granite, glass, and aluminium framed ribbon windows. The granite panels were 3 cm thick and their plan dimension was 153cm x 183cm. The cladding panels were connected through individual steel components. In total 690 granite panels were connected using a combination of adhesive and steel connectors. After dynamic effects were subjected to the frame it was observed that the panels that were attached to the frame using adhesives failed in shear or tension. The adhesive cracked and the bond between the stone and the wall was split wide open causing shear failure. It was observed that the connection anchors were under designed and not shimmed properly to the wall, the connectors were subjected to a pressure of 4kN/m2 due to earthquake forces but due to the fact that they were not properly anchored in the wall they failed miserably and caused dislodgement of the panel onto the open streets. It was concluded that not only design but also the execution of the cladding anchorages play an important role in the safety and stability of the cladding and proposed double anchorage system for stone cladding so that if one connector fails the counter can sustain the remaining redundant dynamic force.
Davies et al. (1997) analysed profiled steel claddings by using finite element method. They addressed the design of profile cladding system at the ultimate limit state .They observed that usually the collapse mechanism utilises the redistribution of bending moment following initial yielding and buckling at internal supports. They have shown that the presence of this internal support reaction force can actually raise the moment of resistance over a significant part of the partial length of the cladding which increases the overall durability of the steel clamp.
Andrew Baird et al (1988) studied the interaction between precast concrete cladding systems and moment resisting frames. The structure was modelled as a single monolithic bay with precast concrete cladding panels attached every 2m to beams as well as columns. They observed an increase of approximately 10-20 % in seismic resistance of the structure under the influence of the cladding. It was seen that panels connected to beams were subjected to higher deflection than panels which were connected to columns. Another observation stated that the frame's height to span ratio had no effect on the yield force of the system. Overall stiffness capacity of the system was increased but the ductility of the system decreased. An approximate of 20% reduction in steel consumption was observed when cladding was considered as a seismic deterrent.
III. COMPONENTS OF CLADDING SYSTEMS
Fig. 1: Components of Cladding Systems Components of the Steel Bracket include:
Shear Pin Eye Bolt
Z- Bracket also known as Steel Clamps Anchor Bolts
2) Eye Bolt - helps to transfer the load as well as the eccentric moment to the stainless Steel bracket which in turn transfers it to the structural system.
3) S.S Bracket- Usually the size varies from 40mm to 70mm in width and the thickness varies from 4mm to 8mm and its purpose is to carry the combined effect of shear as well as moment created due to load eccentricity. Load eccentricity is a common phenomenon caused due to malpractices and errors practiced during construction and execution of the cladding.
4) Anchor Bolt – This bolt is the primary connection between the steel clamps and the R.C frame. The amplitude of shear is the primary concern that has to be addressed while designing this bolt.
The aforementioned components form the crux of the support system and their performance under dynamic conditions determine the durability and stability of the cladding systems as well as the primary frame as a whole.
IV. METHODOLOGY
Methodology:
1) The Steel Cladding Systems will be analysed and designed for dead and live loads for different air gaps and ranges as shown below.
2) Stone Size (600x1200) (Thickness)Air Gap Range 40 mm, 55mm, 65mm 0-60mm
3) The Steel Cladding systems will be designed as per IS 800 (2007) while the R.C frame will be designed as per IS 456 (2000) 4) The loading on the R.C frame will be in accordance with IS 875 part 1 and 2.
5) For the analysis purpose a total of 7 models are prepared: RCC bare frame with shear core walls for comparison purposes. b) RCC frame with different stone envelopes on all sides of the structure with varying air gaps ranging from 60-150mm 6) For pure dead and live load combination models, components of the connection detail will be designed and analysed for pull
out failures.
7) Using the above data and incorporating it to find the Optimum size of section for varying connection systems and its components like Eye bolt, Anchor Bolt, Stainless Steel Clamp along with stone size.
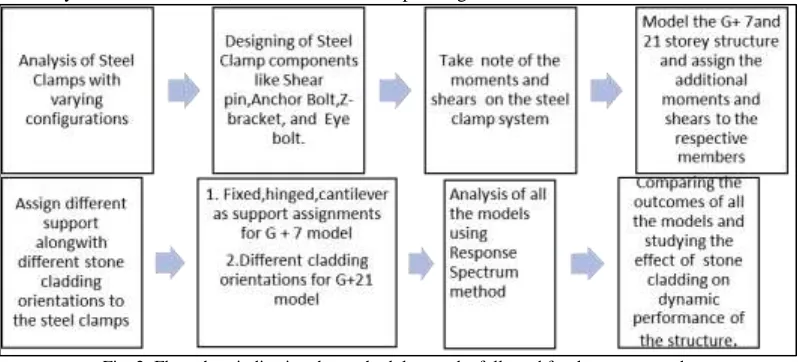
Fig. 2: Flow chart indicating the methodology to be followed for the current study
8) For the G+7 three different assignments to the stone cladding will be given namely a.) Base model b.) Stone cladding as fixed c.) Stone cladding as hinged d.) Stone cladding as cantilever. From the results the appropriate connection assignment will be determined which will be used for the G + 21 model.
9) For the G + 21 four, different orientations of stone cladding will be provided namely a.) Cladding in all directions b.) Cladding in X-direction only c.)
Table - 1
Design data for G + 7 storey model
Description Design data for G+7
Building Model Cladding as fixed Cladding as hinged Cladding as cantilever
Storey G+7 ( 45 x 75 m ) G+7 ( 45 x 75 m ) G+7 ( 45 x 75 m )
Type of Analysis Response Spectrum (Linear Static)
Response Spectrum (Linear Static)
Response Spectrum (Linear Static)
Seismic zone and zone factor (Z) III (Z=0.16) III (Z=0.16) III (Z=0.16)
Height of structure 23.5 m
Grade of steel Fe 500
Floor finish 1.50 kN/m2(IS 875 part1)
Live load 4 kN/m2(IS 875 part1)
Column size 300x900mm (M35 grade of concrete)
Beam size 300x900 mm (M35 concrete)
Stone Thickness 600x1200 mm Sandstone slab 40mm in thickness
Density of Sandstone 2700kg /m3
Response reduction factor (R) 3
Importance Factor 1.5
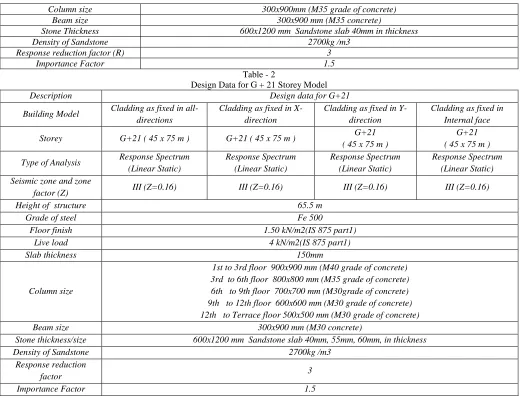
Table - 2
Design Data for G + 21 Storey Model
Description Design data for G+21
Building Model Cladding as fixed in all-directions
Cladding as fixed in X-direction
Cladding as fixed in Y-direction
Cladding as fixed in Internal face
Storey G+21 ( 45 x 75 m ) G+21 ( 45 x 75 m ) G+21
( 45 x 75 m )
G+21 ( 45 x 75 m )
Type of Analysis Response Spectrum (Linear Static) Response Spectrum (Linear Static) Response Spectrum (Linear Static) Response Spectrum (Linear Static) Seismic zone and zone
factor (Z) III (Z=0.16) III (Z=0.16) III (Z=0.16) III (Z=0.16)
Height of structure 65.5 m
Grade of steel Fe 500
Floor finish 1.50 kN/m2(IS 875 part1)
Live load 4 kN/m2(IS 875 part1)
Slab thickness 150mm
Column size
1st to 3rd floor 900x900 mm (M40 grade of concrete) 3rd to 6th floor 800x800 mm (M35 grade of concrete) 6th to 9th floor 700x700 mm (M30grade of concrete) 9th to 12th floor 600x600 mm (M30 grade of concrete) 12th to Terrace floor 500x500 mm (M30 grade of concrete)
Beam size 300x900 mm (M30 concrete)
Stone thickness/size 600x1200 mm Sandstone slab 40mm, 55mm, 60mm, in thickness
Density of Sandstone 2700kg /m3
Response reduction
factor 3
Importance Factor 1.5
V. RESULTS AND DISCUSSION
Analysis of G + 7 and G + 21 storey building with three different support conditions namely fixed, hinged and cantilever for the 7 storey model and four different orientations namely cladding in all directions , cladding in X - direction , cladding in Y - direction , and cladding only at internal face of the building for the 21 storey model. The models are compared on the basis of time period , frequency , base shear , displacement , effect on mass participation , spectral acceleration etc. to find out the most effective support assignment and cladding orientation against seismic forces.
Results from Analysis of 7 Storey Model
Displacement:
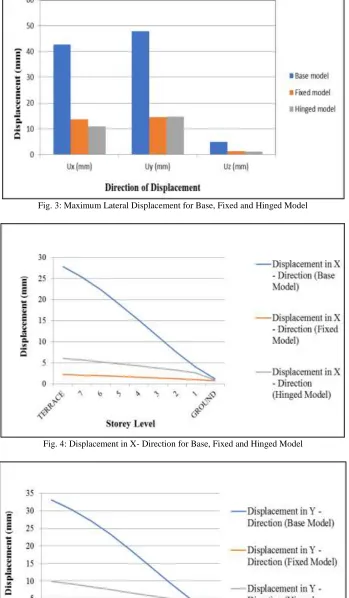
Table - 3
Displacement for G+7 storey model Max Displacement Ux (mm) Uy (mm) Uz (mm)
Base model 42.741 47.7951 4.84
Fixed model 13.646 14.5 1.3
Fig. 3: Maximum Lateral Displacement for Base, Fixed and Hinged Model
Fig. 4: Displacement in X- Direction for Base, Fixed and Hinged Model
From figure 4, 5 we can deduce that compared to the base model the fixed and hinged model show a reduction of approximately 60 - 65 % in the X and Y directions. This is due to the stiffness created by the cladding in their respective direction.
Storey Acceleration:
Table - 4
Storey Acceleration for G + 7 storey model Storey Acceleration X (m/s2 ) Y (m/s2 ) Z (m/s2 )
Base model 1.04 1.35 1.0135
Fixed model 0.51 0.52 0.22
Hinged model 7.98 2.2 2.75
Fig. 6: Storey Accelerations for Various Models in X, Y and Z Direction Respectively
The fixed model again shows superiority in reducing seismic accelerations while the hinged model fails miserably due to its increased flexibility causing the accelerations to spike.
Time period:
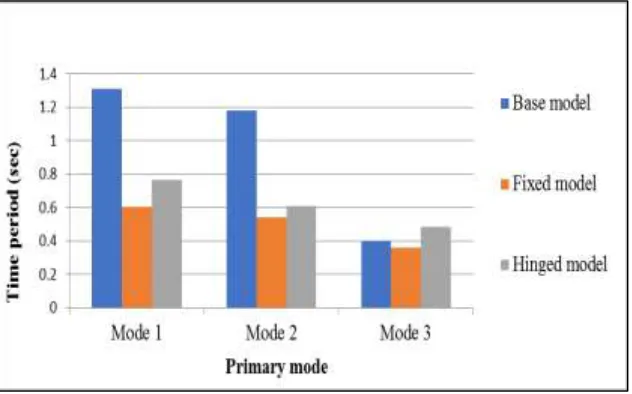
Table - 5
Time Period for G + 7 Storey Model Time Period Mode 1 Mode 2 Mode 3
Base model 1.3105 1.1833 0.4002 Fixed model 0.603 0.5404 0.3618 Hinged model 0.7636 0.609 0.484
The time period of a structure determines the stability and the period up to which it experiences maximum acceleration under seismic conditions and hence the lower the period the better the structures performance.
Fig. 7: Time Period for Various Models for Mode 1, 2 and 3 Respectively
Storey Overturning Moments:
Table - 6
Storey overturning moment for G+7 Storey Model Storey Overturning Moment x 1000 (kN –m) Level
Base model 19 Terrace
Fixed model 14 Terrace
Hinged model 14 Terrace
The overturning moments determine an important factor for the structure that is the steel consumption in the structural members, hence lower the moments lower the steel consumption.
Fig. 8: Storey Overturning Moment for Various Models
The fixed and the hinged model both show considerable decrease (almost 25 %) in the overturning moments resisted by the structure at the terrace floor level.
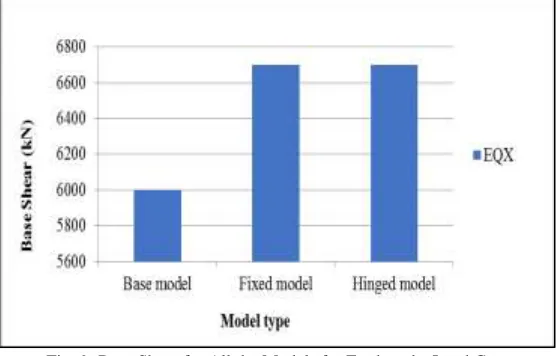
Base Shear:
Table - 7
Base Shear for G + 7 Storey Model Base Shear EQX (kN) Base model 6190 Fixed model 6650 Hinged model 6750
Base shear is an important component in dynamic analysis, which helps us to gauge the exact force that has been applied to the structure due to various dynamic effects like earthquake and wind forces. Since the earthquake force is directly proportional to the weight of the structure, structures with stone cladding have a higher value than the conventional structure.
Fig. 9: Base Shear for All the Models for Earthquake Load Case
Storey Drift:
Table - 8
Storey Drift for G+7 Storey Model (X-direction) Storey Storey Drift in X - Direction (Base
Model)
Storey Drift in X - Direction (Fixed Model)
Storey Drift in X - Direction (Hinged Model)
TERRACE 0.000106 0.000004 0.000001
7 0.00013 0.000005 0.000001
6 0.000153 0.000007 0.000001
5 0.000174 0.000008 0.000001
4 0.000191 0.000009 0.000001
3 0.0002 0.00001 0.000001
2 0.000197 0.000011 0.000001
1 0.000174 0.000014 0.000001
GROUND 0.000101 0.00006 0.000001
Table - 9
Storey Drift for G+7 Storey Model (Y-direction) Storey Storey Drift in Y - Direction (Base
Model)
Storey Drift in Y - Direction (Fixed Model)
Storey Drift in Y- Direction (Hinged Model)
TERRACE 0.00021 0.000013 0.000001
7 0.000269 0.000016 0.000001
6 0.000339 0.000019 0.000001
5 0.00041 0.000022 0.000001
4 0.000472 0.000024 0.000001
3 0.000514 0.000026 0.000001
2 0.000517 0.000028 0.000001
1 0.000443 0.000035 0.000001
GROUND 0.000233 0.00012 0.000001
Fig. 10: Storey Drift due to Wind in X Direction
The fixed and the hinged model both show considerable decrease (almost 25%) in the storey drift due to wind conditions which are the dominant forces governing the drifts of the structure.
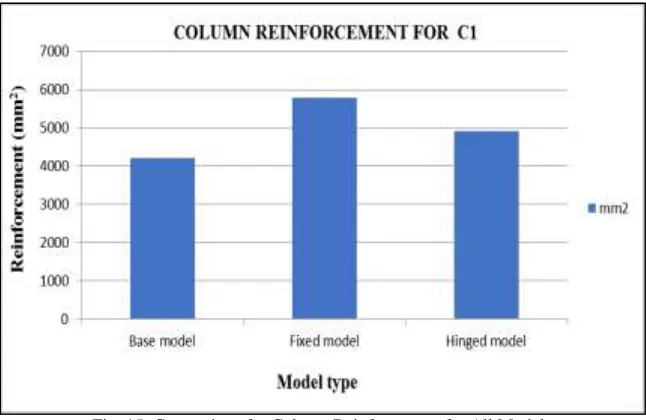
Column Reinforcement and Change in Beam Bending Moment Diagram:
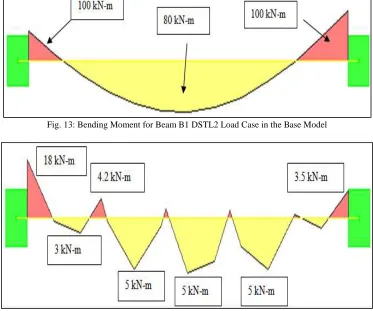
Fig. 12: Bending Moment of the Plan under Consideration for DSTL2 Case
The change in the bending moment diagram of external beams is quite considerable. In the conventional model the BM is ordinary i.e. sagging in the mid portion and then top moments at supports are generated but in the fixed model, the cladding acts as supports and top moment in columns disappear almost entirely thereby decreasing the compression reinforcement of the beam.
Fig. 13: Bending Moment for Beam B1 DSTL2 Load Case in the Base Model
Fig. 15: Comparison for Column Reinforcement for All Models
Due to additional moment the average increase in column reinforcement is almost 37% at the base level but the increase in steel in columns is countered by the reduction of reinforcement in beams and its support which forms the strong column weak beam frame which is ideal for the structure.
Results from Analysis of 21 Storey Model
Displacement:
Table - 10
Displacement for G + 21 Storey Model
Model Base
model
Cladding in all direction
Cladding in X-direction
Cladding in Y-direction
Cladding at internal face Displacement in X-direction
(mm) 246 13 17.2 245.5 25.138
Displacement in Y-direction
(mm) 260 18 260 23.169 46.95
Fig. 16: Maximum Joint Displacements for Various Models in X and Y Respectively
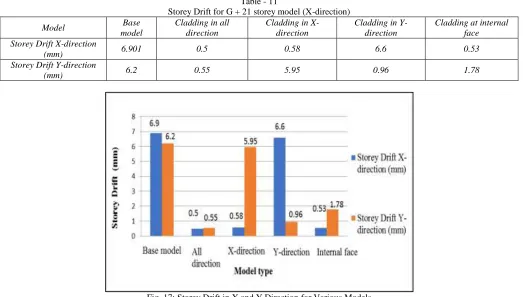
Storey Drift:
Table - 11
Storey Drift for G + 21 storey model (X-direction)
Model Base
model
Cladding in all direction
Cladding in X-direction
Cladding in Y-direction
Cladding at internal face Storey Drift X-direction
(mm) 6.901 0.5 0.58 6.6 0.53
Storey Drift Y-direction
(mm) 6.2 0.55 5.95 0.96 1.78
Fig. 17: Storey Drift in X and Y Direction for Various Models
From Fig. 17 we can deduce that the model having stone cladding in all directions shows a reduction of approximately 70 - 80 % in the X and Y directions simultaneously. The trend follows in the corresponding models also i.e. wherever cladding was applied storey drifts reduced substantially.
Storey Acceleration:
Table - 12
Storey Acceleration for G + 21 Storey Model
Model Base
model
Cladding in all direction
Cladding in X-direction
Cladding in Y-direction
Cladding at internal face Storey acceleration X-direction
(mm/sec2) 707.6 921.22 927 508.6 783
Storey acceleration Y-direction
(mm/sec2) 186.25 1045 575 1043 910.6
From Fig. 18 we can deduce that the model having stone cladding in all directions shows a reduction of approximately 50 - 60 % in the X and Y directions simultaneously. The trend follows in the corresponding models also i.e. wherever cladding was applied storey drifts reduced substantially.
Modal mass participation factor (Rx, Ry,Ux and Uy ):
Table - 13
Modal Mass Participation for G + 21 Storey Model
Model Base
model
Cladding in all direction
Cladding in X-direction
Cladding in Y-direction
Cladding at internal face Modal mass participation factor
Rx (%) 87.57 96.38 93 86.63 94.01
Modal mass participation factor
Ry (%) 88.38 96.73 86.9 93.03 94.36
Fig. 19: Modal Mass Participation Factor (Rotation) for All Models
Fig. 20: Modal Mass Participation Factor (Displacement) for All Models
Base Shear:
Fig. 21: Base Shear for Various Models
From Fig. 21 We can deduce that there is a marginal increase in the base shear i.e. about 5-8% which is negligible in case of high rise structures. The primary reason for this is because the cladding does not extend to the base level with fixity. This cause’s storey shear to increase at first level exorbitantly and thus causes soft storey in the structure which should be taken into consideration. The soft storey effect is very much considerable.
Storey Stiffness:
Table - 14
Storey Stiffness for G+21 Models
Model Base
model
Cladding in all direction
Cladding in X-direction
Cladding in Y-direction
Cladding at internal face Modal mass participation factor
Rx (%) 87.57 96.38 93 86.63 94.01
Modal mass participation factor
Ry (%) 88.38 96.73 86.9 93.03 94.36
Fig. 22: Storey Stiffness in X and Y Direction for Various Models
Time Period and Frequency:
Table - 15
Time Period for G+21 Models Time period
(sec)
Base model
Cladding in all direction
Cladding in X-direction
Cladding in Y-direction
Cladding at internal face
Mode 1 3.405 0.876 3.442 3.293 1.411
Mode 2 3.274 0.776 1.194 1.114 1.092
Mode 3 1.191 0.285 0.869 0.983 0.433
Mode 4 1.11 0.26 0.661 0.597 0.364
Mode 5 0.658 0.152 0.432 0.381 0.224
Mode 7 0.43 0.105 0.281 0.271 0.152
Mode 8 0.379 0.1 0.232 0.206 0.142
Mode 9 0.308 0.079 0.179 0.162 0.114
Mode 10 0.269 0.076 0.149 0.157 0.109
Mode 11 0.231 0.064 0.144 0.133 0.09
Mode 12 0.204 0.061 0.119 0.113 0.088
Table - 16
Frequency for G+ 21 Models Frequency
(sec)-1
Base model
Cladding in all direction
Cladding in X-direction
Cladding in Y-direction
Cladding at internal face
Mode 1 0.294 1.142 0.291 0.304 0.709
Mode 2 0.305 1.289 0.837 0.898 0.916
Mode 3 0.84 3.506 1.151 1.017 2.31
Mode 4 0.9 3.848 1.513 1.675 2.747
Mode 5 1.519 6.558 2.317 2.622 4.463
Mode 6 1.687 6.893 3.244 3.257 4.887
Mode 7 2.325 9.559 3.554 3.691 6.598
Mode 8 2.64 10.015 4.317 4.865 7.026
Mode 9 3.251 12.584 5.594 6.167 8.773
Mode 10 3.714 13.194 6.702 6.356 9.212
Mode 11 4.326 15.584 6.963 7.499 10.96
Mode 12 4.892 16.384 8.405 8.839 11.412
The time period of a structure determines the stability and the period up to which it experiences maximum acceleration under seismic conditions and hence the lower the period the better the structures performance and it’s the opposite for frequency of a structure under dynamic conditions.
Fig. 23: Time Period from Mode 1 to Mode 12 for All Models
VI. CONCLUSION
Considering the results obtained from both G+7 (3 models) and G+21 (4 models) models these are the conclusion drawn from the analysis:
1) Comparing the fixed hinged and cantilever models it can be deduced that the maximum resistance to seismic forces is seen when the stone claddings are given fixed assignments.
2) Due to increased mass and weight of the fixed model there is an increase of about 10% in Seismic forces But despite of the increase in these forces the overall deflection of the structure decreases by almost 65 % less than that of the base model. 3) When the cladding system is applied in all the directions the mass participation factor of the model reaches 98-99% in X as
well as Y direction.
4) Time period of the structure decrease by 70 % when cladding is applied in all the directions while time period of the structure decreases by 50% when cladding is applied only at the internal faces of the structure.
5) The fixed model increases the column reinforcement by 35-40% approximately due to the additional loads generated by the stone claddings. But there is an inverse effect on the beams i.e. the reinforcement required at the supports drastically reduces to minimum percentage required.
6) This implies that the model follows the strong column and weak beam pattern which is ideally required in a structure as an indication that the structure has good seismic resistance
7) From the overall seven models of G+7 and G+ 21 storey we can cumulatively deduce that in order to gets the maximum effect from stone cladding against seismic forces, they should be assigned as fixed support and their orientation should be symmetrical in plan provided in all direction.
REFERENCES
[1] Mahaarachichi D Mahendran M [1991] “Numerical Modeling Pull through Failures in Crest-fixed Steel Cladding System” Journal of Structural Engineering ASCE Vol. 03, Issue 2 ( June 1991)
[2] Mahendran and Mahaarachichi D [1991] “Finite Element Analysis of Crest-fixed a steel Claddings Subject Pull-through Failures” Proc of the second International Symposium on Steel Structures Korean Society of Steel Construction Seoul
[3] Mahaarachichi M and Mahendran D [1994] “Finite Element Analysis of Crest-fixed Steel Claddings initiated by Transverse Splitting” Proc. Of the 15th International Specialty Conference on Cold formed Steel Structures St Loius Missouri
[4] Wymond B. “Sealing the Building Envelope”- Curtain Wall and Cladding. ASCE Vol. 11, Issue 2 (May 1996) [5] Peter H. “Stone Cladding-Technical Advice”. ASCE Vol. 25, Issue 1 (January 1996)
[6] Gulien J.M. “Fixing of Natural Stone Pieces on Ventilated Walls”. ASCE Vol. 21, Issue 2 ( June 2002) [7] Robert M. Henry & Frederic Roll [2002] “Cladding-Frame Interaction”. ASCE Vol. 21, Issue 2 (June 2002)
[8] Craig M. Starr & Theodor Krauthammer [2002] ‘Cladding Structure Interaction under Impact Loads” ASCE Vol. 12, Issue 1 (August 2002)
[9] Mahaarachichi M and Mahendran D “Cyclic Pullout Strength of Screwed Connection in steel roof and wall cladding systems using thin steel battens”. ASCE Vol. 07, Issue 2 (March 2002)
[10] Eleni Smyrou “Design procedure for claddings with dissipative connections in seismic zones”. ASCE Vol. 06 Issue 2 (January 2003)
[11] Tarek Sharaf & Amir Fam “Experimental investigation of large scale cladding panels under out of plane transverse loading for building applications”. ASCE Vol. 21, Issue 2 ( June 2003)
[12] John D. Ginger [2003] “Internal Pressures and Cladding net wind loads on full scale low rise buildings”. ASCE Vol. 04, Issue 2 ( March 2003)
[13] Andrew Baird, Ricardo Drafero , Alessandro Palermo & Stefero Pampanin [2003] “Parametric Investigation of Seismic Interaction between Precast Concrete cladding systems and moment resisting frames”. ASCE Vol. 20, Issue 3 (June 2003)
[14] M. Mahendaran & R.B. Tang “Pullout strength of steel-roof and wall cladding systems”. ASCE Vol. 14, Issue 2 (September 2003) [15] Gary R. Searer & Sigmund A. Freeman “Seismic Drift and the Design of Claddings”. ASCE Vol. 1, Issue 2 (November 2003) [16] Mathew C. Farmer & Susan P. Lyons “Stone Cladding failure: The Cause & Consequences”. ASCE Vol. 1, Issue 2 (February 2004)
[17] William D. Bast , Ken R. Maschlore & Scott G. Nacheman “Wind induced curtain wall damage on a moment resisting frame”. ASCE Vol. 1, Issue 2 (March 2006)