2819
An Effective Machine Learning Approach For
Disease Predictive Modelling In Medical
Application
Priya G, Radhika A
Abstract— Most illnesses are lethal if left untreated and most of the people don't know whether they have a certain disorder or not. Therefore, it is necessary to diagnose the disease at an earlier stage to improve the life expectancy of the affected individuals. The cancer disease is the most deadly disease which needs to be identified and diagnosed earlier. In particular, breast cancer is the most common cancer among women in the world with a high death rate. Hence breast cancer disease needed to be predicted earlier to lead a life healthier. In this paper, a novel predictive modelling technique is implemented with the combination of the logistic regression, random forest and deep neural network to predict breast cancer. The performance of proposed model has been evaluated in terms of measuring accuracy, precision, recall and F1-score. For our proposed ensemble technique, we gain accuracy of 97.6%, precision of 97%, recall of 97% and an F1-score of 97%. The result that we obtained through the ensemble technique is exceptional when compared to the traditional method like logistic regression and conventional method like the random forest.
Index Terms— Breast Cancer, Deep Neural Network, Disease predictive modelling, Machine Learning algorithms, Principal component analysis
—————————— ——————————
1.
I
NTRODUCTIONIN recent days, most non-communicable diseases such as cancer, heart disease, etc. are mainly based on unhealthy lifestyles and morbidity [1]. Where two-thirds of global deaths are caused by cancer and breast cancer is one of these. Further, that breast cancer is most common cancer among women. The prevalence of breast cancer is growing across the globe. According to the 2002 World Health Report, the cause of breast cancer depends on five factors such as sedentary lifestyle, smoking, insufficient breastfeeding, unhealthy diet, and excess alcohol usage. Breast cancer is developed from glandular milk ducts epithelial cells of the breast. It's one of the tumour types; the name of the tumour is a malignant tumour. Further, the non-cancer tumour is called benign. Several diagnostic procedures are required for the doctor or surgeon to decide cancer is a benign tumour or a malignant tumour [2]. The doctor uses several measurements, such as cell type uniformity, clump density, cell size uniformity, etc., to diagnose breast cancer, but still, the outcome is not accurate. This has led particularly to an increase in the use of machine learning and computing as diagnostic tools. Therefore, new diagnostic tools or new techniques for predicting breast cancer needs to be developed earlier in order to extend human life.
2.
R
ELATED WORKIn the related work, we have analysed few research related to breast cancer with different predictive modelling using machine learning techniques like fuzzy-based logistic regression, Support Vector Machine (SVM), Naive Bayes (NB), Linear Discriminant Analysis, AdaBoost, Random Forest (RF), Logistic Regression (LR) and Least-square SVM (LSSVM) and Adabag. The brief summary of these methods with issues for the same are discussed as follows: Research by Nandagopal et al. [3] employed a novel regression method called LLR. It is used to detect the victim gene using the classification of
cancer data. LLR model is derived from LASSO (Least Absolute Shrinkage and Selection Operator) Logistic Regression. Machine learning technique, i.e. fuzzy-based logistic regression, has been implemented to select the cancer gene data via feature selection. The average classification accuracy on the breast cancer dataset with 116 cases was found to be 94.05 % and also the model achieve productivity with the lower error rate. The LLR system still has some drawbacks like the model that has only been tested with 116 instances that are tiny databases. With a large data set, it should be evaluated in future. The study by Singh [4] evaluated the ability of anthropometric and medical measurements for breast cancer screening using a list of 116 cases. Different elements of the machine learning model were incorporated. Further, the performance is analysed and calculated using feature selection, cross-validation, and classification method. Consequently, the resistin, insulin, age, HOMA and glucose were used to get biomarkers accuracy for the detection of breast cancer. Furthermore, more research is needed to verify such results with more factors on a greater and multi-centred anthropometric measurement and medical and database. In the future, the accuracy could be compared with the advanced technologies like a deep neural network with a larger database. Study by Tapak et al [5] compared and predicted breast cancer (BC) metastasis and survival using six machine learning methods and two traditional methods such as Support Vector Machine (SVM), Naive Bayes (NB), Linear Discriminant Analysis, AdaBoost, Random Forest (RF), Logistic Regression (LR) and Least-square SVM (LSSVM) and Adabag. In this study, the researcher used a database composed of 550 patients with breast cancer. The performances such as accuracy specificity, sensitivity and likelihood ratio were evaluated using these techniques. As a result, the highest specificity is, therefore, RF, which is 98%, the accuracy of SVM is 93% and accuracy of LDA is 93% and the highest sensitivity is 36%, that is NB. Research by Liu, [6] used the Sklearn machine learning library, the logistic regression technique to predict breast cancer by classifying the dataset. The Wisconsin diagnostic breast cancer (WDBC) dataset is used in this research. In this experiment, two characteristics, that is mean texture and mean radius is used for classification. In classification, the accuracy is 90.48 % when choosing the maximum texture and 96.5 % when
_______________________________
Priya G is currently pursing PhD (part-time) in the Department of Statistics, Periyar University, Salem
2820 choosing the maximum radius. Maximum result for the
conventional method of machine learning is 96.5%. Therefore, in the future, a better combination of features must be chosen to improve the accuracy of the classification. Research by Jain and Bhaumik [7] proposed Application Specific Integrated Circuit (ASIC) model depend on forward search to diagnosis cardiovascular disease on smart mobile. It is the diagnostic algorithm for the processing of the ECG signal. The ASIC is the low computational detecting algorithm and to evaluate cardiovascular disease diagnostic dataset Physionet PTB ECG is used. The algorithms accurately predicted the T wave parameters, P wave, ST-segment and QRS complex. As a result, the specificity of the P(T) wave is 91.07% and the sensitivity is 98.91% respectively. In the future, different datasets need to be used by the proposed model to predict cardiovascular disease on smart mobile. From the review of literature, different machine techniques will be applied to study disease like breast cancer [6], [8] and cardiovascular disease [9] Jain and Bhaumik,[7]. Overall, earlier research has produced decent results to predict breast cancer disease. Nevertheless, the earlier method of detection needs improvisation. We also believe that the ensemble methodology using machine learning and data mining can help to predict breast cancer accurately and also help to minimize previous diagnostic errors. As a result, the ensemble predictive method ultimately delivers the patient with good quality services.
3.
R
ESEARCHM
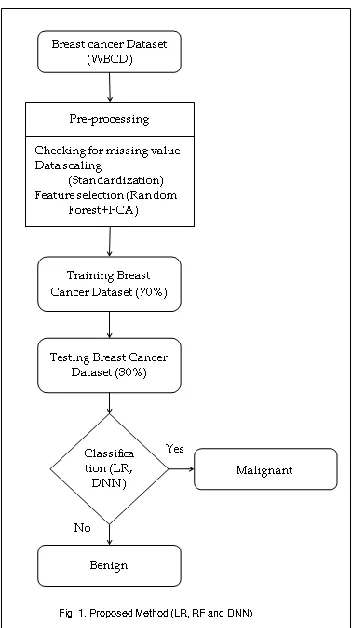
ETHODOLOGYThe aim of the research is to predict where the patient has Benign tumour (non-cancerous) or Malignant tumour (cancerous). We have outlined an ensemble predictive model to come with the most accurate predictions. The system consists of the following major phases like system configuration, dataset selection, data scaling, feature selection, feature extraction, and classification. Finally, the result is obtained using the confusion matrix and performance metric. The workflow below outlines a basic review of the entire research methodology:
1. System Configuration 2. Selection of dataset 3. Data Pre-processing
Checking for missing value Data scaling (i.e. Standardization) Feature selection (i.e. Random Forest) Feature extraction (i.e PCA)
4. Training and Testing by the classifier (i.e. Logistic Regression and Deep Neural Network)
5. The performance metric is evaluated using the confusion matrix;
Below is a flowchart (Figure 1) and a detailed description of the technique and the actions carried out against each technique.
Fig. 1. Proposed Method (LR, RF and DNN)
3.1 System Configuration
In this research work, an effective disease predictive modeling in medical application is implemented in python using three machine learning techniques - Logistic regression, random forest, and deep neural network. The study's experimental findings were all performed on a computer with a high visual interface configuration and operating system setup. The experiment is conducted on the test machine configured with Intel (R) Core (TM) i7 processor with 16GB of RAM running 64-bit Windows 10 Operating system. The data transformation and model training were executed using python 3.7 software. The detail of the system configuration is represented in table 1.
TABLE 1 System Configuration
3.2 Breast Cancer – Evaluation
3.2.1 Dataset
2821 include area, radius, perimeter, compactness, texture,
symmetry, smoothness, fractal dimension, concave points, etc. The basic features of samples are presented in Table 2
3.2.2 Data Pre-processing
3.2.2.1 Checking for missing value
The first step of pre-processing is to check for the missing value in the dataset. We have analysed the Wisconsin breast cancer data set. As a result, found that the dataset does not contain null elements. Every feature is numerical in the dataset.
3.2.2.2 Data scaling (Standardization)
Next important step in preprocessing is data scaling. Where data need to be scaled before modelling. In our research, the data scaling is done using standardization method. In the standardization approach, the data is represented as data points. All the data points in the WBCD dataset is standardised using the mean and standard deviation. The standardisation is also known as z-score. Using the following formula, the data is scaled using standardization,
(1)
Where,
Zi – Standardization
Xi – Data Point (x1, x2, x3…xn).
– Mean
S – Standard deviation
3.2.2.3 Feature Selection
The third step of pre-processing is the feature selection. The feature selection is a filter method, used to select the most relevant feature from the dataset. The feature selection is used to improve accuracy, reduce over fitting and to reduce training time [12]. In this study, the random forest algorithm is used for feature selection and identifies the important features automatically from the dataset. The identified feature will help to contribute most to the parameter of prediction. The technique takes only a small subset of features rather than all features. In the mathematical theory of communication, the concept of information theory is used by the random forest method to pick the most significant feature by looking into a prediction variable. In this study, the most significant features has been extracted (nearly 15 features) using random forest classifier approach. from the WBCD dataset.
TABLE 2
Sample Wisconsin breast cancer data set
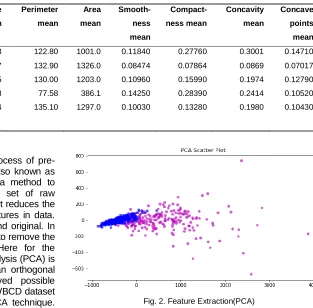
3.2.2.4 Feature Extraction
The feature extraction technique is the fourth process of pre-processing technique. The feature extraction is also known as dimension reduction. The feature extraction is a method to reduce dimensionality by reducing the original set of raw information to more workable processing groups. It reduces the dimensionality of data by selecting important features in data. While the initial information set is still accurate and original. In our research, feature extraction technique is used to remove the unwanted variable from the WBCD dataset. Here for the dimension reduction, the Principal component analysis (PCA) is used. PCA is a statistical method which uses an orthogonal transformation to transform a set of observed possible associated variables. The 32 Attributes from the WBCD dataset is reduced to 2 principal features using the PCA technique. Since the PCA components are orthogonal to each other, they are not correlated; we can see malignant and benign classes as distinct. The feature extraction PCA technique is represented in Fig 2.
Fig. 2. Feature Extraction(PCA)
3.2.3 Classification (Training and Testing the model) Once the data is pre-processed, it is necessary to train the data to accurately predict the results. For training the data, we need machine learning classification algorithm. In our research, we have used three classification algorithms such as Logistic
ID Diagnosis Radius mean
Texture mean
Perimeter mean
Area mean
Smooth- ness mean
Compact-ness mean
Concavity mean
Concave points mean
842302 M 17.99 10.38 122.80 1001.0 0.11840 0.27760 0.3001 0.14710
842517 M 20.57 17.77 132.90 1326.0 0.08474 0.07864 0.0869 0.07017
84300903 M 19.69 21.25 130.00 1203.0 0.10960 0.15990 0.1974 0.12790
84348301 M 11.42 20.38 77.58 386.1 0.14250 0.28390 0.2414 0.10520
2822 Regression, Random Forest and Deep Neural Network
algorithms to train the data. Once the data is trained, learnt data is sent to the testing phase; the same three machine learning classification algorithms are used for testing as well. The splitting ratio of Wisconsin Breast Cancer dataset (WBCD) for training is 70%, and testing is 30%. The classifier predicts, where the person has breast cancer or not. If the person has breast cancer, it predicted as a malignant tumour, else it predicted as a benign tumour. For the better accuracy tried ensemble technique with three different machine learning algorithms such as Logistic Regression, Random Forest and Neural Deep Network algorithms. All these three classification algorithms will predict, whether, the patient has a malignant tumour or benign tumour.
4.
R
ESULTOnce breast cancer data is trained and tested, then it is sent to the performance evaluation. Using the confusion matrix values such as true positive, true negative, false positive and false negative, the performance metric like accuracy, precision, recall and F1 score is calculated. The proposed model performance is evaluated using actual and predicted classification. The system accuracy is determined using the confusion matrix obtained by the classifier. The precision, recall, accuracy, and F1-score is calculated using the formula below,
Precision
Precision highlights only on the positive samples. It signifies the success of the probability of classification having the true positive class. It estimated as the ratio of true positive to the sum of a true positive and false positive.
(2)
Recall
Recall clarifies that the model sensitivity in the way of finding the positive class. It evaluated as the ratio of true Positive to the total amount of true positives and false negatives.
(3)
F-measure
The F-measure, which is the harmonic mean of recall and precision, is also known as the F1-score. The range for the value of F-Measure is from 0 to 1. The high score is reflected by F Measure's high value. This measure, called the Fβ-measure, does have a different form. This variant represents the weighted harmonic mean between recall and precision. The metric is sensitive in order to change the distribution of data. Presume the negative group outcomes have been increased by α times; The F-measure will be appropriately measured,
(4)
Accuracy
Accuracy identifies the positive classes and negative classes’ of the model. It calculated as the ratio of the total of real positive and real negative to entire samples (true and false positives and negatives). The accuracy rate is signified as closed to their real output.
(5)
The representations of TP, TN, FP, and FN have the meaning as listed in Table 3.
TABLE 3
Performance Evaluation Metrics
Term Meaning
TP The positive class is predicted correctly by the model TN The negative class is predicted correctly by the model FP The positive class is predicted wrongly by the model FN The negative class is predicted wrongly by the model
4.1 Confusion matrix
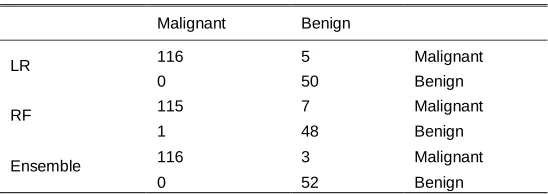
Confusion Matrix provides a matrix as output and defines the model's full performance. The performance of the confusion matrix for three machine learning algorithms such as logistic regression, random forest and deep neural network is given in detail. Using confusion matrix, the True Positive (TP), True negative(TN), False positive(FP) and False negative(FN) were calculated. Below table 4 provides the detailed description of the confusion matrix and the actions carried out against each technique.
TABLE 4 Confusion Matrix
Malignant Benign
LR 116 5 Malignant
0 50 Benign
RF 115 7 Malignant
1 48 Benign
Ensemble 116 3 Malignant
0 52 Benign
4.1.1 Logistic Regression
Using the logistic regression technique, the confusion matrix is calculated and obtained true positive (TP) of 116 counts, True negative (TN) of 50 counts, False positive (FP) of 5 counts and False negative (FN) of the null count. Hence, the algorithm is appropriately trained and the result is effective and efficient. The detail of the confusion matrix for logistic regression is given in Table 4.
4.1.2 Random Forest
We also calculated the confusion matrix using the random forest technique. The obtained True Positive (TP) is 115 count, True negative (TN) is 48 count, False positive (FP) is 7 count and False negative (FN) is 1 count. Hence, we can predict the algorithm is appropriately trained and the result is effective and efficient. The detail of the confusion matrix for the random forest is given in Table 4.
4.1.3 Ensemble (LR, RF and DNN)
Further, we calculated the confusion matrix using the ensemble technique for the WBCD dataset. The obtained True Positive (TP) is 116 count, True negative (TN) is 52 count, False positive (FP) is 3 count and False negative (FN) is null count. Therefore, we can predict the Ensemble model performance is outstanding when compared to other technique. The detail of the ensemble technique confusion matrix is given in Table 4.
2823 The performance of the proposed system is examined by
contemplating the actual and predicted classification. The framework suggested consists of three approaches such as logistic regression, random forest and ensemble technique. All three approaches are performed independently to obtain the performance metric. The Accuracy, Precision, Recall and F1 score are calculated in the performance metric. Below is a detailed description of the performance metric and the actions carried out against each confusion matrix. Table 5 represents the performance evaluation of three different techniques.
TABLE 5
Comparison of LR, RF and DNN in Performance metric
Algorithm Accuracy Precision Recall F1- Score
RF 95% 97% 96% 96%
LR 97% 96% 96% 96%
Ensemble (RF,
LR and DNN) 97.6% 97% 97% 97%
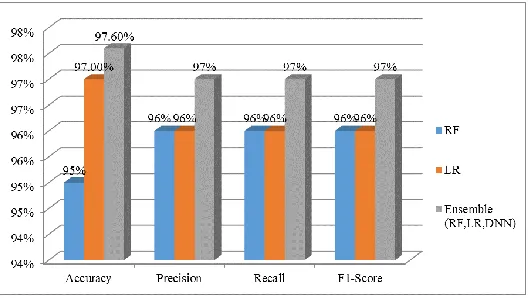
While comparing the performance metric for the logistic regression, random forest, and ensemble technique, we achieved 95 % accuracy for the RF model. Similarly, the precision is 96%, the recall is 96%, and the F1 score is 96% respectively for RF model. The performance metrics of the traditional RF approach is minimum when compared to other methods like LR and ensemble. The comparison chart is represented in Table 5. Similarly, Performance metric like accuracy, precision, recall and f1 score is evaluated for the logistic regression technique. The model obtains the Accuracy of 97%, precision of 96%, recall of 96% and F1- score of 96% respectively. The performance of the LR is moderate when compared to ensemble method. In addition, the LR model accuracy is higher than RF models result, but lower than ensemble method result.
Fig. 3. Pictorial representation of Comparison chart for Performance metric – LR, RF and ensemble method
Further, the performance metric is measured for the ensemble method. Obtained accuracy for the trained model is 97.6%. Similarly, precision is 97%, recall is 97%, and F1-score is 97% respectively. When comparing ensemble method performance with two other techniques such as LR and RF. ensemble method performance is exceptional. Further, the ensemble method shows the highest predictive accuracy, precision, recall and f1 score when compared to other two technique. Hence, we can conclude that the ensemble method classifier performs better than the other two classifiers used in this study. The comparison of accuracy, precision, recall and f1 score is represented in fig 3.
4.3 Comparison of Results
The performance metric accuracy result of breast cancer is compared with different machine learning technique like Logistic Regression, Support Vector Machine, Fuzzy based logistic regression and with our ensemble method (RF, LR and DNN). Where, The Liu, [6] predicted the breast cancer using the logistic regression technique and Liu obtained the accuracy of 90.48%. Similarly, Tapak et al [5] used Support Vector Machine technique and obtained accuracy of 93.00%. Further, Nandagopal et al [3] used Fuzzy-based Logistic Regression technique to predict breast cancer and obtain an accuracy of 94.05%. Hence accuracy range for prediction of breast cancer is from 90% to 94%. To enhance and improve prediction the accuracy, we have implemented ensemble method. Our ensemble method is combination of Logistic regression, random forest and deep neural network. Our proposed ensemble method obtains an accuracy of 97.6%. We found that our proposed model provides better result when compared to other studies accuracy results. The publications relevant to Machine Learning methods used for breast cancer survival prediction is represented in Table 6.
Figure 4 represents the breast cancer prediction accuracy comparison chart. The comparison is done with the proposed model and with other machine learning technique like Logistic Regression, Support Vector Machine,
Fig. 4. Comparison of accuracy with the proposed model and other studies
Fuzzy based logistic regression. Our proposed method exceptional in performance and obtain an accuracy of 97.6%. Hence, we can conclude that the performance of our proposed method in this study shows the best result as compared to the approach used by other authors on the same dataset
TABLE 6
Publications relevant to Machine Learning methods used for breast cancer survival prediction.
Author Methods Methods Accuracy
Liu, [6] Logistic Regression LR 90.48% Tapak et al. [5] Support Vector
Machine
SVM 93.00%
Nandagopal et al. [3] Fuzzy-based Logistic Regression
Fuzzy - LR
94.05% Proposed Ensemble
Technique
Random Forest RF 97.6%
Logistic Regression LR Deep Neural Network DNN
5.
C
ONCLUSION ANDF
UTUREW
ORK2824 physician to make optimum, timely and accurate decision. In
addition, we advanced the predictive model by validating the disease results using supervised machine learning methods and achieved good accuracy. For the advancement of the predictive model, we used three different classifiers, such as logistic regression, random forest and deep neural network, as an ensemble method. As a result, the proposed ensemble predictive modelling system help to enhance the quality of life by predicting breast cancer in an early stage. In order to improve the performance of the classification techniques, further research in this field will be carried out so that more variables can be predicted. This research will help to make disease prediction and diagnostic systems more effective and reliable, leading to the development of a better healthcare system by reducing fatalities. Furthermore, the proposed method can also be used to predict many other diseases like diabetes, trauma patients, heart disease, Alzheimer's disease, etc., which will be a future focus of our research.
REFERENCES
[1] C. B. Johnson, M. K. Davis, A. Law, and J. Sulpher, ―Shared Risk Factors for Cardiovascular Disease and Cancer: Implications for Preventive Health and Clinical Care in Oncology Patients,‖ Can. J. Cardiol., vol. 32, no. 7, pp. 900–907, Jul. 2016.
[2] A. K. Biz, ―Potential Novel Molecular Targets for Breast Cancer Diagnosis and Treatment,‖ Karolinska Institute, 2016.
[3] V. Nandagopal, S. Geeitha, K. V. Kumar, and J. Anbarasi, ―Feasible analysis of gene expression –a computational based classification for breast cancer,‖ Measurement, vol. 140, pp. 120–125, Jul. 2019.
[4] B. K. Singh, ―Determining relevant biomarkers for prediction of breast cancer using anthropometric and clinical features: A comparative investigation in machine learning paradigm,‖ Biocybern. Biomed. Eng., vol. 39, no. 2, pp. 393–409, Apr. 2019.
[5] L. Tapak, N. Shirmohammadi-Khorram, P. Amini, B. Alafchi, O. Hamidi, and J. Poorolajal, ―Prediction of survival and metastasis in breast cancer patients using machine learning classifiers,‖ Clin. Epidemiol. Glob. Heal., Oct. 2018.
[6] L. Liu, ―Research on Logistic Regression Algorithm of Breast Cancer Diagnose Data by Machine Learning,‖ in 2018 International Conference on Robots & Intelligent System (ICRIS), 2018, pp. 157–160.
[7] S. K. Jain and B. Bhaumik, ―An Energy Efficient ECG Signal Processor Detecting Cardiovascular Diseases on Smartphone,‖ IEEE Trans. Biomed. Circuits Syst., vol. 11, no. 2, pp. 314–323, Apr. 2017.
[8] L. R. Marchand and J. A. Stewart, ―Breast Cancer,‖ in Integrative Medicine, Elsevier, 2018, pp. 772-784.e7. [9] J. Müller-Nordhorn and S. N. Willich, ―Coronary Heart
Disease,‖ in International Encyclopedia of Public Health, Elsevier, 2017, pp. 159–167.
[10]D. W. H. Wolberg, ―Breast Cancer Wisconsin (Diagnostic) Data Set,‖ 2019.
[11]L. Liu, ―Research on Logistic Regression Algorithm of Breast Cancer Diagnose Data by Machine Learning,‖ in 2018 International Conference on Robots & Intelligent System (ICRIS), 2018, pp. 157–160.
[12]M. Peker, A. Arslan, B. Sen, F. V. Celebi, and A. But, ―A novel hybrid method for determining the depth of anesthesia level: Combining ReliefF feature selection and