Abstract—This paper represent interconnection of 16
Megawatt [MW] Mega-Solar with a dedicated control system to a grid. The Photovoltaic (PV) are connected to DC/DC buck-boost converter with Perturb and Observe (P&O) Maximum Power Point Tracking(MPPT) controller. For controlling the DC/AC inverter, reference controller (abc-controller) and hysteresis current control are used. When amount of the connected Mega-Solar increased, as a result of the simulation, it become obvious that the reactive power of main grid (weak power system) is consumed and the voltages rise at the connected bus. In this study, first we controlled the voltage and current with dedicated control system and get maximum power from Mega-Solar. Second, we interconnect our Mega-Solar site to IEEE 30 Bus Test System (Weak power system) as main grid and by decomposition control strategy solved the problem of reactive power shortage. In this paper, all simulation designed in MATLAB/SIMULINK. For simulation of an actual power system, for the first time, a simulation model of the IEEE 30 Bus Test System on the MATLAB/SIMULINK environment its developed and its effectiveness is verified through various simulation results.
Index Terms—Mega-solar, interconnection, weak power
system, decomposition.
I. INTRODUCTION
Since July 2012, the Japanese electric power companies agreed to purchase a huge amount of renewable energies such as solar, wind, geothermal, etc. to fulfill the lack of generation supplied by stopped nuclear power plants due to Great East Japan Earthquake and Tsunami occurred on March 11th, 2011. The purchasing power from RE (renewable energy) has already started. However there are many issues and risks accompanied with such decision, however none of them really considered seriously because of rush replacement of nuclear power with attention energies.
One of the renewable energy that Japanese companies consider on it seriously is Mega-Solar generation, which includes reality and problems. About reality of Mega-solar is before April 2013 the price which Japanese companies started to pay for 1[kW] of total renewable energy was 42 yen and currently the price for 1[kW] is 38 yen and they decided to pay for 1[kW] 27 yen in future. It is quite natural that many companies rush to participate in the Mega-solar business also current purchase of RE in Japan is 2 times higher than
Germany. Since Jan 2013, 1,024 Mega-solar plants is planned total capacity of Mega-solar will be 5.750[GW]. This amount of capacity is equal to 6 nuclear power generation plants with total investment about 1,500 billion yen excluding land price. For this reason, many electronic and investment companies interests on Mega-Solar business. One of the problem of interconnection was stated that some Japanese electric companies have declared that many investors and contractors are rushing to contract selling their renewable energy power to the utilities. However, they can only purchase ¼ of the electricity from Mega-Solar because interconnection limitation. As a result, when huge amount of power the reactive power of main grid is consumed and the voltages raised at the connected bus and frequency of the main grid dropped. PV system should be controlled in two ways: First using MPPT control system to control the different outputs of PV to reach and track the maximum power. Second, control DC/AC Inverter to control voltage, current and active power then connect PV to nearest utility grid. In this paper, we consider on two case study;
Case 1: We connect Mega-Solar site to the gird with dedicated MPPT controller and DC/AC Inverter controller consider to control voltage and current of Mega-Solar.
Case 2: We connect the Mega-Solar to IEEE 30 Bus test system (Weak Power System) to consider on Interconnection limitation such as shortage of reactive power in grid. For this reason, we try to solve this issue by decomposition the Mea-Solar to a grid.
Recently, many researches have been done on performance analysis and production forecast of PV plants [1] performance prediction of PV array[2], optimal allocation of Mega-Solar [3]. However, none of above work consider on Interconnection Issues of Mega-Solar. All simulation of this study is designed in MATLAB SIMULINK. The authors believe the present study will help the electronic companies to handle huge amount of power without limitation connect to main grid without shortage of reactive power.
II. INTERCONNECTING MEGA-SOLAR TO A GRID WITH
DEDICATED CONTROL SYSTEM
The control structure of PV connected-grid is composed in two structure. First structure is MPPT which is main property is to extract maximum power from PV system. The second structure is DC/AC inverter control which main property is control voltage and active power and regulate reactive power injected into grid. In this paper, we used Perturb and Observe (P&O) algorithm for MPPT control and natural reference control (abc control) for inverter.
Decomposition of Mega-Solar for Interconnecting to a
Weak Power System
Amin Mohammadirad and Ken Nagsaka
Manuscript received April 30, 2016; revised August 24, 2016. Amin Mohammadirad is with the Department of Electronic and Information Engineering, Tokyo University of Agriculture and Technology, Tokyo, Japan (e-mail:[email protected]).
Read V(t),I(t)
ΔI=I(t)-I(t-Δt)
ΔV=V(t)-V(t-Δt)
ΔV=0
No Yes
ΔI/ΔV>-I/V ΔI=0
ΔI/ΔV=-I/V ΔI>0
No No
No Yes
Yes
Yes Yes
No
I(t-Δt)=I(t) V(t-Δt)=V(t)
Return
Increase Vref
Decrease Vref Increase Vref Decrease Vref
Fig. 1. Algorithm of P&O method.
The Perturb and Observe (P&O) algorithm is considered as the most commonly used methods in practice, mostly because of its easy implementation. In fact, it simply requires the measurement of the PV generator characteristics and applying a perturbation leading to a direction change of the operation point. Basically the optimal operation is when (dP/dV)>0 and the operating voltage of PV array is perturbed in specific direction the perturbation moves to the operating and when n (dP/dV) <0 the perturbation moves to operating point of PV array from the maximum and the P&O method reverse the direction of the perturbation[4]. Fig. 1 Shown the algorithm of perturb and observe method for MPPT calculation in MATLAB/SIMULINK.
+/-PI Controller
PI Controller
Dq to abc
Transformation
V
DCQ
V
dc*
Q*
I
d*
I
q*
ωt
Fig. 2. Natural reference control strategy.
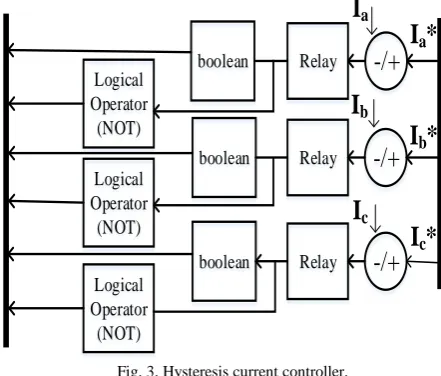
In the natural reference control strategy (abc-control), an individual controller is applied to each grid current. However, the configurations of the three-phase system structure, e.g. delta, star with or without isolated neutral, etc., pose a challenge for the design of the three individual current controllers. A possible implementation of abc-control is shown in Fig. 2 where the DC-link voltage is controlled to then, the current references in dq-frame are transformed into three current references using the inverse Park transformation and the phase angle of the grid voltages. Each of the current references is compared with the corresponding measured grid current, and the error goes into the current controller which we used hysteresis current controller[5], [6] these are passed to a hysteresis band current controller to generate the inverter gating signals needed to track the assembled current reference shown in Fig. 3.
The hysteresis controller is one of the preferred controllers in current control loop due to its high dynamic response as
required for inner control loop of cascaded structure. One of the possible implementation with fixed band hysteresis controller in stationary abc frame is depicted [7].
I
bI
cboolean
I
a*
I
b*
I
c*
-/+
-/+
-/+
I
aRelay
Relay
Relay boolean
boolean Logical
Operator (NOT) Logical Operator (NOT)
Logical Operator (NOT)
Fig. 3. Hysteresis current controller.
LCL filter a common grid filter used in industry. It allows lower switching frequency for the converter. It also gives better decoupling between filter, grid impedance and lower current ripple across the grid inductor. The dynamic control of inverter with LCL-filter is more complicated than L-filter. As the additional two poles and zeroes in LCL-filter can lead to instability in control system, active or passive damping method is usually implemented to mitigate this issue[7]-[10]. The control scheme for three phase grid-connected PV system shown in Fig. 4.
III. SIMULATIONS AND RESULTS
A. MPPT for Proposed Mega-Solar
The PV module and series resistance and shunt resistance parameters which used for simulation purpose shown in Table I.
TABLE I: CRYSTALLINE PV MODULE PARAMETERS Type of the Module Multi-Crystalline YINGLI
Solar YL255p-29b Rated Power Output Pmax 255 [W]
Maximum Voltage Vm 30.6[V]
Maximum Current Im 8.32[A]
Open-Circuit Voltage Voc 38.7[V]
Short-Circuit Current Iscr 8.88[A]
Temperature Coefficient of Voc -0.33[%/℃]
Temperature Coefficient of Iscr 0.06[%/℃]
Total Number of Series Cells in Module
1
Total Number of Parallel Cells in Module
54
Series Resistance RS 0.25[Ω]
Shunt Resistance RP 220[Ω]
The I-V and P-V characteristics of selected PV module in different irradiation is shown in Fig. 5 and 6.
Buck-Boost Converter as the output voltage of a PV is usually smaller than its load, therefore, the DC/DC buck- boost converter is used mostly for obtaining MPPT for PV systems. The DC/DC buck-boost converter is switched-mode converter which cycles the operation of an electrical switch on and off. The output voltage of the converter has opposite polarity of the input voltage. The output voltage magnitude of
the buck-boost converter could be higher or less than source voltage depending on duty ratio of the switch. DC/DC buck-boost converter with control method of maximum point tracking can operate voltage at maximum power point of the PV module. The DC/DC buck-boost Converter parameters and calculations in this paper is based on the reference [11].
PV
DC/DC Buck-Boost
Converter
DC/AC
Inverter Grid
LCL Filter
Transformer
Phase Lock Loop
Va,b,c
ωt
P&O MPPT Control
VDC
+/-PI Controller
PI Controller Dq to abc
Transformation
VDC
Q Vdc*
Q* Id*
Iq*
ωt
Ia
Ib
Ic
Ic
boolean
Ib
Ia,b,c
Ia*
Ib*
Ic*
-/+
-/+
-/+
Ia
Relay
Relay
Relay boolean
boolean Logical
Operator (NOT) Logical Operator (NOT)
Logical Operator (NOT)
Natural Reference Control (abc-control)
Hysteresis Current Control
Fig. 4. The control scheme for three phase grid-connected PV system.
Curr
e
nt
of
M
odul
e
[
A
]
Voltage of Module [V]
1000[W/m2
]
600[W/m2
]
400[W/m2
]
200[W/m2
] 800[W/m2
]
3 2 1 0 5 4 6 7 8 9 10
5 10 15 20 25 30 35 40
Fig. 5. I-V characteristic of PV Module in different irradiation.
P
ow
er of M
odul
e
[
W
]
Voltage of Module [V]
1000[W/m2]
600[W/m2]
400[W/m2]
200[W/m2]
800[W/m2]
50
0 150
100 200 250 300
5 10 15 20 25 30 35 40
Fig. 6. P-V characteristic of PV Module in different irradiation.
B. Buck-Boost DC/DC Converter with P&O MPPT Control
The selected Mega-Solar site includes five 4[MW] PV
system which connected to DC/DC converter separately. The Fig. 7 shows the model of PV system which is connected to the DC/DC buck-boost converter with P&O MPPT control method in MATLAB/SIMULINK. The input parameters of the PV system is different solar irradiations and constant temperature. The selected site annual average temperature is about 20[℃] [12]. The simulation results, the maximum power of each PV systems which connected to DC/DC buck-boost converter separately, total maximum power of the selected Mega-Solar site by considering MPPT, are shown in Table II.
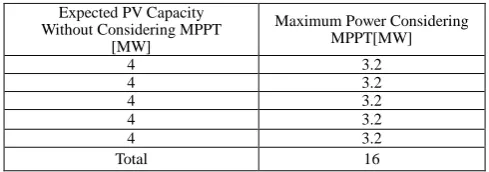
TABLE II: EXPECTED GENERATION POWER OF THE PROPOSED MEGA-SOLAR CONSIDERING MPPT
C. Interconnection of 16[MW] Mega-Solar to Main Grid (Case 1)
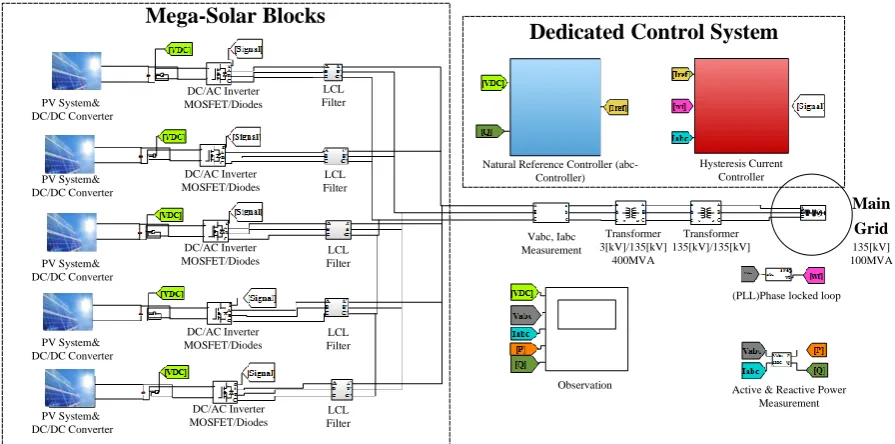
As the result of expected generation power in Table II the selected Mega-Solar site maximum power considering MPPT is 16[MW] which includes five blocks of PV system shown in Fig. 8. Each block is separately controlled and connected together to main grid. In this model, the green subsystem is natural reference control (abc-control), the red subsystem is hysteresis current controller. In natural reference controller
Expected PV Capacity Without Considering MPPT
[MW]
Maximum Power Considering MPPT[MW]
4 3.2
4 3.2
4 3.2
4 3.2
4 3.2
we set value of reference reactive power (Q*) to 0 and reference voltage at 3.5[kV] to make system voltage fixed. The hysteresis current controller output passed to a hysteresis band current controller to generate the inverter gating signals needed to track the assembled current reference. The step-up transformer used in this model is two windings transformer type step-up the voltage from 3.5[kV] to 135[kV] and the
nominal power is 400MVA. The main grid is 100[MVA]/135[kV] distribution system. The 16[MW] Mega-Solar connected to main grid with controllers shown in Fig.8. The active power, voltage and current of 16[MW] Mega-Solar before and after the grid-connection are shown in Fig. 9, 10, 11respectively.
Irradiation
Temperature
P&O Controller with PI Controller and PWM Generator
Buck-Boost DC/DC Converter
PV Output Voltage, Current, Power Measurement Powergui
Fig. 7. PV system connected to DC/DC converter with P&O MPPT control.
PV System& DC/DC Converter
DC/AC Inverter MOSFET/Diodes
DC/AC Inverter MOSFET/Diodes
DC/AC Inverter MOSFET/Diodes
DC/AC Inverter MOSFET/Diodes
DC/AC Inverter MOSFET/Diodes
LCL Filter
LCL Filter PV System&
DC/DC Converter
PV System& DC/DC Converter
PV System& DC/DC Converter
PV System& DC/DC Converter
LCL Filter
LCL Filter
LCL Filter
Natural Reference Controller (abc-Controller)
Hysteresis Current Controller
Vabc, Iabc Measurement
Transformer 3[kV]/135[kV]
400MVA
Transformer 135[kV]/135[kV]
Main Grid
135[kV] 100MVA
(PLL)Phase locked loop
Active & Reactive Power Measurement Observation
Dedicated Control System
Mega-Solar Blocks
Fig. 8. Grid-connected mega-solar total system in MATLAB/SIMULINK.
0 8 10 12
6
4
2 16
14
A
ct
ive
P
ow
er
[MW
]
0 2 4 6 8 10 12 14 16 18 20
Time[s]
Fig. 9. Active power of connected 16[MW] mega-solar.
D. IEEE 30 Bus Test System (Case 2)
The IEEE 30 Bus Test System represents a portion of the
total installed capacity of the IEEE 30 Bus Test System is about 189.2[MW], so in order to use this model system; we should modify the total capacity to be adjust to our problem.
Voltage[kV]
Current [A] 0
1 2 3
-1 -2 -3
0 2000 3000 4000
-1000 -2000 -3000 1000
-4000
Fig. 10. Zoom in voltage and current between LCL filter and transformer.
0 +135
0 100 150
-50 -100 -150 -135
50
Voltage[kV]
Current [A]
Fig. 11. Zoom in voltage and current of main grid 135[kV].
Recently, many researches are done using MATLAB/SIMULINK, so we thought of developing an IEEE 30 Bus Test System which can be run on MATLAB/SIMULINK and the results can be seen graphically with great flexibility. The authors believe so far, there is not such a model on the MATLAB/SIMULINK and this is the first one developed so far by authors. In this research, we could successfully and newly develop the model and connected the Mega-Solar for further simulation. By the simulation, we investigated the penetration limits of a Mega-Solar connected to power grid. The benefits using this model on the SIMULINK is; it consists of various elements such as power supply, bus, transformer, loads and many modules that can be combined freely and easily. It became possible to observe in detail in state of any elements Also, many states such as faults and other phenomena which may happen in the large-scale power system with large interconnection PV and other renewable energies can be analyzed. Using this model, we will be able to increase the penetration limits of a Mega-Solar be removing the causes.
Currently, the development of IEEE 30 Bus Test System simulation model [13] has been completed. Fig. 12 shows the complete developed IEEE 30 Bus Test System operation on MATLAB/SIMULINK.
In addition, voltage, current, active power, reactive power, frequency can be measured at any point. Table III shows an example of system voltage simulation results which is compared with the traditional Newton Raphson result [14]. The low error between the traditional Newton Raphson and our proposed model demonstrate the effectiveness of our developed model. The details of the IEEE 30 Bus Test System components are shown in Fig. 12.
TABLE III: SIMULATION OF THE SYSTEM VOLTAGE AND THE ERROR BEFORE MEGA SOLAR INTERCONNECTION
Bus #
Demand Voltage Magnitude
P [MW]
Q [MVAR]
Newton Raphson Result
[pu]
Proposed Model Result [pu]
Relative Error
[pu]
1 - - 1.000 1.000 0.000
2 21.70 12.70 1.000 1.000 0.000
3 2.40 1.20 0.983 0.984 0.102
4 7.60 1.60 0.980 0.981 0.102
5 - - 0.982 0.982 0.000
6 - - 0.973 0.973 0.000
7 22.80 10.90 0.967 0.967 0.000
8 30.00 30.00 0.961 0.961 0.000
9 - - 0.981 0.982 0.102
10 5.80 2.00 0.984 0.982 0.203
11 - - 0.982 0.982 0.102
12 11.20 7.50 0.981 0.981 0.406
13 - - 1.000 1.000 0.000
14 6.20 1.60 0.977 0.973 0.409
15 8.20 2.50 0.980 0.979 0.102
16 3.50 1.80 0.977 0.975 0.205
17 9.00 5.80 0.977 0.975 0.205
18 3.20 0.90 0.968 0.968 0.000
19 9.50 3.40 0.965 0.964 0.104
20 2.20 0.70 0.969 0.968 0.103
21 17.50 11.20 0.993 0.993 0.000
22 - - 1.000 1.000 0.000
23 3.20 1.60 1.000 1.000 0.000
24 8.70 6.70 0.989 0.988 0.101
25 - - 0.990 0.990 0.000
26 3.50 2.30 0.972 0.972 0.000
27 - - 1.000 1.000 0.000
28 - - 0.975 0.976 0.103
29 2.40 0.90 0.980 0.980 0.000
30 10.60 1.90 0.968 0.968 0.000
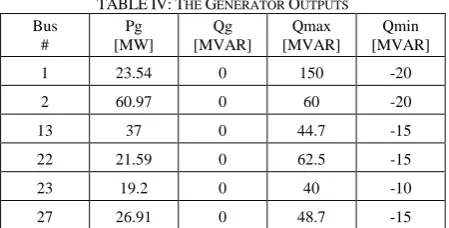
The “Red blocks” are the generators. In actual power system, it is equivalent to the large-scale power plants. It implements a 3-phase simplified synchronous machine. Machine is modeled as an internal voltage behind the R-L impedance. Stator windings are connected in wye to an internal neutral point. In this model, there are six power generations G1 through G6. Swing type G1 can change its power output to keep the balance of supply and demand. However, the output values of G2 to G6 are kept fix. The generator outputs are presented in Table IV.
TABLE IV: THE GENERATOROUTPUTS Bus
#
Pg [MW]
Qg [MVAR]
Qmax [MVAR]
Qmin [MVAR]
1 23.54 0 150 -20
2 60.97 0 60 -20
13 37 0 44.7 -15
22 21.59 0 62.5 -15
23 19.2 0 40 -10
Fig. 12. Designed IEEE 30 bus test system on Simulink by the authors for first time.
There are 31buses in this model. Bus1 to Bus30 are higher level system buses (all 135kV). Bus31 which Mega Solar is connected is called Mega Solar bus. The output voltage of the Mega Solar bus is boosted to 135kV by the transformer.
The “Purple blocks” are the transformers. This block implements a three-phase transformer composed of three single-phase transformers. We can set the winding connection to 'Yn' when we want to access the neutral point of the Wye. It should be noted that in this simulation model, only the higher level system is represented and the lower level system is omitted. That’s the reason why all buses are boosted to 135kV by the transformer. The “Gray blocks” are the loads. Loads are the large-scale factories and a set of houses. For each, a three-phase series RLC load is implemented. In this model, there are 20 loads (load 1 to load 20) in which they don’t change and are kept fix. The load consumptions are shown in TableIII as Demand. Block that appears in the image of the PV is a Mega Solar. It can provide any output. Solar power output is varied by the irradiation and temperature.
For voltage and frequency, the quality of power flow of Mega Solar and power system is consistent by adjusting the inverter. Parameters required in the design of the transmission line are mainly resistance, reactance, and capacitance. By reference to the value at 1km, it is possible to set the values for any length.
Regarding the data, we referred to the parameter data of generators, loads, and branches provided by Iraj Dabbagchi of AEP and entered in IEEE Common Data Format by Rich Christie at the University of Washington[15]. However, it has been published from the same research team that the line impedances were incorrect and the data has not been run through a power flow to check the answers. Therefore, in this study, we have adopted the set value in MATPOWER which is the embedded power flow calculation software of MATLAB.MATPOWER data is based on two papers [16], [17].According to this data, generator locations and bus areas were improved from IEEE 30 Bus Test System. Branch parameters were rounded to nearest 0.01. Shunt values were
divided by 100. Shunt on Bus 10 was moved to Bus 5. Load at Bus 5 was zeroed out.
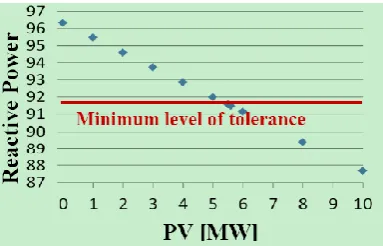
In this simulation, the electric power with a Mega Solar connected to the Bus 2 was performed. Main Grid together with the Mega Solar supply power to the Load 2 and other loads. In this simulation, one of our main objectives was to investigate what kind of influences it may cause to the active and reactive power of Main Grid as well as the bus voltage when the electric power from the Mega Solar increases from 0 to 10 MW. The obtained results of this simulation are shown in Table V and Fig. 13. In addition, the red line in Fig. 13 shows the minimum of tolerance level which calculated in pervious paper [18].
Table V clearly shows that the active power of Main Grid decreases gradually in proportion with the increase of the Mega Solar. On the other hand, the bus voltage remained unchanged at 135kV and did not reach the maximum or minimum levels. Interesting to know, it was expected that it will reach to the maximum when the Mega Solar increases, since the monotone increase of the bus voltage is carried out with the increase in Mega Solar.
TABLE V: INFLUENCE OF MEGA SOLAR CHANGE ON THE MAIN GRID ACTIVE, REACTIVE POWER AND VOLTAGE
Mega Solar [MW]
Active Power [MW]
Bus Voltage
[kV]
Reactive Power [MVAR]
Operational Status
0 68.73 135 96.33 usual
1 67.24 135 95.46 usual
2 65.74 135 94.6 usual
3 64.25 135 93.73 usual
4 62.75 135 92.87 usual
5 61.26 135 92 usual
5.5 60.51 135 91.57 usual
5.57 60.41 135 91.51 usual
5.6 60.37 135 91.48 unusual
6 59.77 135 91.14 unusual
8 56.78 135 89.41 unusual
Fig. 13. Mega solar vs reactive power.
Moreover, from Fig. 13, the reactive power of Main Grid is descending with the increase of the Mega Solar. Reactive power was reached to 91.51 MVAR when the active power of the Mega Solar was set to 5.57 MW. This is just a minimum tolerance level. On the other hand, beside Bus2, the changes in the other buses have not exceeded the limit. Based on the obtained results, it became obvious that the penetration limit of the Mega Solar introduced in the IEEE 30 Bus Test System is 5.57 MW. This value is almost 3% of the total installed capacity (189.2 MW).
E. Interconnection 16[MW] Mega-Solar to the IEEE 30 Bus Test System (Weak Power System) with Decomposition Power
As the results of Table V, penetration limit of the Mega Solar introduced in the IEEE 30 Bus Test System is 5.57 [MW]. Our Mega-Solar expected power generation is 16[MW].This means when we connected our Mega-Solar to IEEE 30 Bus test system, it is obvious we will face shortage of reactive power in main grid. For this reason, we try to decomposition our total Mega-Solar power to smaller amount (less than limitation 5.57[Mw]) to solved the problem of reactive power shortage. The control strategy scheme shown in Fig. 14.
16[MW] Mega-Solar
PV1 PV2 PV3 PV4 PV5
Time
P
owe
r PV1 PV2 PV3 PV4 PV5
0 1 2 3 4 5
3
.2
[MW
]
3
.2
[MW
]
3
.2
[MW
]
3
.2
[MW
]
3
.2
[MW
]
Delay Time:0.05[s] Three Phase Breaker
with External Control Decomposition
Power:
Grid (IEEE 30 Bus
Test System)
Connecting Bus
Fig. 14. The decomposition control scheme.
The red blocks is Mega-Solar which includes five PVs which connected to the three-phase breaker with external control. The three-phase breaker block implements a three-phase circuit breaker where the opening and closing times can be controlled either from an external signal (external control mode), or from an internal control timer (internal control mode).The Three-Phase Breaker block uses three Breaker blocks connected between the inputs and the outputs of the block. You can use this block in series with the three-phase element you want to switch. The arc extinction
process of the Three-Phase Fault block is the same as for the Breaker block[19].The breaker include switching time which can help to set time for opening or closing at any time. The external control used in this model is unit step. The Step block provides a step between two definable levels at a specified time. By combination both controller first we controlled the PV output power, second we put short delay on it and send it one by one to main grid. The decomposition of Mega-Solar power result in MATLAB/SIMULINK shown in Fig. 15.The output of PVs is about 3.2[MW].This amount of power is less than limitation of Interconnecting Mega-Solar and will solve the reactive shortage problem in Main grid. We set switching time to 1[s] and the delay time is about 0.05[s].This control method can be helps to solve the reactive power shortage problem in weak power system and deliver a huge amount power without any limitation to main grid smoothly.
P
ow
e
r
[
MW
]
3.2 PV1 PV2 PV3 PV4 PV5
0 1 2 3 4 5
Delay Time:0.05[s] Time
Fig. 15. Decomposition of mega-solar power.
IV. CONCLUSION
The PV systems power delivered smoothly to grid with Perturb and Observe (P&O) for MPPT control and natural reference controller (abc-controller) and hysteresis current. In this study, we tried to control active power, voltage and current of PV modules to deliver the maximum power to main grid with high efficiency and lower loss. Also, the reactive power shortage of weak power system problem solved by decomposition control strategy. Moreover, in order to simulate the actual power system, we constructed a simulation model of the IEEE 30 Bus Test System on MATLAB/SIMULINK environment. The authors believe, this study will help electronics and investments companies who they faced the interconnection problems such as reactive power shortage, attack current and increasing voltages issues in weak power system. One of the problem of interconnection was stated that some Japanese electric companies have declared that many investors and contractors are rushing to contract selling their renewable energy power to the utilities. However, they can only purchase ¼ of the electricity from Mega-Solar. As future study, we considering on storage, usage or transferring the power between micro grids with low cost and lower loss. The results will be presented in future publication.
REFERENCES
[1] F. Bizzari et al., “Model of photovoltaic power plantsfor perfomance analysis and production forecast,” IEEE Trasnaction on Sustainable
[2] W. Zhou et al., “A novel model of photovoltaic power array performance prediction,” Applied Energy, vol. 84, issue 12, pp. 1187-1198, 2007.
[3] S. Yokota and T. Kumano, “Mega-solar optimal allocation using data envelopment analysis,” IEEJ Transactions on Power and Energy, vol. 131, pp. 819-825, 2011.
[4] N. Agarwal “Design and SIMULINK of intelligent solar energy improvement with PV module,” International Journal of Information
computation Technology, vol. 4, pp. 619-628, 2014.
[5] O.-K. Teresa and B. Frede, Rodríguez: Advanced and Intelligent
Control in Power Electronics and Drives, p. 62, 2014.
[6] F. Blaabjerg, R. Teodorescu, M. Liserre, and A. V. Timbus, “Overview of control and grid synchronization for distributed power generation systems,” Transaction on Industrial Electronics, vol. 53, no. 5, pp. 1398-1409, 2006.
[7] H. W. Low, “Control of grid connected active converter design of control strategies for grid synchronization inNorway,” Master’s thesis, Norwegian University of Science and Technology, pp. 20-22, 35-36, 2013.
[8] J. Lettl, J. Bauer, and L. Linhart, “Comparison of different filter types for grid connected inverter,” PIERS Proceedings, pp. 1426-1429, 2011.
[9] M. Liserre, F. Blaabjerg, and S. Hansen, “Design and control of an LCL-filter-based three-phase active rectifier,” IEEE Transaction on
Industrial Electronics, vol. 41, no. 5, pp. 1281-1291, 2005.
[10] T. C. Y. Wang et al., “Output filter design for a grid-interconnected three-phase inverter,” IEEE Power Electronics Specialist Conference, vol. 2, pp. 779-784, 2003.
[11] Lunghwa University of Science and Technology. (2011). Establishment and study of a photovoltaic system with the MPPT
function. [Online]. Available:
https://www.lhu.edu.tw/m/oaa/synthetic/publish/publish/Function.pdf [12] A. Mohammadirad and K. Nagasaka, “Modelling a 20MW scale solar farm in an unused angled area near Fukushima nuclear power plant,” in
Proc. International Conference on Advanced Mechatronic Systems,
pp. 194-199, August.2015
[13] P. Kannan et al., “Voltage sag compensation of thirty bus system using unified power flow controller,” European Journal of Scientific
Research, vol. 51, no. 3, pp. 372-382, 2011.
[14] Y. Hayashi et al., “Design and simulation of transmission grid inter-connected off-Shore wind power,” Japan Society of Energy and
Resources, vol. 29, 2013.
[15] R. D. Christie. Power systems test case archive. [Online]. Available: http://www.ee.washington.edu/research/pstca/pf30/pg_tca30bus.htm
[16] O. Alsac and B. Stott, “Optimal load flow with steady state security,”
IEEE Transactions on Power Apparatus and Systems, vol. 93, no. 3,
pp. 745-75, 1974.
[17] R. W. Ferrero et al., “Transaction analysis in deregulated power systems using game theory,” IEEE Transactions on Power Systems, vol. 12, no. 3, pp. 1340-1347, 1997.
[18] Y. Ueno and K. Nagasaka, “Renewable energy penetration limits: Effect and solution issues for interconnected grid,” in Proc. the 1st
Asia Future Conference (AFC), 2013.
[19] Math Works Electrical Sources and Elements. Implement Three-Phase
CircuitBreaker. [Online]. Available:
http://jp.mathworks.com/help/physmod/sps/powersys/ref/threephaseb reaker.html
Amin Mohammadirad received his B.S and M.S degrees in electrical electronics from Kokushikan University in 2010 and 2012 respectively. Since 2013, he is working toward his PhD degree in the Department of Electronic and Information of Tokyo University of Agriculture and Technology, Tokyo, Japan. His interest research is on renewable energies particularly on mega-solar field.
Ken Nagasaka obtained his PhD in electrical