Abstract—This study aims to assess the PM10 emission emitted and the spatial and temporal distribution of PM10 emissions from forest fire during the 2005-2009 periods. The active fire product is known as fire hot spots (FHS) from MODerate-resolution Imaging Spectro-radiometer (MODIS) sensor were used to assess the forest fire areas in Thailand. During this period, Active fires was detected nearly 87,000 FHS with a highest significant in the deciduous forest, corresponding with a damaged forest area of about 78,200 km2 and about 92% of it was burned habitually. The effecting of forest fire had resulted in a combusted surface fuel of approximately 22,388,000 tonns dry matter and PM10 emission was emitted at 187,331 tonns. The obtained results have been used occasionally as reference to develop risk area map of PM10. Risk area map is often use as a reference for many decision-making policies.
Index Terms—Forest fire, Emissions, Remote Sensing,
MODIS.
I. INTRODUCTION
Thailand has been experiencing theusual hazy weather which effects on the human health and obscure visibility.It occurs every year as thedryseason kicksoff and farmers continue to use slash and burn techniques. Fire has been set by villagers who believe that the burning and subsequent ash will stimulate wild mushroom growth [1]. The urban population was severely affected by the particulate matter from forest fire. Measurements from monitoring station in the northern of Thailand show that the PM10 concentrations
were ranked between 120-360 µg/m3 which exceed about 2 to 3 times of PM10 standard [2]. The particulate matter is
made up of a combination of air pollutants that can compromise human health, harm the environment, and
Manuscript received on March 15, 2011.
Junpen A. is with the Joint Graduate School of Energy and Environment Center for Energy Technology, King Mongkut’s University of Technology Thonburi Bangkok, Thailand; Center for Energy Technology, Ministry of Education, Thailand; Phone: +66 831890330 (e-mail: [email protected]).
Garivait S. is with the Joint Graduate School of Energy and Environment Center for Energy Technology, King Mongkut’s University of Technology Thonburi Bangkok, Thailand; Center for Energy Technology, Ministry of Education, Thailand; Phone: +66 891717749 (e-mail: [email protected]).
Bonnet S. is with the Joint Graduate School of Energy and Environment Center for Energy Technology, King Mongkut’s University of Technology Thonburi Bangkok, Thailand; Center for Energy Technology, Ministry of Education, Thailand; (e-mail: [email protected]).
Pongpullponsak A. is with the Department of Mathematics, Faculty of Science King Mongkut’s University of Technology Thonburi Bangkok, Thailand (e-mail: [email protected]).
even cause property damage. It causes health problem such as asthma, emphysema, chronic bronchitis and other respiratory problems as well as eye irritation and reduced resistance to colds and lung infections.
To control the PM10 concentration under the standard
level, we have to know the quantity of the particulate matter emitted and the spatial and temporal distribution of PM10
emission from forest fire. The estimation of PM10 emissions
emitted from forest fire depends on 4 main factors, included burned area (BA), biomass density or fuel combusted (BD), burning efficiency (BC), and emission factor (EF) [3].
For this study, the MODIS algorithm knows as MOD 14 developed by NASA for global detection of fires and suitable for day time detection, when peak fire activity exists to estimate burned area (BA) [4]. This study used the version 4.3.2 of MOD 14.
For the other activity data as biomass density (BD) and burning efficiency (BC), these data are received by taken part within many Forest Fire Control Division National Park Organizations in Chiengmai (The Northern part of Thailand) to do the site survey in the deciduous dipterocarp forest and mixed deciduous forest which has the maximum of forest fire occurred in Thailand [5]. The actual burning experiment had let to know the forest fire behavior in Thailand which was a different from forest fire occurred in the tropical forest in the Southeast Asia such as the type of fuel consumed, the combustion rate, and the combustion efficiency. There lacks of research on emission factor of forest fire, so this study used default value, reported by Andrea and Merlet [6].
This study intended to assess the PM10 emission emitted
and the spatial and temporal variation of PM10 emissions
from forest fire during the 2005 to 2009 periods. Finally, the result of spatial and temporal distribution of forest fire area was presented in the grid map (size of grid 10 km × 10 km). The result shows the affected areas from the PM10 emissions
of forest fire and the forest areas that fire occurred frequently as well as the risk areas. The assessment results have been assisting many decision-making policies and planning and controlling of forest fire management.
II. METHODOLOGY
A. PM10 Emission Estimation
The PM10 emission of forest fire is estimated based on (1).
EF
A
E
(1) Where E is the PM10 emission (tonns) from fuelcombustion, A is activity data of biomass burning as burned area and combusted fuel load, EF is the emission factor of
Spatial and Temporal Distribution of Forest Fire
PM
10
Emission Estimation by Using Remote
Sensing Information
PM10 (ton/unit of activity data). The activity data (A) depends
on three factors; burned area (BA), biomass density (BD), and burning efficiency (BC) as shown in (2).
EF
BC
BD
BA
E
(2)Where BA (km2) is size of forest fire area, BD (tonns/km2) is the density of fuel load per area, BC (dimensionless) is combustion factor, and EF (g/kg dry matter burned) is emission factor of biomass burning.
B. Burned Area (BA) Estimation
The forest fire area is estimated from the data of the MODIS Active Fire Product (MOD 14). The MODIS has flied onboard the polar orbiting satellites of Terra and Aqua, a part of the NASA Earth Observing System since 2005. The orbit of them overpasses daily on Thailand, 4 times per day. The overpass time is about 5 minutes. The overpass period varies on 1.00 am to 2.00 am, and 10.00 am to 11.30 am, 1.00 pm to 2.30 pm, and 10.00 pm to 11.00 pm [7]. These studies used 2 sources of FHS dataincluded Georeference position fromInformation for resource management system, University of Maryland during 2005 to 2006 and Geoinformatics center, Asia institute of technology during 2007 to 2009 [7].
The type of FHS was classified by using Geographic Information System (GIS) program. The type of fire included agricultural fire, forest fire, and other fire. The FHS was categorized by overlay between the FHS data and land use map in 2007 which was developed by Land Development Department, Thailand [8]. The resolution 1 km ×1 km of pixel was used as a representative of one spot of burned area. The combustion efficiency of burned area in pixel, which is a measure of how efficiently a device consumes fuel, was about 0.9 [9].
Finally, the results of spatial and temporal distribution of forest fire area were presented in the grid map (size of grid 10 km ×10 km) which covered the period of 2005 to 2009.
C. Biomass Density (BD) Estimation
The surface fuel load in the dipterocarp forest and the mixed deciduous forest were collected during2009. This study focuses only on surface fuel because the forest fire in Thailand is surface fire that specifically combusted fuel on surface area of forest [10].
There are 2 types of surface fuel, classified by size; fine fuel and coarse fuel. Fine fuel included dead leaf and grass. Course fuel included twig and undergrowth [10]. The experimental size is 1 m × 1 m, 60 sample plots per month.
The data shows the density of surface fuel classified by fuel component.
D. Burning Efficiency (BC) Estimation
The burning experiment was set in the mix deciduous and deciduous dipterocarp forests. The difference between the density of fuel load before burning and after burning was calculated by (3). The results represent the ratio of actual fuel load combusted by forest fire.
M
BBM
AB
M
BBBC
/
(3)Where BC is burning efficiency of surface fuel, MBB (g/m2)
is mass of dried surface fuel before burning, and MAB (g/m2) is
mass of dried surface fuel left after burning.
The experimental result is combustion factor. Moreover, it can be used to study behavior of forest fire. It is used to estimate the combustion rate of forest fire in term of burned area per time.
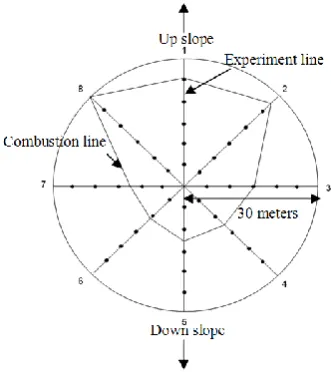
For experiment, this study sets an experiment line in the forest area, as shown in Fig 1. There are 8 lines. Each line has 30 m length and 45° between lines equally. The experiment is plotted in 4 area slopes as 0-14%, 15-24%, 25-35%, and >35% by testing in 2 forest types as the mix deciduous forest and the deciduous dipterocarp forest. The experiment is done every month between January and May in 2009. So, the overall sample is about 40 plots.
After set the sample plot, the 8 random plots, plot size 1 m × 1 m, around the experimental area is collected and weighted. The component of surface fuel is dead leaf, grass, twig, and undergrowth. The result shows in term of dry matter of fuel load per area classified by size of fuel; fine fuel (dead leaf and grass) and coarse fuel (twig and undergrowth).
Further experiment, start to fire at the center of the circle line and records the distance of fire in each line for every 2 minutes until once of line is burned to 30 m and stops the experiment. In this trail, data collections include: surface fuel weight after burning, combustion time, and burned area.
After burning process, the mass of unburned fuel in 8 plots, 1 m × 1 m is measured, then estimate the combustion factor from the relationship between before and after burned of surface fuel as shown in (3).
E. Emission Factor (EF)
The emission factor (EF) for tropical forest was reported by Andrea and Merlet (2001). In this study, EF was nearly 11.3 g/kg of dry matter burned.
Figure 1. 1 The experimental plot
III. RESULTS AND DISCUSSION
A. Burned Area (BA) Assessment
in 2007 which was about 22,924 FHS or forest fire area 20,632 km2 (Table 1).
TABLE I. THE NUMBER OF ACTIVE FIRE AND FOREST FIRE AREA
Year Number of Active Fire (FHS)
Burned Area (km2)
2005 16,657 14,991
2006 16,909 15,218
2007 22,924 20,632
2008 14,621 13,159
2009 15,766 14,189
Total 86,877 78,189
Considering on the temporal distribution of forest fire (Fig.2), it was found annuallythe peak period of forest fire was between January and April which maximum in March. This period is the dry season in Thailand. The surface fuel is rather dry. It is easily combusted.
0 2,000 4,000 6,000 8,000 10,000 12,000 14,000 16,000 Ja n -0 5 M a y -0 5 S e p -0 5 Ja n -0 6 M a y -0 6 S e p -0 6 Ja n -0 7 M a y -0 7 S e p -0 7 Ja n -0 8 M a y -0 8 S e p -0 8 Ja n -0 9 M a y -0 9 S e p -0 9 N um be r of F or es t F ir e ( ti m es )
Figure 2. The temporal distribution of forest fire, 2005-2009.
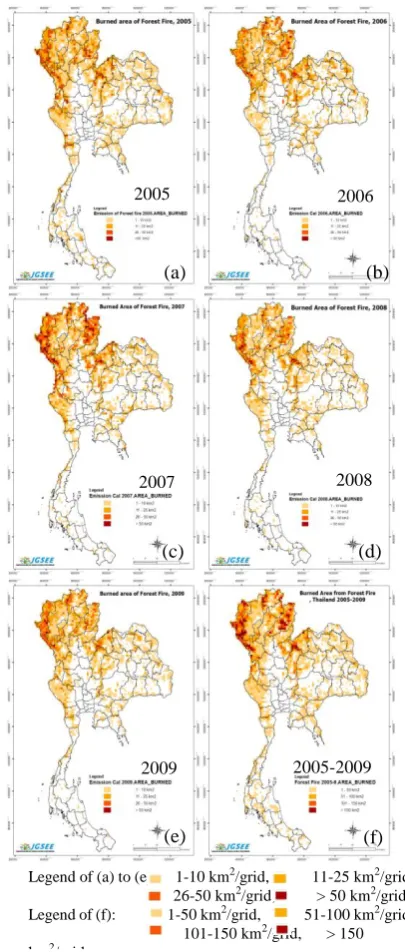
Taking into consideration on the spatial distribution of forest fire area between 2005 and 2009 (Fig.3), it was found the high density of forest fire area (burned area ≥ 26 km2 per grid as shown in the dark grid) occurred in the mixed deciduous forest and the deciduous dipterocarp forest especially in the Western, the Upper-Northern, and the Upper-Northeastern part of Thailand. For the general density of forest fire area (burned area ≤ 25 km2 per grid as shown in the light grid), it occurred in the evergreen forest, the mixed deciduous forest, the deciduous dipterocarp forest and the pine forest which were near the forest fire control center. The fire-starting were controlled immediately by fire control officer.
The accumulation forest fire area during 2005 to 2009, it was found the high density of forest fire area (burned area ≥ 100 km2 per grid) was about 34% of the actual forest fire map. We had found that the high density emerged in the mix deciduous forest and deciduous dipterocarp forest at The Upper-Northern, the Western, and the Upper-Northeastern of Thailand.
B. Biomass Density (BD) Assessment
The 4 components of fuel load are collected monthly in 2009. From the data analysis on the temporal variation of 4 components of fuel load, it was found the fuel load has increased in the forest fire season (January-May) especially fine fuel as dead leaf because of the leave is shredded from the tree. In the rainy season, grass and undergrowth has a
high growth rate. The temporal variation of fuel load is shown in the Fig 4.
Figure 3. The spatial distribution of forest fire area, 2005-2009.
0 50 100 150 200 250 300 350
Jan Feb Mar Apr May Jun Jul Aug Sep Oct Nov Dec
Month, 2009 F u el l o ad ( to n d ry m at te r/ km 2 )
Dead leaf Grass Undergrowth Twig
Figure 4. The temporal distribution of biomass density classified by fuel component
This study estimates the forest fire emission through the amount of fuel load in the forest fire season (January-May).
Legend of (a) to (e): 1-10 km2/grid, 11-25 km2/grid 26-50 km2/grid, > 50 km2/grid Legend of (f): 1-50 km2/grid, 51-100 km2/grid 101-150 km2/grid, > 150 km2/grid
2005 2006
2007 2008
2009 2005-2009
(a) (b)
(c) (d)
The amount of fuel load at surface area in the mixed deciduous forest is about 364.5 tonns dry matter/km2, which included 214.4 tonns dry matter/km2 of fine fuel and 150.2 tonns dry matter/km2 of course fuel. For the deciduous dipterocarp forest, the fuel load is about 371.4 tonns dry matter/km2, which included 218.3 tonns dry matter/km2 of fine fuel and 153.1 tonns dry matter/km2 of course fuel. The fuel load and standard deviation is used to estimate the emission (Table 2).
TABLE II. BIOMASS DENSITY FROM FIELD SURVEY,2009
Forest type
Biomass Density (tonns dry matter / km2) Fine fuel Coarse fuel Total fuel
Mixed deciduous forest
214.4 150.2 364.5
SD = 57.5 SD = 45.5 SD = 68.5
Deciduous dipterocarp forest
218.3 153.1 371.4
SD = 55.4 SD = 43.3 SD = 65.6
C. Burning Efficiency (BC) Assessment
From the simulation of real fire in the forest area found the fine fuel as dead leaf and grass is burned more than coarse fuel. In the mixed deciduous forest and the deciduous dipterocarp forest, the average of fuel burned is about 0.78. The fine fuel is burned about 0.98 and the coarse fuel is burned 0.49. The value and standard deviation of burning efficiency used for forest fire emission estimation is shown in table 3.
TABLE III. BURNING EFFICIENCY FROM BURNING EXPERIMENT,2009
Forest type Burning efficiency Fine fuel Coarse fuel Average
Mixed deciduous forest
0.98 0.49 0.78
SD = 0.16 SD = 0.22 SD = 0.13
Deciduous dipterocarp forest
0.98 0.49 0.78
SD = 0.07 SD = 0.26 SD = 0.16
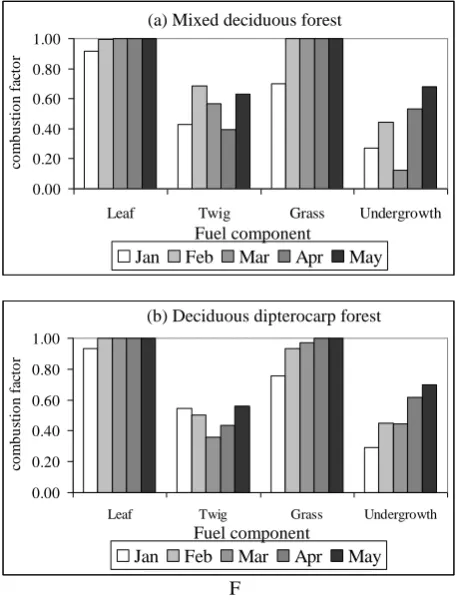
Considering on monthly burning efficiency in both forest types found dead leaf and grass has been completely burned since February. Twig, the dried fuel is unstable burned that the burning rate depends on the amount of twig in the area in each month. Undergrowth, the highest of moisture content, has burned increasing when the weather is drier. The result is shown in Fig.5.
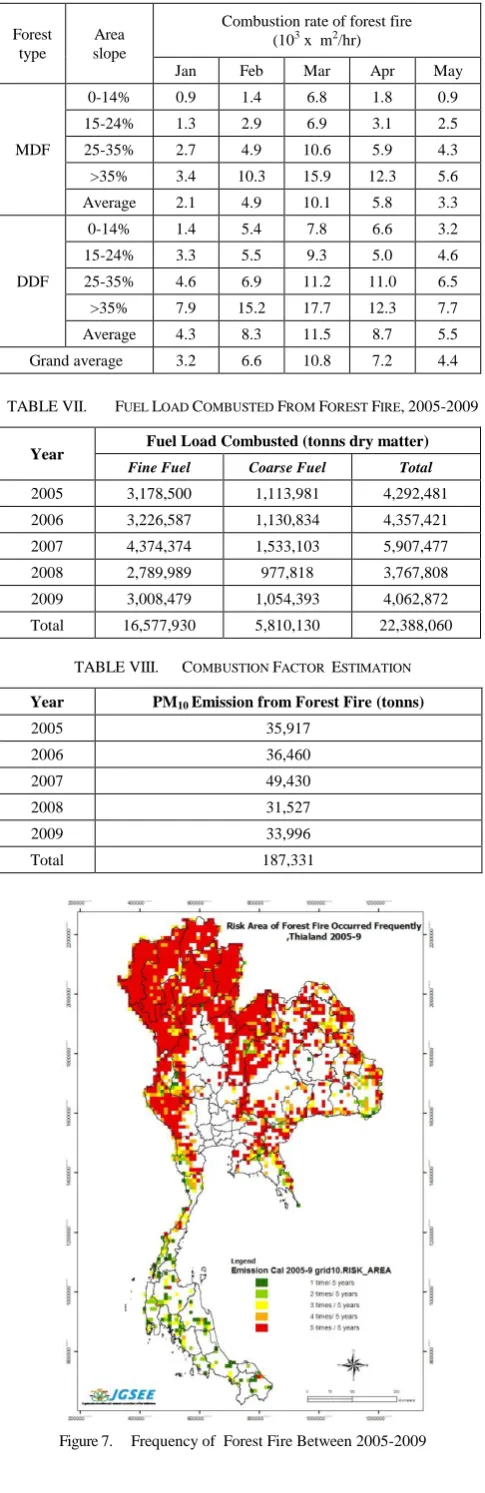
For the combustion rate of forest fire found the mixed deciduous forest (MDF) and the deciduous dipterocarp forest (DDF) has the highest of combustion rate in March which is about 10.1×10³ m2/hr and 11.5×10³ m2/hr, respectively, followed by April about 5.8×10³ m2/hr and 8.7×10³ m2/hr respectively. The result of combustion rate represented the spread of forest fire is very useful for firefighter to set the firebreaks for reducing the ultimate area size of forest fire. The combustion rate of forest fire is shown in table 4.
D. PM10 Emission Assessment
Forest fire during 2005-2009, the fuel load combusted was about 22,388,060 tonns dry matter which included 16,577,930 tonns dry matter of fine fuel and 5,810,130 tonns dry matter of coarse fuel (Table 5). The PM10 was emitted
approximately 187,331 tonns (Table 6).
For the yearly temporal variation of PM10, it was found the
trend of PM 10 between 2005 and 2009 was unstable. The
PM10 was increased during 2005-2007, and then dropped
down during 2008-2009.
F
Figure 5. The temporal distribution of biomass efficiency classified by fuel component
TABLE IV. FUEL LOAD COMBUSTED FROM FOREST FIRE,2005-2009
Year Fuel Load Combusted (tonns dry matter)
Fine Fuel Coarse Fuel Total
2005 3,178,500 1,113,981 4,292,481 2006 3,226,587 1,130,834 4,357,421 2007 4,374,374 1,533,103 5,907,477 2008 2,789,989 977,818 3,767,808 2009 3,008,479 1,054,393 4,062,872 Total 16,577,930 5,810,130 22,388,060
TABLE V. COMBUSTION FACTOR ESTIMATION
Year PM10 Emission from Forest Fire (tonns)
2005 35,917
2006 36,460
2007 49,430
2008 31,527
2009 33,996
Total 187,331
In view of the spatial distribution of PM10 (Fig.6), It was
found that the higher PM10 occurred in the higher of damaged
forest fire area. In the high density of forest fire area (> 26 km2 per grid) emitted more than 50 tonns of PM10 (as shown in the
dark grid). In the low density of forest fire area (≤ 25 km2 per grid) emitted 1-50 tonns of PM10. In case of observation, the
0.00 0.20 0.40 0.60 0.80 1.00
Leaf Twig Grass Undergrowth
Fuel component co m b u st io n fa ct o r
Jan Feb Mar Apr May
0.00 0.20 0.40 0.60 0.80 1.00
Leaf Twig Grass Undergrowth
Fuel component co m b u st io n fa ct o r
Jan Feb Mar Apr May
(a) Mixed deciduous forest
(b) Deciduous dipterocarp forest 0.00 0.20 0.40 0.60 0.80 1.00
Leaf Twig Grass Undergrowth
Fuel component co m b u st io n fa ct o r
Jan Feb Mar Apr May
Fuel component 0.00 0.20 0.40 0.60 0.80 1.00
Leaf Twig Grass Undergrowth
Fuel component co m b u st io n fa ct o r
Jan Feb Mar Apr May
density of grid PM10 was varied every year because of the
difference of cumulative of fuel.
The accumulation PM10 emission emitted during 2005 to
2009,the high density of PM10 emission emitted (more than
250 tonnes per grid) was about 34% of the actual emission map. It was nearly occurred around the settlement in the upper Northern, the Western, and the upper North-eastern. The result shows the risk of city area which is near the high density PM 10 emissions emitted has occurred a high PM10
concentrations.
Moreover,it was found 68% of forest fire was occurred five times in the same area, followed by 15% of forest fire was occurred four times in the same area (Fig.7). The result showed the occurrence of forest fires were repetitiously committed arson by human.
Figure 6. The spatial distribution of PM10 emission, 2005-2009.
TABLE VI. COMBUSTION RATE OF FOREST FIRE,2009
Forest type
Area slope
Combustion rate of forest fire (103 x m2/hr)
Jan Feb Mar Apr May
MDF
0-14% 0.9 1.4 6.8 1.8 0.9 15-24% 1.3 2.9 6.9 3.1 2.5 25-35% 2.7 4.9 10.6 5.9 4.3 >35% 3.4 10.3 15.9 12.3 5.6 Average 2.1 4.9 10.1 5.8 3.3
DDF
0-14% 1.4 5.4 7.8 6.6 3.2 15-24% 3.3 5.5 9.3 5.0 4.6 25-35% 4.6 6.9 11.2 11.0 6.5 >35% 7.9 15.2 17.7 12.3 7.7 Average 4.3 8.3 11.5 8.7 5.5 Grand average 3.2 6.6 10.8 7.2 4.4
TABLE VII. FUEL LOAD COMBUSTED FROM FOREST FIRE,2005-2009
Year Fuel Load Combusted (tonns dry matter)
Fine Fuel Coarse Fuel Total
2005 3,178,500 1,113,981 4,292,481 2006 3,226,587 1,130,834 4,357,421 2007 4,374,374 1,533,103 5,907,477 2008 2,789,989 977,818 3,767,808 2009 3,008,479 1,054,393 4,062,872 Total 16,577,930 5,810,130 22,388,060
TABLE VIII. COMBUSTION FACTOR ESTIMATION
Year PM10 Emission from Forest Fire (tonns)
2005 35,917
2006 36,460
2007 49,430
2008 31,527
2009 33,996
Total 187,331
Figure 7. Frequency of Forest Fire Between 2005-2009
2005 2006
2007 2008
2009 2005-2009
Legend of (a) to (e): 1-25 tonns/grid, 25.1-50 tonns/grid 50.1-100 tonns/grid, > 100 tonns/grid
Legend of (f): 1-100 tonns/grid, 100.1-250 tonns/grid 250.1-500 tonns/grid, > 500 tonns/grid
(a) (b)
(c) (d)
IV. CONCLUSION
This study demonstrates the satellite data is an essential tool for emission estimation of forest fire. MODIS sensor is suitable for monitoring on emission in national scale, because it enables to give efficient continuous data. It is also used to assess the spatial and temporal distribution of forest fire. Moreover, the simulation of forest fire contributes to understanding the tropical forest fire behavior for each region. The result will provide the more accuracy of forest fire emission estimation.
ACKNOWLEDGMENT
The authors would like to thank the Forest Fire Control Division National Park Organizations, Thailand. Funding for this research was provided by The Joint Graduate School of Energy and Environment, Thailand.
Lastly, we offer my regards and blessings to Pattarin Arunjitpimon and Penwadee Cheewaphongphan who supported our in any respect during the completion of the project.
REFERENCES
[1] Forest Fire Control Division National Park (2010) Forest fire statistic Thailand, Available: http://www.dnp.go.th/forestfire/index.htm . [2] Pollution control Division (2010) Air Quality statistic Thailand,
Available: http://www.pcd.go.th/AirQuality/Regional.
[3] Seiler, W., Crutzen, P.J., 1980. Estimates of gross and net fluxes of carbon between the biosphere and the atmosphere from biomass burning. Clim. Change 2, pp. 207-247.
[4] Justice, C.O., Giglio, L., Korontzi, S., Owens, J., Morisette, J. T., Roy, D., et al. (2002). The MODIS fire products. Remote Sensing of Environment, 83, pp.244−262.
[5] Pollution control department (2005) Monitoring and Assessment of Air Pollutant Emissions from Forest Fires in the Northern Region of Thailand, ch. 4.
[6] Andreae, M.O., Merlet, P. (2001) Emission of trace gases and aerosols from biomass burning. Global Biogeochemical Cycles, Volume 15, pp.955-966.
[7] Asian Institute of Technology, Geoinformatics Center, Available: http://www.geoinfo.ait.ac.th [Accessed January 2010]
[8] Land development department (2007) Landuse map of Thailand 2007. [9] Stefania Korontzi, David P. Roy, Christopher O. Justice, and Darold E. Ward (2004) Modeling and sensitivity analysis of fire emissions in southern Africa during SAFARI 2000, Remote Sensing of Environment, 92, pp.255–275.