Abstract—Built-up areas play a significant type of land use associated with the urbanization. Classifying the built-up area by using satellite image, is also a high demand for a relevant organization to investigate the urban sprawl. This study aims to develop an index used to classify the built-up areas accurately. In order to achieve the aim of the study, two objectives were intensively studied to compare the results from several indices used to appropriately classify the built-up areas from satellite data of Landsat 8. The second objective is to develop a built-up area index which is suitable for classifying the built-up areas. This study considers the two study areas, Bangkachao and Bangkok International Airport, which encounter the rapid urbanization. This study employs a satellite image of Landsat 8 OLI (Operational Land Imager (OLI). The Normalized Difference Vegetation Index (NDVI), Normalized Difference Built-up Index (NDBI) were intensively examined to present a BUI map correspondingly. On the other hand, Modified Normalized Difference Water Index (MNDWI) was tested to separate the water areas and wetlands from the built-up areas distinctively. Furthermore, the Modified Built-Up Index (MBUI) were developed based on the integration between the MNDWI and BUI map. As a result, it is clearly shown that the MBUI provides more accurate results of built-up area classification than the BUI. Also, the MBUI presents 82-83% accuracy of both study areas, which are higher than the BUI map. It is to say that MBUI can be employed to classify the built-up areas of the study areas accurately.
Index Terms—Built-up index, modified built-up index, GIS,
remote sensing.
I. INTRODUCTION
Satellite image has been used to investigate the environmental phenomena over the world. Satellite remote sensing has a number of potential applications across a broad range of environmental disciplines. Recently, Landsat 8 (OLI), the downloadable data has been intensively studied in a broad range of land use applications. Land use planning and change are the other crucial missions derived from the investigation of Landsat data. In order to plan for the change of the land use and land cover, classification technics have been studied continuously. Satellite images are usually converted into useful information such as land cover maps using two conventional methods: manual interpretation and computer-assisted digital processing. Image interpretation can be done visually which is a time-consuming procedure,
Manuscript received July 13, 2019; revised November 12, 2019. W. Prasomsup is with Institute of Survey Engineering, Faculty of Engineering and Architecture, Rajamangala University of Technology Isan, Nakhon Ratchasima Province, Thailand (e-mail: [email protected]).
P. Piyatadsananon, W. Aunphoklang, and A. Boonrang are with School of Geoinformatics, Institute of Science, Suranaree University of Technology, Nakhon Ratchasima Province, Thailand.
particularly with the large area. Based on the digital data emerging in the image, computer-assisted digital processing plays a significant role in land use and land cover classification due to the fast processing and high accuracy. Many authors explored indices conducted to classify land-use and landcover by using remote sensing data. It appeared a standard city classification method using a Built-up Index (BUI) and assessed its performance [1]. The images were classified according to the critical value of the BUI based on the values of the selected samples. It was concluded that Normalized Difference Built-up Index (NDBI) can be defined as the linear combination of the near-infrared band (0.76 ~ 0.90 µm) and the middle infrared (MIR) band (1.55 ~ 1.75 µm), used for extraction of urban built-up land [2]. As a study, it showed the NDBI (Normalized Difference Built-up Index) on the footprints of the NDVI using Landsat Thematic Mapper (TM) near-infrared (NIR) band 4 (low reflectance in the built-up area) and mid-infrared (MIR) band 5 (high reflectance in the built-up area) [3]. The output NDBI was further refined by removing vegetation noise using NDVI (Normalized Difference Vegetation Index). Additionally, NDBI and NDVI were modified the approaches by employing continuous images of both indices [3] and [4]. The output was a continuous raster in which the pixels with higher values indicated a higher probability of them to represent built-up areas. It was found that the extraction of urban built land can be automatically done with NDBI [5]. However, the weakness of NDBI is that it cannot distinguish built up and bare land. For this reason, formulated a new urban index called Index-Based Built-up Index (IBI), derived from three other indices, SAVI, MNDWI, and NDBI, to map urban areas were created [6]. Also, a new index for mapping built-up and bare land called Enhanced Built-up and Bareness Index (EBBI), compared with IBI showed a high overall accuracy of EBBI in mapping built-up and bare land, while the IBI presented more accuracy in mapping built-up areas [7]. The study used three indices; Normalized Difference Built-up Index (NDBI), Modified Normalized Difference Water Index (MNDWI), and Soil Adjusted Vegetation Index (SAVI) to reduce the seven bands Landsat TM7 image into three thematic-oriented bands [8].
This study aims to develop the indices used in classifying built-up areas from agricultural areas. In order to achieve the aim of the study, two objectives were intensively studied to compare the results from several indices used to appropriately classify the built-up areas from satellite data of Landsat 8. The second objective is to develop a built-up area index which is suitable for classifying the built-up areas. Two study-areas where have been encountering the rapid urbanization were selected for this study. The processes of
Extraction Technic for Built-up Area Classification in
Landsat 8 Imagery
developing indices were addressed with provided results of the validation.
II. METHOD AND STUDY AREA
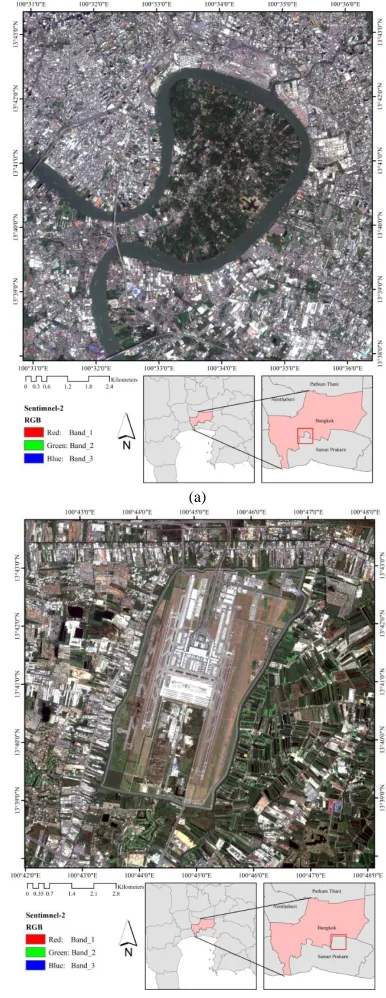
The study areas present the urban areas, Bangkok International Airport (Fig. 1 (a)), and Bangkachao (Fig. 1 (b)). Formerly, these areas were agricultural lands, whereas the development in terms of infrastructures and facility transforms these areas towards urbanization. For this reason, the mixed land use between built-up areas and agricultural areas is a distinctive reason for this study. This also challenges to examine the classification technics to discriminate the built-up area separated from the agriculture lands.
In order to achieve the aim of the study, satellite image, Landsat 8 OLI data, was used to generate several indices to classify the built-up areas from the following workflow of the methodology (Fig. 2). All indices were recoded and calculated the response to the algorithms. As expected, Built-Up Index (BUI) was calculated by considering two significant indices, NDBI and NDVI. Simultaneously, enhancing the accuracy of built-up areas regardless of the water areas in the data, the MNDWI was generated to extract the water areas from others. Therefore, the Modified Built-Up Index was generated by the integration between MNDWI and BUI to extract the built-up areas from the agricultural areas precisely.
A. Thematic Oriented Index
In this study considers the following indices used to extract the built-up areas, which are
1) Normalized Difference Vegetation Index (NDVI). This is primarily due to the internal structure of plant leaves. High reflectance in NIR and high absorption in Red spectrum, these two bands are used to calculate NDVI. So, the following formula gives Normalized Difference Vegetation Index (NDVI).
NDVI = (NIR – Red) / (NIR + Red) (1) The NDVI value varies from -1 to 1. Higher the value of NDVI reflects high Near Infrared (NIR), means dense greenery.
2) Normalized difference built-up index (NDBI). It was proposed that the NDBI method and Landsat TM data were used to determine the urban area [3]. For Landsat OLI data, NDBI can be calculated using the following equation:
NDBI = (MIR - NIR) / (MIR + NIR) (2) NDBI value lies between -1 to +1. A negative value of NDBI represents water bodies whereas higher value represents build-up areas. NDBI value for vegetation is low. 3) Built-up Index (BUI). Build-up Index (BUI) is the index
for analysis of urban pattern using NDBI and NDVI. BUI is the binary image with only higher positive value indicates built-up and barren thus, allows BUI to map the built-up area automatically.
BUI = NDBI – NDVI (3) 4) Modified Normalized Difference Water Index (MNDWI).
It was proposed that the Normalized Difference Water Index (NDWI) would delineate open water features, which is expressed as follows [9]:
NDWI = (GREEN – NIR) / (GREEN + NIR) (4) where GREEN is a green band such as Landsat 8 data band 3, and NIR is a near infrared band such as Landsat 8 data band 5. This index maximizes reflectance of water by using green light wavelengths and minimizes low reflectance of NIR by water features. Therefore, water features are enhanced with positive values and vegetation and soil are presented as zero or negative values.
(a)
(b)
NDVI NDBI
Accuracy assessment 2 Accuracy assessment 1
Google Earth
LANDSAT 8 OLI DATA (Band 3,4,5,and 6)
MNDWI Preprocessing
Re-code index Re-coded index Re-code index
Built-up index (BUI)
Modified Built-up index (MBUI) MNDWI (recoding) NDBI
(recoding)
NDVI (recoding) Visual validation
Fig. 2. The workflow of the methodology.
However, the extracted water information in these regions was often mixed up with built-up land noise because many built-up lands also have positive values in the NDWI image. To remedy this problem, it is able to modify the NDWI by using a middle infrared (MIR) band such as Landsat 8 data band 5 to substitute the NIR band in the NDWI [10]. The MNDWI is expressed as follows:
MNDWI = (GREEN – MIR) / (GREEN + MIR) (5)
B. Arithmetic Manipulation of Recoded Indices
Regarding the above indices, the NDVI, NDBI, and MNDWI, were transformed into Binary index, which represents as 0 and 254 by considering two criteria before transforming as followed.
If “Mean value of index” > 0
If “Index value” >= Mean value of index Recode = 254
Else Recode = 0 Else
If “Index value” >= (Mean value of index)5
+(-0.02) Recode = 254
Else Recode = 0
If the mean value of the index shown as a positive value, the DN (Digital Number) values, where are greater than the mean value must be transformed to 254, while the DN value is smaller than the mean value presenting as zero.
If the mean value of the index shown as a negative value, the DN values, where are greater than the mean value to the fifth power and added -0.02 to be 254, while the DN value is smaller than zero.
The derived NDVI image was recoded with 254 for all pixels having positive indices (vegetation) and 0 for all remaining pixels of negative indices. Derived NDBI image was recoded with 254 for all pixels having positive indices (built-up area) and 0 for all remaining pixels of negative indices. Finally, the derived MNDWI image was recoded with 254 for all pixels having positive indices (Water) and 0 for all remaining pixels of negative indices.
C. Modified Built-up Index (MBUI)
Considering the recoded indices, they can be integrated to enhance the quality of classification in built-up areas. This study proposes a developed technic, Modified Built-up Index (MBUI), which is integrated between BUI and MNDWI. According to the wetlands, these areas emerge shatteringly in
the built-up area. Therefore, this study considers the BUI and MNDWI to enhance the contrast between built-up land and water to extract the built-up areas separately from other classes effectively as the following equation.
MBUI = BUI – MNDWI (6) or
MBUI = (NDVI - NDBI) – MNDWI (7)
D. Accuracy Assessment
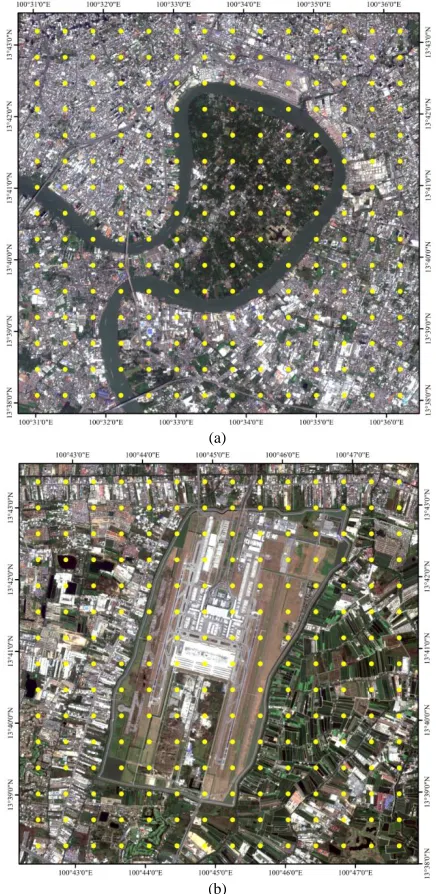
To compare the extraction accuracy between BUI and MBUI maps with Google Earth images. This study examines the extraction accuracy of BUI (overall accuracy are 0.70 and 0.80 in Table I) and MBUI maps (overall accuracy are 0.82 and 0.83 in Table I) by selecting 210 points, Fig. 3, from systematic random over the study areas.
It is clearly shown that this MBUI provides high accuracy of built-up area classification of both two study areas.
(a)
(b)
TABLEI:THE OVERALL ACCURACY OF CLASSIFYING THE BUILT-UP AREAS IN THE STUDY AREAS
Overall Accuracy
BUI MBUI
Area1 0.70 0.82
Area2 0.80 0.83
III. RESULTS
A. Index Results and Recoded Indices
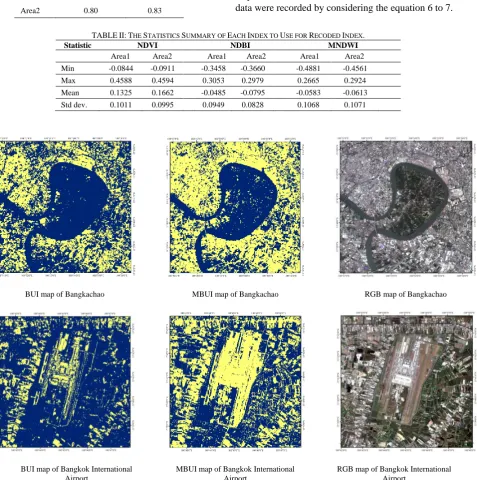
The descriptive statistical results were listed in Table II response to the NDVI, NDBI, and MNDWI. These statistical data were recorded by considering the equation 6 to 7.
TABLEII:THE STATISTICS SUMMARY OF EACH INDEX TO USE FOR RECODED INDEX.
Statistic NDVI NDBI MNDWI
Area1 Area2 Area1 Area2 Area1 Area2
Min -0.0844 -0.0911 -0.3458 -0.3660 -0.4881 -0.4561 Max 0.4588 0.4594 0.3053 0.2979 0.2665 0.2924 Mean 0.1325 0.1662 -0.0485 -0.0795 -0.0583 -0.0613 Std dev. 0.1011 0.0995 0.0949 0.0828 0.1068 0.1071
BUI map of Bangkachao MBUI map of Bangkachao RGB map of Bangkachao
BUI map of Bangkok International Airport
MBUI map of Bangkok International Airport
RGB map of Bangkok International Airport
Fig. 4. Results of built-up areas extraction from BUI and MBUI methods.
B. Comparison of Built-up Areas Extraction between BUI
and MBUI
Considering the images present in Fig. 4, it is clearly shown that the MBUI map of both two study areas provides a better-classified result comparing with the real image of RGB map of the study areas.
IV. CONCLUSION AND DISCUSSION
This modified index, it considers the major land-use types of image for extraction. Applying the MNDWI map to enhance the contrast between built-up land and water presents a better result than using the NDWI. According to
(DN values) show the normal distribution histogram. It is to say that it provides very little values (-0.02) of the difference between the median value and the mean value of the image data. Therefore, the MBUI would be suitable for an image where the digital number values perform as a normal distribution.
APPENDIX
No appendix.
CONFLICT OF INTEREST
The authors declare no conflict of interest. AUTHOR CONTRIBUTIONS
W Prasomsup conducted the research; A Boonrang analyzed the data; W Aunphoklang summarized the results; P Piyatadsananon and W Prasomsup wrote the paper; all authors had approved the final version.
REFERENCES
[1] J. A. Lee, S. S. Lee, and K. H. Chi, “Development of an urban classification method using a built-up index,” in Proc. 6th. WSEAS Int. Conf. on Remote Sensing, 2010, pp. 39-43.
[2] Y. Zha, S. Ni, and S. Yang. (2003). An effective approach to automatically extract urban landuse from TM imagery. J. Remote Sens. [Online]. 7(1). pp. 37–40. Available: http://en.cnki.com.cn/Article_en/CJFDTOTAL-YGXB200301006.ht m
[3] Y. Zha, J. Gao, and S. Ni. (2003). Use of normalized difference built-up index in automatically mapping urban areas from TM imagery. Int. J. Remote Sens. [Online]. 24(3). pp. 583-594. Available: https://doi.org/10.1080/01431160304987
[4] C. He, P. Shi, D. Xie, and Y. Zhao. (2010). Improving the normalized difference built-up index to map urban built-up areas using a semiautomatic segmentation approach. Remote Sens. Lett. [Online]. 1(4). pp. 213–221. Available: https://doi.org/10.1080/01431161. 2010.481681
[5] I. N. Hidayati, R. Suharyadi, and P. Danoedoro. (2018). Developing an extraction method of urban built-up area based on remote sensing imagery transformation index. Indones. J. Spat. Reg. Anal. (For. Geo.) [Online]. 32(1). pp. 96-108. Available: https://doi.org/10.23917/forgeo.v32i1.5907
[6] H. Xu. (2008). A new index for delineating built-upland features in satellite imagery. Int. J. Remote Sens. [Online]. 29(14). pp. 4269-4276. Available: https://doi.org/10.1080/01431160802039957
[7] A. R. As-Syakur, I. W. S. Adnyana, I. W. Arthana, and I. W. Nuarsa. (2012). Enhanced built-up and bareness index (EBBI) for mapping built-up and bareland in an urban area. J. Remote Sens. [Online]. 4(10). pp. 2957-2970. Available: https://doi.org/10.3390/rs4102957 [8] F. Mwakapuja, E. Liwa, and J. Kashaigili. (2013). Usage of indices for
extraction of built-up areas and vegetation features from landsat TM Image: A case of Dar Es Salaam and Kisarawe Peri-Urban areas, Tanzania. Int. J. Agric. For. [Online]. 3(7). pp. 273-283. Available: https://bit.ly/2GlriwN
[9] S. K. McFeeters. (1996). The use of normalized difference water index (NDWI) in the delineation of open water features. Int. J. Remote Sens. [Online]. 17(7). pp. 1425–1432. Available: https://doi.org/10.1080/01431169608948714
[10] H. Xu. (2005). A study on information extraction of water body with the Modified Normalized Difference Water Index (MNDWI). J. Remote Sens. [Online]. 9(5). pp. 511–517. Available: http://en.cnki.com.cn/Article_en/CJFDTotal-YGXB200505011.htm
Copyright © 2020 by the authors. This is an open access article distributed under the Creative Commons Attribution License which permits unrestricted use, distribution, and reproduction in any medium, provided the original work is properly cited (CC BY 4.0).
Wilawan Prasomsup was born in Kanchanaburi province Thailand in 1985.
In 2017, she got the Ph.D. (geoinformatics) from Suranaree University of Technology, Thailand; in 2011, she got the M.Sc. (environmental science) from Silpakorn University, Thailand; in 2008, she got the B.Sc. (computer science) from Sripatum University, Thailand.
She is a lecturer in Rajamangala University of Technology Isan, Nakhonratchasima, Thailand. She is interested in Environmental observation using Remote Sensing Technology. She has published eight academic articles, some example are listed below; [1] W Prasomsup, P Athiwat, T Wwatchlakorn, S Ratchanon, W nakarin and K Pimprapai “Vertical Accuracy Calibration Technic of Digital Elevation Model from Shuttle Radar Topography Mission by using Linear Regression” The 24th National Convention on Civil Engineering. July 10-12, 2019, Udonthani, Thailand.
[2] S. Ongsomwang, S. Dasananda, and W. Prasomsup “Spatio-Temporal Urban Heat Island Phenomena Assessment using Landsat Imagery: A Case Study of Bangkok Metropolitan and its Vicinity, Thailand” Environment and Natural Resources Journal 2018; 16(2): 29-44.
[3] P. Littidej, S. Sarapirome, W. Aunphoklang, S. Tanang and W. Prasomsu. “Frequency of violencemapping of air pollution using mathematical model and geographic information system” Proceedings of the 34th Asian Conference on Remote Sensing 2013 (ACRS 2013); 3: 2207-2215, 2013
Dr. Prasomsup also received a certificate of participated in the educational activity (English Research Programme) from Caritas Institute of Higher Education, Hong Kong, 2011.
Pantip Piyatadsananon was born in
Nakhonpathom province Thailand in 1972. In 2014, she got the Ph.D. (geoinformatics) from University of Salford, UK; in 1986, she got the M.Sc. (urban and regional planning) from King Mongkut‟s Institute of Technology Ladkrabang, Thailand; in 1981she got the B.Sc. (geography) from Srinakarinwirot University, Thailand.
She is an assistant professor working at Suranaree University of Technology, Nakhonratchasima, Thailand. She is interested in photogrammetry and GIS for generating and analysing high-resolution image and data. She has published more than 10 academic articles, which some examples are listed below;
[1] PIYATADSANANON P. (2016) Spatial factors Consideration in site selection of ground-mounted PV Power plants. Energy Procedia 100 (2016), pp. 78-85. In: 3rd International Conference on Power and Energy Systems Engineering, CPESE 2016, 8-10 September 2016, Kitakyushu, Japan. [2] HTUT Z. K., PIYATADSANANON P., RATANAVARAHA V. (2016) Identifying the Spatial Clustering of Road Traffic Accidents on Naypyitaw-Mandalay Expressway. In: 9th ATRANS symposium: Young researcher‟s forum 2016, 19 August 2016, Bangkok, Thailand.
[3] KERAMINIYAGE K. and PIYATADSANANON P. (2013) „Achieving success in post-disaster resettlement programmes through better coordination between spatial and socio-economic/cultural factors‟, International Journal of Disaster Resilience in the Built Environment, 4 (3), pp. 352-372.
Asst. Prof. Dr. Piyatadsananon received a scholarship of Royal Thai Government in 2007. She also obtained some government funding to research in Crime, Agricultural, and Urban studies using Geoinformatics technology.
Apinya Boonrang was born in Phayao Province Thailand in 1990.
In 2019, she is Ph.D. candidate (geoinformatics) from Suranaree University of Technology, Thailand; in 2016, she got the M.Sc. (applied physics)) from Chiang Mai University, Thailand; in 2013, she got the B.Sc. (physics) from Chiang Mai University, Thailand.
She is a Ph.D. in School of Geoinformatics Institute of Science Suranaree University of Technology, Nakhonratchasima, Thailand. She is interested in image processing and image classification using remote sensing data. She has published five academic articles, some example are listed below;
[2] A. Boontang and S. Kamontum “Application of Spatial Regression on Eucalyptus Tree Age Estimating Using Diameter at Breath Height” Journal of Remote Sensing and GIS Association of Thailand 2018, 19(2).
[3] A Boonrang and C. Chaiwong. “Nitrogen Doping of Graphene by Ion Implantation” Proceedings of the 7th National Science Reseach Conference. March 30-31 Phitsanulok, Thailand.
Boonrang has received a Science Achievement Scholarship of Thailand in 2009 to present.
Warunee Aunphoklang was born in Nakhon Ratchasima Province Thailand in 1986.
In 2019, she is the Ph.D. candidate (geoinformatics) from Suranaree University of Technology, Thailand; in 2012, she got the M.Sc. (geoinformatics) from Suranaree University of Technology, Thailand; in 2007, she got the B.I.S (management information systems) from: Suranaree University of Technology, Thailand.
geographic information system. She has published six academic articles, some example are listed below;
[1] W. Aunphoklang and S. Sarapirome. “Plot-level urban land-use planning using Genetic algorithm and Multi-objective optimization: case study areas in Nakhon Ratchasima town” The International Conference on Science and Technology 2017 (Oral Presentation). December 7–8, 2017, Rajamangala University of Technology Thanyaburi, Thailand.
[2] W. Aunphoklang and S. Sarapirome. “Determination of potential areas for types of rapid urban growth planning” The 41st Congress on Science and Technology of Thailand (Oral Presentation). November 6-8, 2015, Suranaree University of Technology, Nakhon Ratchasima, Thailand.
[3] W. Aunphoklang, S. Sarapirome, and P. Littidej. “Comparison on different clustering of origins for sugarcane transportation using Network Analysis and Linear Programming” Proceedings of the 32nd Asian Conference on Remote Sensing 2011 (ACRS 2011). October 3-7, 2011, Taipei, Taiwan.
Miss Aunphoklang received a SUT outstanding academic performance scholarship from Suranaree University of Technology Thailand, 2013. She is a Ph.D. in School of Geoinformatics Institute of Science Suranaree