J Wood Sci (2000) 46:267-272 9 The Japan Wood Research Society 2000
Y o s h i h i k o N i s h i n o 9 G 6 r a r d J a n i n 9 Y u j i Y a m a d a 9 D a i s u k e K i t a n o
Relations between the colorimetric values and densities of sapwood
Received: July 23, 1999 / Accepted: September 3, 1999
Abstract Color measurements were made for sapwood specimens of 26 hardwood species. The densities of the specimens ranged from 258.5 to 945.6kg/m 3. The colori- metric values and densities were compared among the species. The tristimulus values of X, Y, and Z were poorly correlated with the densities. The chromaticity coordinate x had a good linear correlation with the densities of the wood specimens, especially in the transverse planes. The transverse plane of wood fibers is thought to emphasize the relative values in the long wavelength region of the visible ray.
K e y w o r d s Density 9 Colorimetry 9 Sapwood - Hardwood
Introduction
Most of the broad-leaved forests in Shimane Prefecture, Japan, are secondary forests of deciduous trees grown after having used the wood produced from the forests as re- sources of fuel and charcoal. 1 During the last 50 years con- sumption of fuel derived from wood has diminished, and secondary forests have been grown without using the wood produced from them. The diameters of the trees are not large, but in the near future we will be able to use the wood produced from the forest if we control the forests ad- equately. Thinning the forests to control their density is important for enhancing the ability of the forest to fix carbon dioxide. 2 For commercial reasons the thinned
Y. Nishino ( ~ ) 9 Y. Yamada. D. Kitano
Faculty of Life and Environmental Science, Shimane University, Matsue 690-8504, Japan
Tel. +81-852-32-6593; Fax +81-852-32-6598 e-mail: [email protected] G. Janin
INRA-CRF-Qualit4 des Bois, Champenoux 54280, France
Part of this report was presented at the 49th annual meeting of the Japan Wood Research Society, Tokyo, April 1999
hardwood logs should be used even though the diameter of the thinned logs is small.
Various tree species are found in the secondary forest, and the wood cut from the trees shows widely different visual features among species. The color of wood is one of the important characteristics, as are the mechanical proper- ties, when using such wood in our daily lives. The color of wood has not often been discussed in relation to the other physical characteristics. By knowing the relations between the color and other physical characteristics of wood, we can understand some of the mechanisms of wood color. These relations might be applied to determine an appropriate use for unused wood species. In this report the colorimetric features of sapwood are discussed using their colorimetric values and comparing them with their densities.
Materials and methods
Altogether 25 species of broad-leaved trees were cut down in the secondary forest in Sambe Experimental Forest, Shimane University, Japan. The forest is in the Japan Sea climate region, which has an annual average temperature of 11~ and an annual average rainfall of 2300 mm. 3 The soil in the forest consists of brown forest soil. 4 The diameters of the hardwood logs obtained approximately ranged from 150 to 300 ram. We also obtained logs of
LiIiodendron tulipifera
L. from the campus of Shimane University, Matsue City, which had fallen owing to a typhoon. In total, then, we obtained 26 species of broad-leaved logs for the color measurements.T h e c o l o r t h e s p e c i m e n s was m e a s u r e d w i t h a c o l o r i m - e t e r ( M i n o l t a C R - 2 0 0 b ) to o b t a i n t h e c o l o r i m e t r i c v a l u e s o f Y, x, a n d y o n t h e R - T p l a n e s ( t r a n s v e r s e p l a n e s ) , L - R p l a n e s (radial p l a n e s ) , a n d L - T p l a n e s ( t a n g e n t i a l p l a n e s ) . T h e c o l o r i m e t r i c v a l u e s 32, Y, Z a r e c a l l e d t h e t r i s t i m u l u s values, a n d t h e v a l u e s x, y, z a r e c a l l e d t h e c h r o m a t i c i t y c o o r d i n a t e s . T h e o p t i c a l s y s t e m o f t h e c o l o r i m e t e r was dif- f u s e i l l u m i n a t i o n a n d 0 v i e w i n g angle. T h e d i a m e t e r of t h e
40
m m30 m m J J J J J J J
5 0 m m
L
T
Fig. 1. Wood specimen for color measurement
1
m e a s u r e m e n t a r e a o f t h e s e n s o r h e a d was 10 m m . T h e m e a n v a l u e o f t h e 10 m e a s u r e m e n t s w e r e c a l c u l a t e d f o r e a c h p l a n e . T h e c o l o r i m e t r i c v a l u e s o f z, X, a n d Z w e r e o b t a i n e d f r o m t h e f o r m u l a s b e l o w . ~
z = 1 - x - y (1)
x =
(2)
Y
Z - 1 - X - y y (3)
Results and discussion
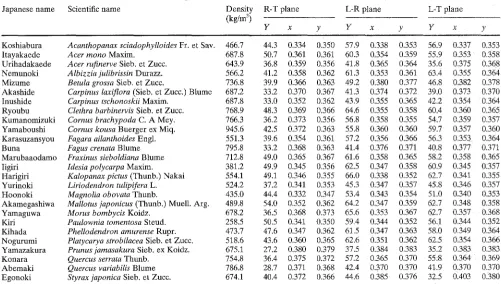
T h e d e n s i t i e s a n d c o l o r i m e t r i c v a l u e s of t h e w o o d species a r e s h o w n in T a b l e 1. T h e d e n s i t i e s o f t h e s p e c i m e n s r a n g e d f r o m 2 5 8 . 5 k g / m 3 f o r kiri w o o d to 9 4 5 . 6 k g / m 3 f o r y a m a b o u s h i w o o d .
A typical e x a m p l e o f t h e c o l o r i m e t r i c r e l a t i o n s a m o n g t h e w o o d p r i n c i p a l p l a n e s is s h o w n in Fig. 2 f o r k u m a n o m i z u k i s a p w o o d . T h e v a l u e s of Y f o r t h e r a d i a t a n d t a n g e n t i a l p l a n e s w e r e h i g h e r t h a n t h o s e f o r t h e t r a n s v e r s e p l a n e s , a n d t h e v a l u e s of x f o r t h e r a d i a l a n d t a n g e n t i a l p l a n e s w e r e l o w e r t h a n t h o s e f o r t h e t r a n s v e r s e planes. N o g r e a t e r d i f f e r e n c e in t h e v a l u e s b e t w e e n t h e r a d i a l a n d t r a n s v e r s e p l a n e s w e r e f o u n d in m o s t species. T h e s e results a r e s i m i l a r to t h o s e o f l u m i n a n c e in t h e c a s e of y e l l o w
Table 1. Densities and colorimetric values of sapwood of the hardwood specimens
Japanese name Scientific name Density R-T plane (kg/m 3)
Y x
L-R plane L-T plane
y Y x y Y x y
Koshiabura Itayakaede Urihadakaede Nemunoki Mizume Akashide Inushide Ryoubu Kumanomizuki Yamaboushi Karasuzansyou Buna
Marubaaodamo Iigiri
Harigiri Yurinoki Hoonoki Akamegashiwa Yamaguwa Kiri Kihada Nogurumi Yamazakura Konara Abemaki Egonoki
Acanthopanax sciadophylloides Fr. et Say. 466.7 44.3 0 . 3 3 4 0.350 5 7 . 9 0.338 0 . 3 5 3 56.9 0.337 0.353 Acer mono Maxim. 687.8 50.7 0 . 3 6 1 0 . 3 6 1 60.3 0.354 0.359 5 5 . 9 0 . 3 5 3 3.358 Acer rufinerve Sieb. et Zucc. 643.9 36.8 0.359 0.356 41.8 0 . 3 6 5 0.364 3 5 . 6 0 . 3 7 5 0.368 Albizzia julibrissin Durazz. 566.2 41.2 0.358 0.362 61.3 0 . 3 5 3 0 . 3 6 1 63.4 0 . 3 5 5 0.364 Betula grossa Sieb. et Zucc. 736.8 39.9 0.366 0.363 49.2 0.380 0.377 46.8 0 . 3 8 2 0.378 Carpinus laxiflora (Sieb. et Zucc.) Blume 687.2 33.2 0.370 0.367 41.3 0.374 0.372 3 9 . 0 0 . 3 7 3 0.370 Carpinus tschonoskii Maxim. 687.8 33.0 0 . 3 5 2 0.362 43.9 0.355 0 . 3 6 5 42.2 0.354 0.364 Clethra barbinervis Sieb. et Zucc. 768.9 48.3 0 . 3 6 9 0.366 64.6 0 . 3 5 5 0.358 60,4 0.360 0.365 Comus brachypoda C. A Mey. 766.3 36.2 0 . 3 7 3 0.356 5 6 . 8 0.358 0 . 3 5 5 5 4 . 7 0 . 3 5 9 0.357 Comus kousa Buerger ex Miq. 945.6 42.5 0 . 3 7 2 0 . 3 6 3 5 5 . 8 0.360 0.360 5 9 . 7 0 . 3 5 7 0.360 Fagara ailanthoides Engl. 551.3 39.6 0.354 0 . 3 6 1 5 7 . 2 0.356 0.366 5 6 . 3 0 . 3 5 3 0.364 Fagus crenata Blume 795.8 33.2 0.368 0 . 3 6 3 41.4 0.376 0 . 3 7 1 40.8 0.377 0.371 Fraxinus sieboIdiana Blume 712.8 49.0 0 . 3 6 5 0.367 61.6 0.358 0.365 58.2 0.358 0.365 Idesia polycarpa Maxim. 381.2 49.9 0 . 3 4 5 0.356 6 2 . 5 0.347 0.358 60.9 0.345 0.357 Kalopanax pictus (Thunb.) Nakai 554.1 49.1 0.346 0 . 3 5 5 66.0 0.338 0.352 62.7 0 . 3 4 1 0.355 Liriodendron tulipifera L. 524.2 37.2 0 . 3 4 1 0 . 3 5 3 45.3 0.347 0.357 45.8 0.346 0.357 Magnolia obovata Thunb. 435.0 44.4 0.332 0.347 53.4 0 . 3 4 3 0.354 51.0 0.340 0.353 Mallotus japonicus (Thunb.) Muell. Arg. 489.8 54.0 0.352 0.362 64.2 0.347 0.359 62.7 0.348 0.358 Morus bombycis Koidz. 678.2 36.5 0.368 0.373 65.6 0.353 0 . 3 6 7 62.7 0.357 0.368 Paulownia tomentosa Steud. 258.5 50.5 0 . 3 4 1 0.350 59A 0.344 0.352 5 6 . 1 0 . 3 4 ~ 0.352 Phellodendron amurense Rupr. 473.7 47.6 0 . 3 4 7 0.362 61.5 0 . 3 4 7 0 . 3 6 3 5 8 . 0 0.349 0.364 Platycarya strobilacea Sieb. et Zucc. 518.6 43.6 0.360 0 . 3 6 5 62.6 0 . 3 5 1 0.362 6 2 . 5 0.354 0.366 Prunusjamasakura Sieb. ex Koidz. 675.1 27.2 0.380 0.379 3 7 . 5 0.384 0 . 3 8 3 3 5 . 2 0 . 3 8 3 0.383 Quercus serrata Thunb. 754.8 36.4 0 . 3 7 5 0.372 57.2 0 . 3 6 5 0.370 5 5 . 8 0.364 0.369 Quercus variabilis Blume 786.8 28.7 0 . 3 7 1 0.368 42.4 0.370 0.370 41.9 0.370 0.370 Styrax japonica Sieb. et Zucc. 674.1 40.4 0.372 0.366 44.6 0 . 3 8 5 0.376 3 2 . 5 0 . 4 0 3 0.380
0.390
0.380
0.370
0.360
0.350
0.340
o T r a n s v e r s e p l a n e /X R a d i a l plane D T a n g e n t i a l plane
da
I I I I
0
20
40
60
80
100
Y
Fig. 2. Colorimetric relation between Y and x among the principal planes for kumanomizuki sapwood
0.400
0.390
0 . 3 8 0
0.370
[]
o Transverse plane lx Radial plane DTangential plane
[]
D
[]
[]
0.360 ' ' '
0 20 60 80 100
I
4O
Y
Fig. 3. Colorimetric relation between Y and x among the principal planes for mizume sapwood
poplar reported by Sullivan. 6 F o r the values of x, the trend is not as simple. A n o t h e r example of the colorimetric relations of mizume w o o d is shown in Fig. 3. The x values for the transverse planes are smaller than those in the radial and tangential planes. T h e y are thought to be affected by some properties of the wood, such as the density, composi- tion of the chemical substances, and anatomical features. In
t~
9 rl]
,,=~
80
60
40
20
0
80
0
|
o o
o
% o
O O
0
I I I I
200
400
600
800
269
0
1000
60
40
20
o o
o
o o
~c~
o
0
~ o~o~
o
I I I I
0
2 ~
400
6 ~
8 ~
O
1000
80
~ , 60
~ 4 0
"~ 20
o
o o3o
O o
o o
O O ' "
o
0
cb
k.,Iq3
O--
I I I I
0
200
400
600
800
1000
Density (kg/m 3)
Fig. 4. Relations between the values of Y for sapwood and the densities
the case of sapwood the color m a y be less affected by chemical substances than that of heartwood.
0.400
0.380
o
0.360
>0.340
.~.
0.320
0.300
0
0 0 0
0 0
o o
0
I I I I
0
200
400
600
800
1000
0.400
0.380
-- 0 3 6 0
.0.340
. .
0.320
0.300
0 0
0 0
0
0 0
o Oo ~
#~
0 00"-
I I I I
0
200
400
600
800
1000
0.420
r ~
o
0.4oo
-- 0.380
t~0.360
0.340
x2
9 =- 0.320
0.300
o~
0
O 0 0 O 0 0
I I I I
0
200
4 1 3 0 600
800
1000
Density (kg/m 3)
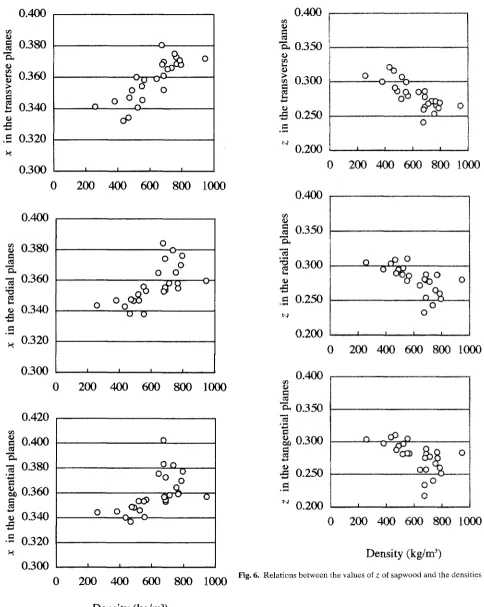
Fig. 5. Relations b e t w e e n the values of x of sapwood a n d the densities
0.400
rl]"~
0.350
0.300
0.250
t,4
0.200
0
0
200 400 600 800 1000
0.400
0.350
0.300
xA
.~ 0.250
b 4
0.200
0.400
Cr0.350
0.300
eto0.250
0.200
o ~
[
0
200 400 600 800 1000
O
0
200 400 600 800
1000
Density (kg/m 3)
90
80
70
60
50
40
15
10
5
0
30
20
10
0
o 01~ 0 0
o
0
I 1 I I
0
200 4O0 600 800 1000
[] o
A 0
o ~
8
AI I I I
0
200 400 600 800 1000
o o
ca
0 0 0
I I I I
0
200
400
600
800 1000
40
30
*
20
10
0
90
6O
r
30
[] o
@
I I I I
0
200 400 600 800 1000
[]
I I I I
0
200 400 600 800 l O00
Density (kg/m 3)
Density (kg/m 3)
the relation between Y in the transverse plane and the density. Because the correlation is negative, the more the transverse plane of the fiber substance appears, the less is the luminance; that is, the transverse planes of the cell fiber substance may decrease the luminance. It is thought that the lumen holes may not decrease the luminance of the trans- verse planes of wood. Therefore, that the luminance in the transverse planes being lower than in the radial and tangen- tial section cannot attributed to the existence of lumen holes in the transverse sections. Rather, it may be attributed to the anisotropy of the luminance of the cell wall substance and the anatomical features of each plane.
The relations between the x values of sapwood and the density are shown in Fig. 5. Positive correlations were found for the relations between the x in all planes and the densi- ties. The correlation coefficient had the highest value (0.813) in the transverse plane. The x value indicates the proportion of the spectrum of longer wavelengths of the visible r a y ] In contrast, the relations between the z values and density were significantly negative, as shown in Fig. 6. The cell wall substance is thought to have a nature that emphasizes the longer wavelength region than the short wavelength region.
The approximately uniform color space in rectangular coordinates with L*, a*, and b* is employed to obtain the color differences of the objects. The values of the C I E L A B color system (L*, a*, and b*) are calculated with the tristimulus values by the following equations. 5
~gu \1/3
L * = 116|-(-7-. [ - 16 (4)
kro)
a* = 5oo
t g )
J
(5)
f(~00)1/3,
( Z )1/3}
b* = 200 t,~0) (6)
In the case of the standard illuminant of D65 and the 2 degrees standard observer, X0 = 95.045, Y0 = 100, and Z0 = 108.892. The values of C* (chroma) and h (hue) were calcu- lated using the following equations.
C * = ~/a .2 + b*2 (7)
h = tan -l(b*/a*)
(8)
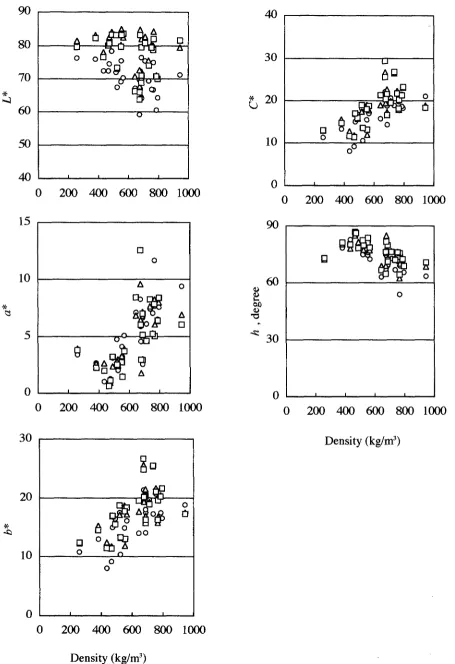
Figure 7 shows the relationships between the CIE 1976
(L*a*b*)
colorimetric values of sapwood and the density. The relation of L* (lightness) and density is similar to that of Y and density; and this result is understood by the simple relation in Eq. (4). Positive relations can be observed for the values of a*, b* and C* versus the density of wood. These results are understandable from the results of therelations for the values of x and z versus the density. In the transverse plane a negative correlation between h and the density can be observed, but in the other planes the correlations are not significant. A positive relation between the chroma of sapwood and the density can be observed in
all the principal planes, whereas negative correlations be- tween lightness and density and between hue and density are found only in the transverse plane. All the trends of the relations between the CIE 1976
(L*a*b*)
colorimetric values of sapwood and the densities can be derived from the results for the tristimulus values. The CIE i976(L*a*b*)
colorimetric values describe the color difference suitably; that is, they are linear with the human perception but not linear with the physical intensity of the visible ray, tt is adequate to employ theXYZ
values when discussing the relations between the colorimetric values and density.Conclusions
The relations between colorimetric values and densities are discussed for the sapwood specimens made from 26 Japa- nese hardwood species. The correlation between the Y value and the densities was found only in the transverse sections. The transverse section of the cell fiber substance may decrease the luminance. Good positive correlations were found for the relations between the x values in t h e transverse plane and density. The cell wall substance is thought to be of a nature that emphasizes the longer wave- length region rather than the shorter wavelength region of the visible ray.
Acknowledgments We give many thanks to Dr. A. Yamashita, Schooi
of Education, Shimane University, and to Mr. K. Terada and Mr. S. Kawakami, University Forest, Shimane University, for their aid in elaborating the wood specimens.
References
1. Yamashita T, Kawakami S, Nakamura Y, Kanetsuka S, Terada K, Shinmura Y (1996) Semi-natural forest vegetation of Shimane Uni- versity Forest (in Japanese). Bull Faculty Life Environ Sci Shimane Univ 1:63-66
2. Kitano T (1994) Efficiency of carbon dioxide photosynthesis pro- duction in forest (in Japanese). Wood Ind 49:87-89
3. KawakamiS, Miura T, Gocho M, Moriyama I, TeradaK, Yamashita T (1997) Effects of tree size and growing position on snow pressure damage in a sugi and hinoki plantation of the Sambe Forest, Shimane University (in Japanese). Bull Faculty Life Environ Sci Shimane Univ 2:41-46
4. Economic Planning Agency of Japan (1969) Soil map (in Japanese). Print Agency, Ministry of Finance Japan
5. Wyszecki G, Stiles WS (1982) Color science: concepts and methods, quantitative data and formulae, 2nd edn. Wiley, New York, pp 130- 175
6. Sullivan JD (1967) Color characterization of wood: color param- eters of individual species. For Prod J 17(8):25-29