ORIGINAL ARTICLE DOI 10.1007/s10086-003-0569-z
Chuanshuang Hu · Chiaki Tanaka · Tadashi Ohtani
On-line determination of the grain angle using ellipse analysis of the laser
light scattering pattern image
Received: April 11, 2003 / Accepted: July 30, 2003
CS. Hu · C. Tanaka (*) · T. Ohtani
Faculty of Science and Engineering, Shimane University, Matsue 690-8504, Japan
Tel. 81-852-32-6562; Fax 81-852-32-6123 e-mail: [email protected]
Abstract Under fixed cutting conditions, the surface finish roughness is correlated to the grain angle. However, the means of determining the grain angle automatically and accurately is still a challenge for on-line control of the router. It is therefore necessary to develop a new technol-ogy to determine the grain angle accurately and automati-cally. In this research, a laser light scattering pattern was used to accurately determine the grain angle. The light scat-tering pattern image was a quasi-ellipse caused by the grain direction and tracheid effect. A new modified Hough trans-form ellipse analysis technology was adopted to determine the ellipse parameters that could be used to determine the grain angle. The results indicated that the measured grain angle using the method proposed here was accurate and effective. The measured grain angle coincided with the real grain angle. There was an insignificant difference between the measured grain angle of Japanese beech (Fagus crenata blume) and that of sugi (Cryptomeria japonica D.Don) under two machining conditions that gave planed or sawn finishes. However, the accuracy of the measured grain angle of sugi was better than that of Japanese beech for the planed finish, the accuracy of the measured grain angle of Japanese beech was better than that of sugi for the sawn finish, and the accuracy of the measured grain angle for planed samples was better than that for sawn samples of both sugi and Japanese beech.
Key words Grain angle · Laser light scattering pattern · Image processing · Ellipse analysis
Introduction
Due to increasing labor and raw material costs and high customer expectations, it is essential for sawmills to
con-tinually improve productivity and quality. The simplest way to achieve this goal is to increase the cutting speed. How-ever, excessive cutting speed will generate a coarse surface. Cutting force and acoustic emission (AE) have been used to evaluate the grain angle used to control the feed rate to achieve the maximum cutting efficiency and finished surface quality in an on-line controlled router.1,2
However, the cut-ting force is affected by its additional inertia and the differ-ence between the latewood and earlywood. In addition, the linear relationship between AE count rate and surface roughness under every discrete grain angle is complex and a means of determining the grain angle automatically and accurately is still not clear. It is therefore necessary to de-velop a new technology to determine the grain angle accu-rately and automatically in the control system of the router. Determining the grain angle is a valuable but difficult job. Methods based on the dielectric constant and ultrasonic wave propagating model for across and along the grain have been developed.3,4
the laser light scattering pattern was used to determine the grain angle and diving angle. The light scattering pattern image was a quasi-ellipse caused by the tracheid effect. Principal component analysis (PCA) was used to determine the grain angle and the ratio of the minor-to-major axes of the ellipse was used to evaluate the diving angle.8
In our research, a new ellipse analysis of the laser light scattering pattern image was proposed to accurately deter-mine the ellipse parameters automatically and thereby de-termine the grain angle.
Materials and methods
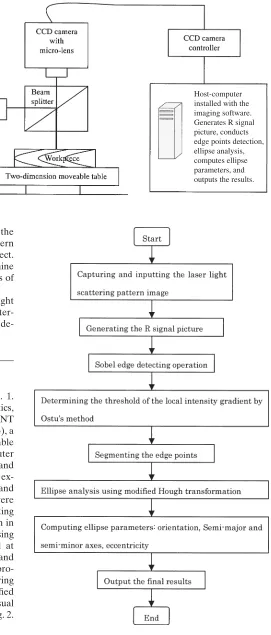
The schematic diagram of the system is shown in Fig. 1. It consists of a He-Ne laser source (Edmund Optics, NT61332), a 10 Beam Expander (Edmund Optics, NT 55578), a cubic beam splitter (Edmund Optics, NT 32503), a CCD-camera (Victor KY-F350, Victor JVC), a rotatable table, some ancillary holding parts, and a host computer fitted with an image processing program developed and installed by the authors. The materials selected for the ex-periment were sugi (Cryptomeria japonica D.Don) and Japanese beech (Fagus crenata blume). Samples were placed on the rotatable table. The laser light propagating path from the laser source to the CCD-camera is shown in Fig. 1. Considering the working distance and processing efficiency, the scattering pattern image was captured at 150 dpi (dot per inch) by adjusting the working distance and the focus length of the CCD camera. The computer pro-gram that was used to process the laser light scattering pattern image and to analyze it by means of modified Hough transform ellipse analysis was written in Visual Basic 6.0 as code resource. The flow chart is shown in Fig. 2.
Image processing algorithm
After capturing and inputting the laser light scattering im-age, the Sobel edge detecting operation9
was performed to
Host-computer installed with the imaging software. Generates R signal picture, conducts edge points detection, ellipse analysis, computes ellipse parameters, and outputs the results. Fig. 1. Schematic diagram of the
experimental system
detect the elliptical edge points. This operation can be de-scribed by the following formulas:
Sx
1 0 1 2 0 2 1 0 1
È Î Í Í Í ˘ ˚ ˙ ˙ ˙ (1) Sy
1 2 1 0 0 0 1 2 1
È Î Í Í Í ˘ ˚ ˙ ˙ ˙ (2)
Sxy S Ax S Ay (3)
where Sx and Sy are the convolution masks of x and y
direc-tional intensity gradients; A is the 3 3 neighborhood matrix with the geometric center of the transformed point (x, y); Sxy is the desired pixel value of the point (x, y). If the
value of Sxy is greater than a threshold determined by
pre-liminary experiments, the point (x, y) will be detected as one of the elliptical edge points.
In order to find the four ellipse parameters (major axis, minor axis, orientation, and eccentricity), which are equiva-lent to determining the grain angle, all the elliptical edge points were passed through the ellipse analysis of the modified Hough Transform (MHT).10–12 The adopted MHT algorithm can be described as follows.
A general representation of an ellipse is denoted by Eq. 4.
Ax2 Bxy Cy2 Dx Ey
1 0
(4)
with the constraint of 4AC B2
0. An ellipse is uniquely defined by a minimum of five points. The conic coefficients of A, B, C, D, E can be determined by substituting the five points into Eq. 4 and solving the five simultaneous equa-tions shown as follows.
Axi Bx yi i Cyi Dxi Eyi
2 2
1 0
(5)
where xi, yi (i 1, 2, . . . , 5) is any arbitrary point’s
coordi-nates of the elliptic edge detected by the above Sobel opera-tion. Note that all of xi, yi (i 1, 2, . . . , 5) are becoming
coefficients while all of the ellipse coefficients (A, B, C, D,
E) are becoming variables in the above linear simultaneous
equations. To be easily understood, the linear simultaneous equations can be rewritten as Eq. 6.
a Xij j i j
1 1 2 5
1 5
, , , . . . ,
Â
(6)where aij are coefficients of the linear equations; Xj are
variables of the linear simultaneous equations; i is the total number of variables in the linear simultaneous equations; j is the total number of linear simultaneous equations.
The linear simultaneous equations are solved by the Gauss-Seidel iteration algorithm13
described as follows:
X
a a X a X
i i k ii ij j k j i ij j k j i 1 1 1 1 1 5 1 1
1 2 5
( ) ( ) ( )
Â
Â
Ê Ë Á ˆ ¯ ˜, , , . . . , (7)where k is the iterating count. After definite iteration times,
Xj
(k1)
will converge quickly to its accurate solution with any arbitrary initials Xj
(0)
(j 1, 2, . . . , 5).
For n elliptic edge points, all of the combinations of the five-point pair can be denoted as (pi, pj, pk, pl, pm) (i π j π k
π l π m, 1 i, j, k, l, m n). However, fitting all combina-tions of five points will be overly time-consuming. To save computing time, the MHT operation is performed on all regularly spaced five-point pairs denoted as follows:
p p p p p
i n s s n
i, i s, i s, i s, i s
, , . . . , ; , , . . . , . + + + +
(
)
(
)
(
)
2 3 4
1 2 4 1 2 1 4
(8)
s is the separation between points. Note that the maximum
computational complexity is being reduced. Each ellipse fitting through a five-point pair (pi, pis, pi2s, pi3s, pi4s)
provides an estimate (Ai,s, Bi,s, Ci,s, Di,s, Ei,s) of the conic
coefficients. For some sets of five points, the conic may be a parabola or hyperbola instead of an ellipse. If the deduced conic coefficients cannot satisfy the additional constraint of 4Ai,sCi,s B
2
i,s 0, these five nonelliptic points will be
re-jected. If the conic coefficients can satisfy the constraint of 4Ai,sCi,s B
2
i,s 0, these coefficients, denoted as (Ai,s, Bi,s,
Ci,s, Di,s, Ei,s) to differ from (Ai,s, Bi,s, Ci,s, Di,s, Ei,s), will be
used to compute the desired four ellipse parameters de-scribed by the following formulas:
θi s, 1 2arctan
[
Bi s¢,(
Ai s¢, Ci s¢,)
]
(9)a
A C A C
i s
i s i s i s i s i s
, , , , , , 2 2 2 ¢ ¢
(
)
[
(
¢ ¢)
¢]
(10)b
A C A C B
i s
i s i s i s i s i s
, , , , , , 2 2 2 ¢ ¢
(
)
[
(
¢ ¢)
¢]
(11)ei s, ai s, bi s, (12)
where θi,s is the ellipse orientation; ai,s, bi,s are the semi
minor and major axes of the ellipse; and ei,s is the ellipse
eccentricity. The intensity histograms of the above ellipse parameters were computed. The final four parameters were taken as the dominant peaks of each set of parameters
ˆ max
,
θ
{
histogram(
θi s)
}
(13)ˆ max ,
a
{
histogram ai s(
)
}
(14)ˆ max
,
b
{
histogram bi s(
)
}
(15)ˆ max ,
where θˆ is the final accumulating orientation of the ellipse, which can be used to determine the grain angle; â and ˆb are the final accumulating semimajor and/or minor axes of the ellipse, respectively; and ê is the final accumulating eccen-tricity of the ellipse that can be used to determine the diving angle.8
Results and discussion
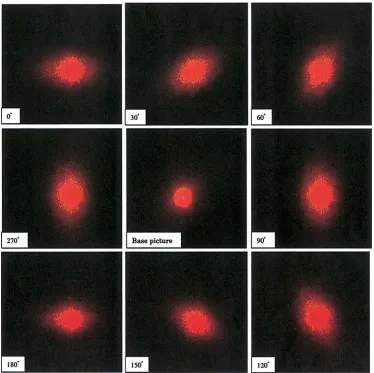
The picture of the laser light scattering spot is shown in Fig. 3. These pictures were captured at every rotating posi-tion for the same locaposi-tion on the sample surface while the planed sugi sample was rotated every 15° from 0° to 360°. The horizontal direction was defined as the base axis for determining the grain angle and the horizontal center line of the 0° picture was defined as the base rotating axis. As shown in Fig. 3, all of the laser spot scattering patterns are quasi-ellipsoidal and their orientations changed with the rotation. This phenomenon is considered to be caused by the tracheid effect. To prove this, base pictures were also captured. A picture of the sample surface was taken using a color CCD camera and the picture was printed onto a high
quality white paper by a color printer. The picture of the laser spot scattering pattern, which was called the base pic-ture, was captured at the same position on the printed paper as the real sample was operated. It can be readily seen that the base picture is a quasi-circle; the effect of the tracheid is manifested well to give a quasi-ellipse in the captured pic-ture of the laser spot scattering pattern.
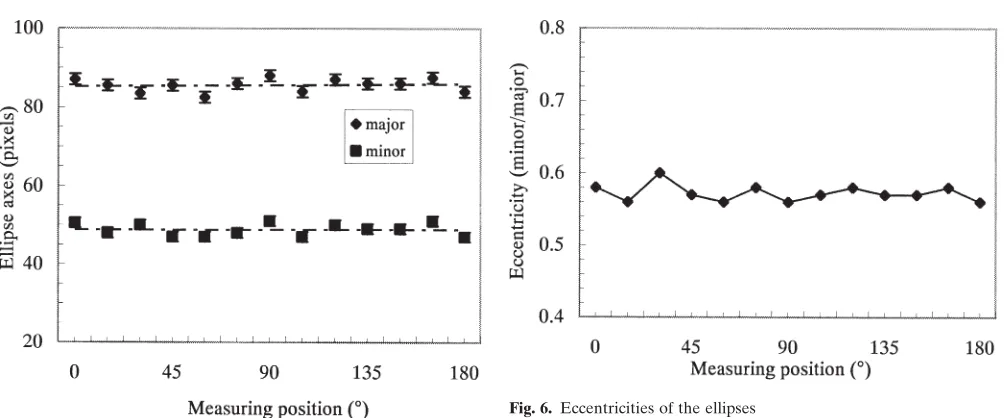
The quasi-ellipse edge of the picture shown in Fig. 3 detected by the Sobel operation is shown in Fig. 4. All of the edge points were detected correctly. Although the laser spot scattering pattern is not a clear-out ellipse, most of its edge points tend to share the same ellipse parameters. The changing orientation of the laser spot scattering pattern with the rotation is clearer than that in Fig. 3. The quasi-ellipse edge points were analyzed by the quasi-ellipse analysis technology of the modified Hough transform. The param-eters of major and minor axes are shown in Fig. 5 and the eccentricity parameter is shown in Fig. 6. As shown in Figs. 5 and 6, all the parameters are approximately the same for each measuring angle. According to the planed sugi sample, the major axis fluctuates around 86 pixels (or about 15 mm) with maximum deviation of 1.4 pixels (or about 0.2 mm) and the minor axis fluctuates around 49 pixels (or about 8 mm) with maximum deviation of 1.2 pixels (or about
Fig. 3. The laser spot scattering
Fig. 4. The detected quasi-ellipses
of the laser spot scattering pattern. Each binary image corresponds to the image in the same positions in Fig. 3
Fig. 5. The major and minor axes of the ellipses. Symbols and vertical
bars denote the mean values and standard deviations, respectively
0.2 mm); the eccentricity values fluctuate around 0.58. The results, which show that all the quasi-ellipses share similar ellipse parameters, indicate that the adopted ellipse analysis technology of the modified Hough transform is efficient. The reason is that all of the edge points are treated as points of ellipse sets instead of an exact ellipse and all five ellipse parameters are computed from the parameter population distributions of those ellipse sets.
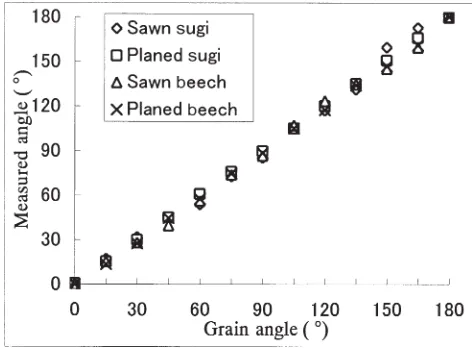
The grain angle measured automatically by the method proposed in this research is shown in Fig. 7. The measured grain angle coincided with the real grain angle and there is an almost linear relation between the measured grain angle and the real grain angle. Some researchers have reported that the wood species and surface roughness affected the measuring accuracy of grain angles using optical scatter-ing.14
To study the effect of the surface quality on the effi-ciency of the proposed method in our research, Japanese beech and sugi were used with rough-sawn and planed fin-ishes. There was no significant difference between the mea-sured grain angles of Japanese beech and those of sugi under the above two machining conditions. The deviation of the measured grain angle in the planed samples was less than that in rough-sawn samples for both Japanese beech and sugi. The deviations for sawn samples were 4.6° and 2.9° for sugi and Japanese beech, respectively; the devia-tions for planed samples were 0.46° and 1.3° for sugi and Japanese beech, respectively. The results show that the sur-face quality affects the accuracy of the system. However, the effect on the final accuracy is not significant. In addition, the measured grain angle of sugi was more accurate than that of Japanese beech for planed samples and the mea-sured grain angle of Japanese beech was more accurate than that of sugi for sawn samples. This is because the interaction of the different tracheids and the different machining condi-tions causes a different blurred contour of the laser spot. The difference between them is not significant and the ef-fects of the interaction between the different sample prop-erties and the different machining conditions are generated only during the process of generating pictures. After gener-ating and capturing the laser spot scattering pattern picture
accurately, the accuracy of the whole system depends on the image processing technology.
Conclusions
We developed an on-line system to determine the grain angle using the tracheid effect to generate the laser scatter-ing pattern image, which was analyzed by the new ellipse analysis of the modified Hough transform. The results have shown that the on-line image analyzing system is effective and sufficiently robust to determine the grain angle for both sugi and Japanese beech for rough-sawn and planed samples. The measured grain angle is proportional to the real grain angle with zero intercept and a slope of 1. The deviations of sugi were 4.6° and 0.46° for sawn and planed samples, respectively; the deviations of Japanese beech were 2.9° and 1.3° for sawn and planed samples, respec-tively. There is an insignificant difference between the re-sults for Japanese beech and sugi under two machining conditions. However, the measured grain angle of sugi was better than that of Japanese beech for planed samples and the measured grain angle of Japanese beech was better than that of sugi for sawn samples. The results of both sugi and Japanese beech for planed samples were better than those for sawn samples.
References
1. Takada H, Horibe S, Murata A (1987) Working of wood surface I. Technique of fitting-cut system with a numerical-controlled router machine (in Japanese). Mokuzai Gakkaishi 33:934–940
2. Cyra G, Tanaka C, Nakao T (1996) On-line control of router feed speed using acoustic emission. Forest Prod J 46:27–32
3. McLauchlan, Norton JA, Kusec DS (1973) Slope-of-grain indica-tor. Forest Prod J 23:50–55
4. Soma T, Shida S, Arima T (2002) Calculation of grain angle and verification with spherical wood specimens using ultrasonic waves. Mokuzai Gakkaishi 48:407–412
5. Jerbi A, Mrad RB (1997) Determining grain orientation: an itera-tive scanning method. Proceedings of the 13th International Wood Machining Seminar, June 17–20, 1997, Vancouver, Canada, pp 333–344
6. Matthews PC (1987) Wood, light and objective scanning. Proceed-ings of the first international conference on scanning technology in sawmilling, 1987, San Francisco, pp XI1–XI13
7. Soest JF, Matthews PC (1987) Laser scanning technique for defect detection. Proceedings of the first international conference on scan-ning technology in sawmilling, 1987, San Francisco, pp XII1–XII10 8. Simonaho SP, Palviainen J, Tolonen Y, Silvennoinen R (2003) Determination of wood grain direction from laser light scattering pattern. Opt Laser Eng (in press)
9. Azriel R, Avinash CK (1976) Digital picture processing. Aca-demic, New York, pp 271–290
10. Haralick RM, Shapiro LG (1992) Computer and robot vision, vol 1. University of Washinton, Addison-Wesley, Boston, pp 555–631 11. Rosin PL (1993) Ellipse fitting by accumulating five-point fits.
Pat-tern Recogn Lett 14:661–669
12. Tsuji S, Matsumoto F (1978) Detection of ellipse by a modified Hough transformation. IEEE transactions on computer, vol c-27 (8):777–781
13. Suzuki J (1997) C/C mathematical algorithms for scientists and engineers (in Japanese). Kaibundo, Tokyo, pp 257–272
14. Shen J, Zhou JQ, Vazquez O (2000) Experimental study of optical scattering and fiber orientation determination of softwood and hard-wood with different surface finishes. Appl Spectrosc 54:1793–1804