PORK QUALITY ASSESSMENT THROUGH IMAGE
SEGMENTATION AND SUPPORT VECTOR MACHINE
IMPLEMENTATION
Raver John S. De Guzman1, David Nathaniel N. Niro2, Aldous Cesar F. Bueno3
1, 2, 3
Philippine Science High School-Central Luzon Campus Lily Hill, Clark Freeport Zone, Pampanga, Philippines
3
University of the Philippines Baguio, Baguio City, Philippines
*Corresponding E-mail : [email protected]
Abstract
Pork is the most consumed meat in the Philippines, and efficient quality control is essential for ensuring the safety of its consumers. Current manual procedures of meat inspection are time-consuming and laboratory-intensive considering the large amount of supply to be examined. This research aims to construct a rapid objective system of pork quality assessment with respect to meat freshness through Support Vector Machine (SVM) implementation, and to ultimately have an accuracy rate of ≥ 90%. 35 meat samples were collected, and their images were acquired. 30 of these were randomly designated as part of the training dataset while the rest were designated as part of the testing dataset. Of the 30 training samples, 6 were randomly chosen for the creation of a microbial profile. In all of the acquired image samples, image segmentation was performed and the RGB, HSV, Lab, and statistical texture features were extracted. These were inputted in 15 different SVM configurations. SVM classification yielded an accuracy rate of 93.33 %. Results from the microbial profile revealed considerable microbial activity at the 5th and 6th intervals (10th and 12th hour) with 2 and 3 colonies formed, respectively. With the ability of the SVM to distinguish between samples with respect to the hour interval and with the supplementation of the microbial profile, an objective artificial intelligence mechanism for freshness detection was successfully created.
Keywords: Meat quality, Image segmentation, Support vector machine, Artificial intelligence
Received:January 16, 2018 Accepted:January 25, 2018 Published:June 15, 2018
1.0 Introduction
Pork is the most consumed meat in the Philippines as of 2010. (Stanton, Emms, & Sia, 2010; Tiongco, Catelo, & Lapar, 2008). Despite the massive levels of production required to satisfy this demand, 98% of all pork supply are domestically generated (Stanton, Emms, & Sia, 2010).
On the other hand, the conventional laboratory methods used in assessing pork quality are time-consuming and expensive as they demand the preparation of various culture media and chemical reagents for parameter measurement (Kamruzzamana, Makinoa, & Oshitaa, 2015). Given the immense demand of pork in the Philippines, a faster and cost-efficient method of freshness detection is needed in order to efficiently regulate the quality of publicly available meat.
data that it would understand. Information from the environment of study must first be converted into parameters that can be manipulated and characterized mathematically (Song & Civco, 2004).
Image segmentation is the process of decomposing images into different elements. Its ability to represent environmental elements into mathematically recognizable quantities makes image segmentation a valuable tool for the formulation of a support vector machine (Song & Civco, 2004). The amalgamation of image segmentation and the support vector machine has the possibility to produce an objective system that can simulate human perception.
The existence of visual and tactile characteristics in meat makes it a viable target for image segmentation. By applying the principles of image segmentation and SVM analysis to the concept of meat freshness detection, an efficient procedure of freshness quantification can be created that does not rely on expensive chemical reagents and time-consuming laboratory procedures.
This study examines the feasibility of using a support vector machine in assessing the freshness of pork meat. Specifically, the study aims (1) to perform image segmentation on pork samples by extracting the RGB, HSV, Lab, and statistical texture features; (2) to substantiate the implications of extracted features through the creation of a microbial profile showing the progression of meat spoilage through time; (3) to formulate a support vector machine by training extracted feature data from segmented image samples; and (4) to establish an artificial intelligence system that is capable of efficiently classifying test data to its correct time interval with an accuracy of ≥ 90%.
2.0 Methodology
2.1 Acquisition of Meat Samples
A total of 35 fresh pork loin chop meat samples were acquired from the Cabanatuan City Public Market. Samples were randomly selected in different market stalls to reduce bias. They were also purchased immediately at the earliest hours of the market’s opening, in order to guarantee the accuracy of the sensory analysis, and were kept sterile prior to spoilage. The acquired samples were refrigerated prior to experimentation, and were kept sterile prior to spoilage. Five samples were randomly designated as part of the test set, and the rest were analyzed as part of the training data. Of the 30 that remained, six were chosen as representative meat samples for the microbial profile. All meat samples were digitally captured in a special illumination chamber for 12 hours at 2-hour intervals while being exposed at room temperature. The sample sizes were chosen since they meet the least population required for the assumption of a normal distribution, thus making the data viable for statistical analysis (Central Limit Theorem) (Glencross, 1986).
2.2 Creation of the Microbial Profile
Preparation of Meat Samples and Serial Dilution. This general procedure was similar to – but is not entirely based on – Rao & Ramesh’s study in 1988. The meat samples selected for the microbial profile were exposed at room temperature for 12 hours with 2-hour intervals. In each interval, 25 g of a meat sample was homogenized in 225 mL of 1% peptone water. Serial dilution was then performed by transferring 1 mL of the homogenized aliquot to 9 mL of 1% peptone water, with the newly formed solution vortexed for 5 seconds using a vortex mixer. This process was consecutively repeated three times by transferring 1 mL of the newly diluted solution to 9 mL of another 1% peptone water diluent and so on. Ultimately, four dilutions were created at the end of each interval: 10-2, 10-3, 10-4, and 10-5.
2.3 Image Segmentation and Feature Extraction
Image capture set-up. A smartphone (iPhone SE) was used for image capture using a resolution of 4000x3000 pixels. An image acquisition studio was assembled for the controlled and standardized acquisition of images, as seen in Figure 2.1. This chamber (dimensions 6” x 6”x 6”) was internally fitted with matte black paper and had a detachable lid containing a 4-cm diameter hole directly above the meat sample. The lid served as the surface where the smartphone camera rested during image capture. The flash of the smartphone was used for illumination; the flash was not set to auto and the direction of illumination was carefully placed in order to ensure uniformity for all samples.
Image segmentation and feature extraction. The digital images acquired were segmented using the ImageJ software. With 30 training samples and 5 test samples across 6 intervals, a total of 210 image samples were analyzed using the said image processor. The method of segmenting the meat from its background was partially inspired by the procedure of Chen, Sun, Qin and Tang (2008). First, the image was duplicated and binarized through mask conversion. Using the image calculator function, the Subtract operation was applied between the original image and the binarized duplicate. To reinforce background removal, the Subtract Background function was applied using a 2 px rolling ball radius. This process was repeated for each of the 180 samples. In order to automate the procedure, an ImageJ macro was coded which collectively segmented image samples from similar intervals via batch segmentation.
Color feature extraction was performed by manually encoding the histogram results of each segmented image. Only the RGB values are available on the ImageJ histogram, and calculations were made in order to convert them to the HSV and Lab color spaces. All in all, a total of eighteen features were extracted pertaining to color: this includes the means (μr, μg, μb, μh, μs, μv, μL, μa, μb) and the standard deviations (σr, σg, σb, σh, σs, σv, σL, σa, σb) of the segmented image in accordance with the corresponding color space. The means represent the average color values while the standard deviations represent the variations in color throughout the segmented region.
Statistical texture feature extraction was done through a publicly available GLCM plugin at the ImageJ website. The angular second moment and inverse difference moment were the extracted texture features, which measures the energy and homogeneity of an image, respectively.
2.4 Formulation of Support Vector Machine and Testing in RapidMiner
The acquired data sets were opened in RapidMiner and the SVM was selected as modeling technique. The six intervals were labeled A, B, C, D, E, and F in order of ascendance. The 186 training samples were inputted as training data for the SVM. To test its accuracy, it must correctly identify the interval where each of the 30 randomized test samples belongs.
All the different variants of SVM in the RapidMiner database were exhausted until the highest accuracy was reached. A total of 15 SVM configurations were used in the process. In order to bypass its binary limitations, all SVMs were configured to a multiclass scheme that implements a one-to-all system of classification.
3.0 Results and Discussion
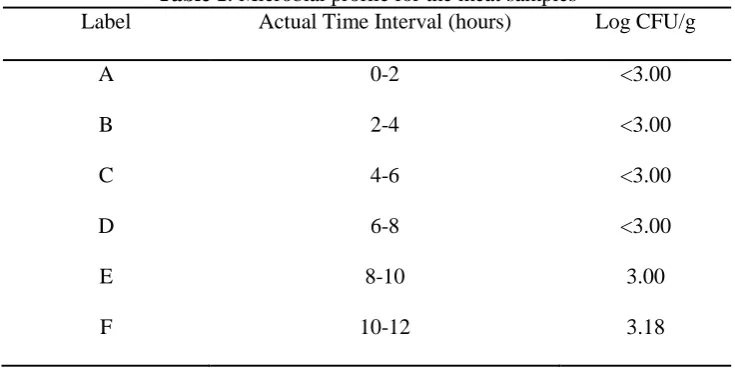
For the microbial profile, we have the following results.
Table 1: Microbial profile for the meat samples
Label Actual Time Interval (hours) Log CFU/g
A 0-2 <3.00
B 2-4 <3.00
C 4-6 <3.00
D 6-8 <3.00
E 8-10 3.00
F 10-12 3.18
After incubation, intervals A, B, C, and D showed no signs of colonies in their corresponding E.coli Petrifilms, thus resulting to a log CFU/g of less than 3.00. As seen in Table 5.1, Interval E showed 2 colonies (1 for each duplicate) resulting to a log CFU/g of 3.00, while Interval F showed 3 colonies (1 colony and 2 colonies for each of the duplicates) resulting to a log CFU/g of 3.18.
For the classification produced by the non-kernel variants, we have the following result for accuracy.
Table 2: Tabulated Results for SVM Classification Performance produced by non-kernel variants
Variant Accuracy
jMySVM 53.33%
Fast Lane Margin 50.00%
Hyper Hyper 20.00%
Table 3. Tabulated Results for SVM Classification Performance produced by kernel variants
Variant Linear Kernel Polynomial Kernel RBF Kernel
mySVM 53.33% 56.67% 53.33%
LibSVM 86.67% 93.33% 76.67%
Evolutionary 26.67% 36.67% 16.67%
PSO 36.67% 13.33% 16.67%
performance losses suffered by the three other kernel variants (Rapidminer, 2017; Chang & Lin, 2013).
In examining the results in Table 3 closely, one can observe that the polynomial and linear kernels performed better in general than the RBF. According to a study by Keerthi and Lin (2003), a fully-tweaked RBF kernel will always be more efficient than a native linear mechanism (Keerthi & Lin, 2003). In this study, the kernel functions were no longer tweaked due to insufficient computing power, and the kernels were left in their natural state. Taking the insights from Keerthi and Lin (2003), the poor performances achieved by the RBF kernel is due to the lack of tuning in its parameters. As the unchanged RBF is no longer fit for the data set, it is only natural for linear and polynomial kernels to take its place, which they did with significant margins (Keerthi & Lin, 2003). It is worth noting that the best SVM performance recorded in this study was achieved through the utilization of a polynomial kernel function.
With the success of data correlation through time characterized by a commendable accuracy rate, the SVM was proven to be capable of simulating sensory analysis (Chen, Sun, Qin, & Tang, 2010). Additionally, the microbial profile shown in Table 3.1 allows the set-up to detect the degree of meat freshness at the microbiological level, since the meat samples used for profiling were also part of the training data.
4.0 Conclusion and Recommendation
The artificial intelligence mechanism used in this study achieved an accuracy rate
of 93.33%. This high accuracy rate solidifies the success of the image segmentation’s
execution. LibSVM outperformed the 14 other configurations used in this study, given its
intrinsic architectural properties that allowed it to bypass the binary limitations of the
native SVM. Polynomial and linear kernels showed a general trend of having higher
accuracy rates than the theoretically-better RBF, but a research study shows that the
efficiency of the RBF lies in the manner of how its parameters were tuned. The
commendable classification performance attained suggests that the SVM is capable of
distinguishing among the different hours in which the meat samples were categorized.
Thus, when it comes to the objective assessment of pork quality, the SVM mechanism is
a fitting choice for rapid and automated results, capable of simulating sensory perception
and freshness detection at the microbiological level. In conclusion, with the
supplementation of a microbial profile which confirmed E. coli coliform presence from
the 10th hour onwards, an objective mechanism capable of assessing pork quality with
respect to meat freshness was created. Ultimately, an accuracy rate of ≥ 90% was
achieved, and the study was successfully accomplished.
A possible extension of this study is to attain an accuracy rate of ≥ 95%. To increase the accuracy rate, we suggest to the following methods:
increase the number of meat samples use more powerful support vector machines
obtain a computer that could handle high computing processes
References
Azanza, M. P. (2006). Philippine Foodborne-Disease Outbreaks. Journal of Food Safety, 92-102.
Barbri, N. E., Llobet, E., Bari, N. E., Correig, X., & Bouchikhi, B. (2008). Electronic Nose Based on Metal Oxide Semiconductor Sensors as an Alternative Technique for the Spoilage Classification of Red Meat. Sensors, 8(1), 142-156.
Barghout, L., & Lee, L. (2004). California Patent No. US20040059754 A1.
Bureau of Product Standards. (2008). Philippine National Standard: Pork Cuts. Retrieved from Department of Agriculture: http://sps_issuances.da.gov.ph/attachments/article/856/PNS-BAFPS%2041-2008.pdf Campos, J., Gil, J., Mourão, J., Peixe, L., & Antunes, P. (2015). Ready-to-eat street-vended food as a
potential vehicle of bacterial pathogens and antimicrobial resistance: An exploratory study in Porto region, Portugal. International journal of food microbiology, 206, 1-6.
Conedera, G., Mattiazzi, E., Russo, F., Chiesa, E., Scorzato, I., Grandesso, S., ... & Caprioli, A. (2007). A family outbreak of Escherichia coli O157 haemorrhagic colitis caused by pork meat salami. Epidemiology and infection, 135(02), 311-314.
Chang, C.-C., & Lin, C.-J. (2013, March 4). LIBSVM: A Library for Support Vector Machines. Retrieved
from Academia.edu:
http://s3.amazonaws.com/academia.edu.documents/30840517/libsvm.pdf?AWSAccessKeyId=AKIAIW OWYYGZ2Y53UL3A&Expires=1492350356&Signature=d4NvexCYNiOJQ3yaUWUe%2B84U4bc%3
D&response-content-disposition=inline%3B%20filename%3DLIBSVM_A_library_for_support_vector_ma
Chen, K., Sun, X., Qin, C., & Tang, X. (2010). Color grading of beef fat by using computer vision and support vector machine. Computers and Electronics in Agriculture, 27-32.
Cheng, H., Jiang, X., Sun, Y., & Wang, J. (2001). Color image segmentation:. Pattern Recognition, 34 (12), 2259–2281.
Department of Agriculture. (2005). Implementing Rules and Regulations Pursuant to Republic Act No. 9296, Otherwise Known as “The Meat Inspection Code of the Philippines. Retrieved from Department of Agriculture: http://www.wipo.int/edocs/lexdocs/laws/en/ph/ph147en.pdf
Department of Agriculture. (2013). RULES AND REGULATIONS GOVERNING MEAT INSPECTION: ANTE-MORTEM AND POST-MORTEM OF LIVESTOCK IN THE PHILIPPINES. Department of Agriculture.
Due Trier, Ø., Jain, A., & Tax, T. (1996). Feature extraction methods for character recognition-A survey. Pattern Recognition, 641-662.
Dufour, A. P. (1977). Escherichia coli: the fecal coliform. In Bacterial indicators/health hazards associated with water. ASTM International.
Fan, R.-E., Chang, K.-W., Hsieh, C.-J., Wang, X.-R., & Lin, C.-J. (2008). LIBLINEAR: A Library for Large Linear Classification. The Journal of Machine Learning Research, 9, 1871-1874.
Faustman, C. (1990). THE BIOCHEMICAL BASIS FOR DISCOLORATION IN FRESH MEAT: A REVIEW. Journal of Muscle Foods, 1(3), 217-243.
Food and Agricultural Organization. (2016, August 8). Understanding Codex. Retrieved from FAO: http://www.fao.org/fao-who-codexalimentarius/about-codex/understanding-codex/en/
Glassner, A. (1989). An Introduction to Ray Tracing. San Francisco: Morgan–Kaufmann.
Glencross, M. (1986). A Practical Approach to the Central Limit Theorem. ICOTS (pp. 91-95). South Africa: University of the Witwatersrand.
Guyon, I., & Elisseeff, A. (2003). An Introduction to Variable and Feature Selection. Journal of Machine Learning Research, 1157-1182.
Hu, J., Li, D., Duan, Q., Han, Y., Chen, G., & Si, X. (2012). Fish species classification by color, texture and multi-class support vector machine using computer vision. Computers and Electronics in Agriculture, 133-140.
Kamruzzamana, M., Makinoa, Y., & Oshitaa, S. (2015). Non-invasive analytical technology for the detection of contamination, adulteration, and authenticity of meat, poultry, and fish: A review. Analytica Chimica Acta, 853, 19-29.
Lin, C., Chen, R., & Chan, Y. (2009). A smart content-based image retrieval system based on color and texture feature. Image and vision Computing, 27 (6), 658–665.
Littmann, E., & Ritter, H. (1997). Adaptive color segmentation-a comparison of neural. IEEE Transactions on Neural Network, 8 (1), 175–185.
Rapidminer. (2017). Rapidminer [Computer Software]. Retrieved from Rapidminer.com: https://my.rapidminer.com/nexus/account/index.html#downloads
Song, M., & Civco, D. (2004). Road Extraction Using SVM and Image Segmentation. Photogrammetric Engineering & Remote Sensing, 12(7), 1365-1371.
Stanton, Emms, & Sia. (2010). The Philippines Pig Farming Sector. Singapore: Canadian Embassy. Vapnik, V., & Cortes, C. (1995). Support-Vector Networks. Machine Learning, 273-297.
Young, H., & Freedman, R. (2012). University Physics with Modern Physics. San Francisco: Addison-Wesley.
Zhang, L., Zhou, W., & Jiao, L. (2004). Wavelet Support Vector Machine. IEEE Transactions on Systems, Man and Cybernetics, 34(1), 34-39. Retrieved from https://www.semanticscholar.org/paper/Wavelet-support-vector-machine-Zhang-Zhou/0848ad52c4e3cbddb78049b42b75afe25112b26d/pdf