Published online April 10, 2014 (http://www.sciencepublishinggroup.com/j/ajmp) doi: 10.11648/j.ajmp.20140302.19
Tornadoes and the global anisotropy of the physical
space
Yuriy Alexeevich Baurov
1, 4, *, Igor Fedorovich Malov
2, Francesco Meneguzzo
31
Closed Joint Stock Company Research Institute of Cosmic Physics, Moscow Region, Korolyov, Pionerskaya, Russia
2
Pushchino Radio Astronomy Observatory, P.N.Lebedev Physical Institute, Russian Academy of Sciences, Moscow Region, Pushchino, Russia
3
Institute of Biometeorology, National Research Council, Firenze, Via Caproni, Italy
4
Present address: Hotwater Srl, San Miniato (PI), Via Gioberti, Italy
Email address:
[email protected] (Yu.A. Baurov), [email protected] (I.F. Malov), [email protected] (F. Meneguzzo)
To cite this article:
Yuriy Alexeevich Baurov, Igor Fedorovich Malov, Francesco Meneguzzo. Tornadoes and the Global Anisotropy of the Physical Space. American Journal of Modern Physics. Vol. 3, No. 2, 2014, pp. 93-112. doi:10.11648/j.ajmp.20140302.19
Abstract:
Whereas the basic physical mechanisms leading to the onset and evolution of tornadoes have been well established, some progress can still be useful to identify the conditions supporting the development of a tornado towards a violent or catastrophic stage, as well as possible specific and observable events triggering the onset of a tornado in a generally favorable atmospheric environment. On the basis of an assumed global anisotropy of the physical spaceand the associated non-gauge byuon theory, an additional mechanism of energy accumulation in the process of development of a tornado to its mature stage is proposedand its consistency is checked against a dataset of individual tornadoes as well as of tornado outbreaks. The results point to a significant link between the angle formed by the cosmological vector potentialrepresenting the global anisotropy of the physical space and the surface tangent to the local Earth’s surface and the occurrence of the most energetic tornadoes; as a consequence, such tornadoes are shown to occur only at specific times of the day depending on latitude, longitude and day of the year. Moreover, a further additional mechanism is proposed for the early origin of a tornado, on the basis of the interaction of a large peak current lightning discharge with the cosmological vector potential introduced by the byuon theory. It is shown how, in the framework of the proposed theory, a fraction of the energy of a tornado at its onset stage can originate from the self-energy associated with the formation of the physical space of elementary particles located along the lightning discharge. The verification of the proposed mechanism for the onset of tornadoes is delayed to later time when suitable data sets will be available.Keywords:
Tornado, Fujita scale, Anisotropy of the physical space, Byuon theory, Lightning1. Introduction
The nature of the origin of tornadoes, especially those developing into violent ones (F3 to F5 on the Fujita scale) has always been of great interest for researchers, since the destructive energy of such tornadoes is comparable with the energy of nuclear explosions, i.e. on the order of 20 kton of TNT, or 1014 J[1].
A great deal of theoretical and modeling work was performed regarding the onset and time evolution of tornadoes[1–3], as well as very effective conceptual models were developed, as summarized byKufa and Snow [4].
Numerical simulations of real tornadoes sometimes suffer from significant underestimation of their intensity, even using the most advanced mesoscale or local scale meteorological models, such as the state of the art
WRF-NMM model used inLitta et al. [5]: their F3 tornado occurred in India was simulated as a much weaker F0 one (peak wind speed around 20 ms-1 against the observed 70ms-1), that is most of its real energy was not caught by the simulation.Nevertheless, such models have been successfully used for the simulation and prediction of the local atmospheric “ingredients” leading to tornadoes[6].
Besides the maximum intensity based on damages (Fujita classification) which is heavily dependent upon the strength of the winds inside the tornado, recently the path length and the path width of a tornado were included in a more comprehensive and physically consistent analysis of its overall energy in the effort to derive a power law describing the temporal behavior of tornadoes analogously to Earthquakes [7].
as the process of their development from the leader stroke to the return stroke, including possible multiplicity, are presented in several works [8,9]; as well, a large observational evidence exist about the connection between lightning and tornadoes, such as summarized in Price[10]where it was tornadoes are associated with certain lightning signatures, in particular with a “jump” in total lightning (IC + CG) few minutes before tornado touchdown and a shift in the CG lightning polarity to a positive one around the time of tornado sightings.
The prevalence of the otherwise relatively rare positive cloud to ground lightning flashes (+CG) around the time of tornado formation or touchdown is especially relevant because +CG carry on average one order of magnitude larger electric currents than their negative counterparts (-CG) with peak currents up to more than 200kA[9,11,12].
InMarshall and Stolzenburg[13] an extensive review of lightning in different moist convective environments is performed, setting the upper and lower limits of the energy produced by the lightning flashes to 1010 J and 107 J, respectively, the upper limit for CG flashes being later reduced to about 2⋅109 J[14]. It can be stated therefore that a CG flash can develop a quantity of energy 4 to 5 orders of magnitude less than the most violent tornadoes.
Some additional contribution could still be useful to explain the origin and source of the huge energy of the most powerful tornadicevents, both at their onset and in the course of their development in time; this is the subject of the present work and will be performed in the frame of a known physical theory not yet applied to the field of atmospheric sciences.
The paper is organized as follows: Section 2 describes the datasets used for the verification of the proposed physical processes concerning the development of tornadoes; in Section 3 theoretical insights are proposed about the byuon theory and the global anisotropy of the physical space (Section3.1.), the role of such anisotropy for the additional energy supply to tornadoes (Section3.2.), as well as a proposed mechanism for the onset of tornadoes from very large peak current lightning (Section3.3.);
Section4 shows the results of the verification of the processes explained in Section3.2. as well as the respective discussion. The conclusions and the perspectives for further work are set out in Section 5, the last of this article.
2. Tornado Datasets
The verification of the hypothesis and the processes proposed in this article would require in principle the construction of datasets including both tornado events and the associated lightning data. Nevertheless, as explained in Section 3.3., at the present time sufficient detail is not available for the needed lightning data and the verification will be limited to the processes described in Section 3.2. that are based upon the link between tornadoes, discriminated on the basis of their overall energy, and the global anisotropy of the physical space.
Therefore, only data concerning tornadoes are needed at this stage of the research, including date, time, peak intensity, geographical coordinates of tornado’s touchdown and its path length.
Tornado reporting worldwide lags very much behind the quality used in the U.S.A., to which country therefore refer most of the data use in this article.
The first dataset includes 139 violent tornadoes, i.e. F3 to F5 on the Fujita scale, from the period 1989 to October, 2013. The selection of the tornado events was performed picking up at least the most intense event from several outbreaks occurred in the 25-years period, provided that the touchdown (TD) time and the path length were available, as well that the most intense event were at least an F3. For several outbreaks more than one event were included provided they were sufficiently distant in space (at least about 0.5° in latitude or longitude) and/or in time (at least about one hour), resulting in a total of 83 outbreaks with 42 tornadoes classified as F3, 76 events in the class F4 and 21 catastrophic F5 tornadoes, all hitting the U.S.A. except one F5 event occurred in Manitoba, Canada.
Table1 lists the above mentioned 139 tornado events.
Table1.Tornado events used to build Fig. 4, Fig. 5(a) and Fig. 5(b) in Section 4. In the “Source” column, the abbreviations PE, SE and CA refer to the tornado events dealt with in Perez et al. [15],Seimon [16] and Carey et al.[17], respectively; SPC [18] and THP [19] refer to databases of tornado events. It’s to be noted that the sources SPC and THP were used throughout the listed tornado events. The standard abbreviations for the U.S. States as well as for the Time zones were used. The abbreviation TD stays for “touchdown”. In the “Outbreak” column the F4 and F5 events belonging to the tornado outbreaks listed in Table 2 and used to build Fig. 6(a-v) are indicated.
Source U.S. States
or Country Date TD time
Time zone TD Lat (°) TD Lon (°) Path length (km) Outbreak
F3 Intensity class
SPC+THP TX 27-May-97 1:27 PM CST 31.100 -97.367 2.2
SPC+THP TX 27-May-97 12:46 PM CST 31.300 -97.367 5.9
SPC+THP IN 18-Oct-07 9:03 PM EST 38.333 -85.317 7.7
SPC+THP AL 10-Jan-08 4:20 PM CST 33.283 -87.300 7.8
SPC+THP NY 31-May-98 5:30 PM EST 42.533 -75.083 8.0
SPC+THP KS 15-May-95 9:20 PM CST 37.883 -100.667 9.6
SPC+THP KS 16-May-95 5:16 PM CST 37.983 -100.867 9.6
Source U.S. States
or Country Date TD time
Time zone
TD Lat (°)
TD Lon (°)
Path length
(km)
Outbreak
SPC+THP OK 10-May-10 4:48 PM CDT 35.333 -97.083 11.0
SPC+THP KY 18-Oct-07 7:09 PM CST 37.450 -87.083 12.0
SPC+THP NC 15-Nov-08 3:10 AM EST 35.483 -77.517 13.0
SPC+THP PA 31-May-98 8:00 PM EST 40.483 -75.750 13.3
SPC+THP OK 3-May-99 2:46 PM CST 34.967 -98.117 14.0
SPC+THP GA 13-Feb-00 11:42 PM EST 31.233 -84.217 14.4
SPC+THP TX 27-May-97 3:05 PM CST 30.500 -97.833 14.7
SPC+THP TX 25-Dec-12 9:05 AM CST 31.167 -95.317 15.6
SPC+THP MS 10-Jan-08 11:51 AM CST 32.583 -89.533 16.0
SPC+THP OK 3-May-99 7:41 PM CST 35.767 -98.150 19.0
SPC+THP PA 31-May-98 7:50 PM EST 39.817 -79.083 20.8
SPC+THP IL 7-Jan-08 3:30 PM CST 42.267 -88.383 21.0
SPC+THP MO 17-May-95 8:34 AM CST 37.833 -94.500 22.4
SPC+THP MS/AL 10-Jan-08 2:13 PM CST 33.417 -88.183 22.4
SPC+THP GA 14-Feb-00 12:49 AM EST 31.067 -84.083 24.0
SPC+THP AL 23-Jan-12 3:58 AM CST 33.700 -86.800 24.9
SPC+THP FL 2-Feb-07 3:10 AM EST 28.883 -82.050 26.1
SPC+THP PA 31-May-98 7:20 PM EST 41.217 -74.867 32.0
SPC+THP IN 18-Oct-07 9:18 PM EST 41.267 -85.600 32.0
SPC+THP AR 31-Dec-10 6:05 AM CST 35.983 -94.567 34.0
SPC+THP MO 29-Feb-12 4:00 AM CST 36.900 -90.217 34.0
SPC+THP GA 30-Jan-13 11:12 AM EST 34.333 -84.950 35.1
SPC+THP TX 7-May-95 3:10 PM CST 33.767 -97.333 41.6
SPC+THP FL 2-Feb-07 3:37 AM EST 28.967 -81.583 42.0
SPC+THP MO 7-Jan-08 6:29 PM CST 37.167 -93.067 42.0
SPC+THP WI 18-Jun-01 7:06 PM CST 45.783 -92.733 48.3
SPC+THP NY 31-May-98 3:22 PM EST 42.933 -73.800 48.8
SPC+THP MO 31-May-13 7:50 PM CDT 38.683 -90.750 52.3
SPC+THP MA 1-Jun-11 3:17 PM EST 42.067 -72.450 60.0
SPC+THP KS 10-May-10 2:43 PM CST 36.867 -97.817 66.0
SPC+THP IL 9-May-95 4:22 PM CST 39.783 -89.650 80.0
SPC+THP MS 25-Dec-12 3:20 PM CST 30.650 -89.683 97.2
SPC+THP NY 31-May-98 4:30 PM EST 42.067 -76.150 99.2
SPC+THP MO 11-Apr-01 10:30 AM CST 40.400 -94.317 122.4
F4 intensity class
SPC+THP TX 15-May-13 7:06 PM CST 32.383 -97.733 4.4
PE CT 10-Jul-89 4:30 PM EST 41.317 -72.933 5.0
PE KS 15-Jun-92 6:30 PM CST 39.450 -98.217 5.0
PE OK 26-Apr-91 8:45 PM CST 36.450 -95.700 6.0
SPC+THP AR 15-Apr-98 1:50 AM CST 35.883 -90.167 8.0 X
SPC+THP TX 27-May-97 3:50 PM CST 30.283 -97.800 9.0
SPC+THP TX 25-Apr-94 8:30 PM CST 32.600 -96.767 9.6
SPC+THP MX / TX 24-Apr-07 5:30 PM CST 28.417 -100.317 10.0
PE MN 16-Jun-92 4:18 PM CST 44.033 -95.817 11.0 X
SPC+THP MA 29-May-95 6:07 PM EST 42.200 -73.367 12.0
Source U.S. States
or Country Date TD time
Time zone
TD Lat (°)
TD Lon (°)
Path length
(km)
Outbreak
SPC+THP KS 28-May-13 5:39 PM CDT 39.050 -97.717 15.3
SPC+THP KY 2-Mar-12 4:23 PM EST 38.783 -84.633 15.9
PE TX 25-Apr-90 3:44 PM CST 33.050 -96.617 16.0
PE MO 29-Nov-91 6:05 PM CST 37.050 -93.300 16.0
PE OK 11-May-92 3:00 PM CST 34.717 -95.850 16.0
SPC+THP AL 1-Mar-07 1:08 PM CST 31.283 -85.917 16.0
PE IA 31-May-89 6:50 PM CST 42.433 -93.183 18.0
PE IN 2-Jun-90 7:50 PM EST 39.833 -86.033 18.0
SPC+THP VA 6-Aug-93 12:30 PM EST 37.200 -77.400 19.6
PE IL 2-Jun-90 5:07 PM CST 39.067 -88.083 20.0
PE NC 5-May-89 7:01 PM EST 34.933 -80.550 21.0
PE KS 26-Mar-91 6:45 PM CST 37.967 -98.050 21.0
PE NC 5-May-89 5:54 PM EST 35.733 -80.683 22.0
SPC+THP IN 26-Apr-94 11:58 PM EST 40.450 -86.917 22.4
CA SD 30-May-98 7:26 PM CST 43.733 -97.600 22.5
PE SC 5-May-89 5:20 PM EST 34.950 -81.933 24.0
SPC+THP OK 3-May-99 8:10 PM CST 35.933 -97.950 24.0 X
PE TX 16-May-89 11:08 PM CST 29.300 -100.350 27.0
SPC+THP AL 16-Dec-00 11:54 AM CST 33.200 -87.533 28.8
PE IN 2-Jun-90 8:20 PM EST 38.883 -86.050 29.0
SPC+THP AL 1-Mar-07 12:27 PM CST 32.117 -87.417 29.5
PE AL 15-Nov-89 4:30 PM CST 34.700 -86.750 30.0
PE IA 13-Mar-90 4:53 PM CST 42.067 -91.683 30.0 X
SPC+THP NE 4-Oct-13 5:12 PM CDT 42.133 -97.083 31.0
PE MS 9-Mar-92 9:40 PM CST 33.000 -90.833 32.0
PE TX 27-Jun-92 6:31 PM CST 32.650 -96.717 32.0
PE TX 21-Nov-92 3:27 PM CST 29.783 -95.317 32.0
SPC+THP OK 19-May-13 6:00 PM CDT 35.250 -97.150 32.0
SPC+THP KS 4-May-03 3:18 PM CST 39.067 -94.833 33.6 X
PE IL 7-Jan-89 5:19 PM CST 38.417 -87.817 35.0
PE TX 1-Jun-90 4:20 PM CST 31.417 -103.500 35.0
SPC+THP OK 10-May-10 4:32 PM CST 35.200 -97.417 35.0
SPC+THP MS 10-Feb-13 5:03 PM CST 31.183 -89.183 36.2
PE IL 2-Jun-90 4:45 PM CST 41.950 -88.250 37.0
SPC+THP TN 10-Apr-09 11:19 AM CST 35.850 -86.417 37.5
SPC+THP OK 10-May-10 4:20 PM CST 35.317 -97.517 38.0
SPC+THP KS 3-May-99 7:13 PM CST 37.317 -97.400 39.0 X
PE GA 22-Nov-92 11:44 AM EST 33.900 -84.567 41.0
SPC+THP IL 29-Feb-12 4:51 AM CST 37.733 -88.550 42.6
PE KY 22-Nov-92 4:52 PM EST 38.667 -85.067 43.0
PE NE 15-Jun-90 6:00 PM CST 40.183 -101.067 45.0
SPC+THP KS 28-Feb-07 7:24 PM CST 38.133 -95.100 45.0
SPC+THP AR 21-Jan-99 4:45 PM CST 36.317 -90.600 46.0
SPC+THP TN 18-May-95 3:52 PM CST 35.033 -87.500 46.4
PE OK 26-Apr-91 7:10 PM CST 36.300 -96.700 51.0
Source U.S. States
or Country Date TD time
Time zone
TD Lat (°)
TD Lon (°)
Path length
(km)
Outbreak
PE IN 2-Jun-90 10:00 PM EST 39.217 -84.850 53.0
SPC+THP OK 10-Feb-09 6:48 PM CST 33.567 -97.350 56.0 X
SPC+THP OK 3-May-99 8:25 PM CST 35.883 -97.683 63.0 X
PE MS 22-Nov-92 12:14 AM CST 31.867 -89.550 64.0
SPC+THP KS 14-Apr-12 4:32 PM CST 38.467 -98.083 65.8
PE NY 10-Jul-89 1:27 PM EST 41.533 -74.233 68.0
SPC+THP AL 27-Mar-94 10:55 AM CST 33.733 -86.133 76.0
SPC+THP AR 24-May-11 11:10 PM CST 35.450 -93.767 76.0
PE IA 24-May-89 5:11 PM CST 41.067 -94.683 79.0
SPC+THP IN/KY 2-Mar-12 2:50 PM EST 38.433 -86.183 79.0
SPC+THP IL 13-May-95 3:18 PM CST 40.617 -91.283 80.0
SPC+THP OH 10-Nov-02 2:15 PM CDT 40.783 -84.767 84.5
PE IA 24-May-89 5:20 PM CST 41.167 -92.900 106.0
PE OK 26-Apr-91 5:30 PM CST 36.300 -96.417 106.0
SPC+THP MN 29-Mar-98 3:50 PM CST 43.950 -95.567 108.0
PE IL 2-Jun-90 5:20 PM CST 40.400 -91.333 170.0
SPC+THP AR 5-Feb-08 4:50 PM CST 35.067 -93.100 196.0
PE NE 13-Mar-90 5:05 PM CST 40.233 -98.567 198.0 X
PE MS 21-Nov-92 11:27 PM CST 31.900 -90.367 206.0
F5 intensity class
SPC+THP Manitoba
(Canada) 22-Jun-07 6:30 PM CDT 49.900 -97.800 6.0
SPC+THP TX 27-May-97 2:40 PM CST 30.833 -97.600 8.2
SPC+THP WI 18-Jul-96 6:05 PM CST 43.683 -88.583 21.3 X
PE+SE IL 28-Aug-90 2:15 PM CST 41.550 -88.433 26.0 X
PE MN 16-Jun-92 4:00 PM CST 43.717 -95.817 26.0 X
SPC+THP OK 31-May-13 6:03 PM CDT 35.533 -97.950 26.1
SPC+THP OK 20-May-13 2:56 PM CDT 35.267 -97.417 27.0
SPC+THP KS 13-Mar-90 5:30 PM CST 38.150 -97.433 35.0 X
SPC+THP KS 4-May-07 8:20 PM CST 37.367 -99.167 35.0
SPC+THP MO 22-May-11 4:34 PM CST 37.083 -94.517 35.6 X
SPC+THP MS 27-Apr-11 1:30 PM CST 32.933 -88.867 47.0 X
SPC+THP MS 27-Apr-11 2:42 PM CST 34.050 -88.417 60.0 X
SPC+THP AL 27-Apr-11 5:19 PM CST 34.450 -85.900 60.0 X
SPC+THP OK 3-May-99 5:23 PM CST 35.133 -97.850 61.0 X
SPC+THP IA 25-May-08 3:48 PM CST 42.567 -92.783 69.0
PE KS 26-Apr-91 4:57 PM CST 37.867 -96.833 74.0
SPC+THP AL 8-Apr-98 6:01 PM CST 33.283 -87.833 80.0 X
SPC+THP TN 16-Apr-98 3:50 PM CST 35.283 -87.550 80.0 X
SPC+THP OK 24-May-11 2:50 PM CST 35.567 -97.967 105.0
PE KS 13-Mar-90 4:34 PM CST 38.000 -97.350 112.0 X
In order to perform a more detailed and robust analysis of the hypothesized link between the tornadoes and the global anisotropy of the physical space, a further database concerning eleven tornado outbreaks occurred in the period 1990-2011 was built, including all the events occurred in each outbreak and covering different months, seasons and times of the day. All the tornado outbreaks hit the U.S.A. with one of them, occurred on August 28, 1990, extended to Ontario, Canada; all outbreaks cover a portion of a single day but two of them that covered two consecutive days, as well as they include at least one F5 tornado but two of them
where the strongest tornadoes were F4. The considered tornado outbreaks span the months of February, March, April, May, June, July, August which fall into three of the seasons, as well as single tornado events occur practically every time of the day and at any latitude between about 30°N and 50°N.
All in all, 434 tornadoes populate the second database, with 100 tornadoes classified as F0, 150 events classified as F1, 92 tornadoes in the F2 class, 57 in the F3 class, 22 violent F4 tornadoes and 13 catastrophic F5 events.
Table2 lists the above mentioned 11 tornado outbreaks.
Table2. Tornado outbreaks used to build Fig.6(a-v) in Section 4. For any outbreak, the number of tornadoes in each intensity class from F0 to F5 is indicated. The data are extracted from the SPC [18]and THP [19]databases of tornado events.
Date U.S. States or Country Nr. of F0 Nr. of F1 Nr. of F2 Nr. of F3 Nr. of F4 Nr. of F5
March 13, 1990 IA, KS, MO, NE, OK, TX 10 20 13 10 2 2
August 28, 1990 IL, MI, NY, Ontario (Canada) 4 4 2 1 0 1
June 16, 1992 IA, MN, NE, ND, SD 15 15 21 10 1 1
July 18, 1996 WI 6 2 1 0 0 1
April 8, 1998 AL, AR, GA, LA, TN, TX 4 5 3 1 0 1
April 15-16, 1998 AL, AR, GA, IL, IN, KY, MI, MS, MO, TN 24 15 12 7 1 1
May 03, 1999 KS, OK 9 12 7 6 3 1
May 04, 2003 AR, IL, KS, KY, MO, OK, TN 9 23 11 9 6 0
February 10-11, 2009 AR, MO, OK, TN, TX 3 9 1 0 1 0
April 27, 2011 AL, MS 14 39 17 13 8 4
May 22, 2011 AR, IL, IA, KS, MO, OK 2 6 4 0 0 1
3. Theoretical Insights
3.1. The Global Anisotropy of the Physical Space and the Byuon Theory
In[20,21]the earliest experiments are described where a fundamental anisotropy of the physical space as well as a new non-gauge interaction, different from the four known ones (strong, weak, electromagnetic, and gravitational), were first detected. Besides the lack of gauge invariance, an important feature of this new interaction is just its anisotropy that arises in a wide range of sizes, from the weak interactions, i.e. 10−19 m[22],up to the size of our Galaxy, i.e. 1021 m [23], and more[24].
The physical nature of the new force is explained by the byuon theory, a non-gauge theory of the formation of the physical space and the world of elementary particles from some unobservable objects called “byuons”[25–27].
According to the byuon theory [32]the potentials of physical fields can act upon the process of mass formation of the elementary particles because a fraction of such mass, associated with the formation of their inner space, is proportional to the modulus of a summary potential AΣ, i.e.
thesum of the potentials of all known force fields calculated using the energy relationexpressed by Eq. (3.1.) in Baurov and Malov[28]. Such summary potential cannot exceed, by
magnitude, the modulus of the cosmological vectorial potential Ag ,a new fundamental constanthaving absolute value ≈1.9⋅105T⋅m
g
A .
As the result of the action of the field potentials
(decreasing AΣ ), each particle gains an energy
∆
m⋅
c
2that corresponds to a new force of nature throwing substance out of the region with the weakened
A
Σ . Experimental investigations with the use of gravimeters and magnets and plasma systems[29], as well as the measurements of changes in the β-decay rate of radioactive elements[22,30], that were later confirmed by independent researches [31], have shown that the substance is ejected from the region with the weakened AΣalong a cone with anangular opening about 100° around the vector Ag determining the global anisotropy of the physical space and having the following astronomical coordinates in the second equatorial system: α≈293°±10° ,δ ≈36°±10° , where α is the right ascension and δ is the declination.
Fig. 1. Projection of the cosmological vector potential Ag onto a simplified
Earth’s orbital plane; VE is the Earth’s instantaneous velocity vector.
The analysis of a long run of experiments has shown that the new force has a nonlinear and nonlocal character and can be represented as a complex series in terms of changes of the summary potential AΣ as per Eq.(4) in Baurov [21]. The first term of the series is the following:
2 2
1
2 v [ ( ) / ]
F = Nm c
λ
∆AΣ ∆ ∆AΣ ∆x (1)where N is the number of stable particles (electrons, protons, and neutrons) in the test body,
∆
A
Σ is the difference in changes of the summary potential AΣ at thelocation points of a test body and sensor element,
( )
∆
A
∆
x
∆
Σ/
is the gradient in space of the difference potentials∆
A
Σ;x
is the length of an arc of a circle for experiments with solenoids, therefore a space coordinate;eV
33
2
m
c
2=
v ;
-1 6 1 10 (Tm)
− =
λ is the first coefficient of
the series.
The fundamental research of the global anisotropy of physical spacealong with the basics of the byuon theory
based upon such anisotropy is summarized in
Baurov[32]which includes all the relevant bibliography. The revealed anisotropic properties of the physical space were found to affect as well very powerful geophysical processes such as the strongest earthquakes, offering a chance for a deeper understanding and even a reference framework for a possible prediction in future [33].
The following few consequences of the byuon theory are most important in the context of this article:
Extremely high magnitude magnetic vector potentials having a large component anticollinear with respect to the cosmological vector potential Ag can effectively weaken the summary potential AΣ,
resulting in an acceleration of the surrounding substance along a conical path[32].
The potential of the Earth’s gravitational field is always negative and decreases in absolute value with height from the local surface, therefore as per Eq. (1) a particle rising from the surface with high enough speed, experiencing a substantial rate of
decrease of the gravitational potential, is subjected to an upward force towards higher values of the summary potential AΣ.
Quantum states of the byuons interact in regions of weakened summary potential to minimize their potential energy, creating the fundamental one-dimensional physical space along with rotation of the material substance around an axis perpendicular to the cosmological vector potential Ag, which arises from the residues of such minimization [27]. More precisely, most of the residual potential energy of interaction of byuons in the fundamental one-dimensional space created by the byuons themselves converts into the spin of primary particles, such as the electron, any lepton, etc., as well as into its mass; according to the byuon theory, any natural rotation such as the rotation of planets, stars, galaxies and the expected rotation of the Universe, arises from this mechanism of minimization of the potential energy of interaction of byuons [27].
The energy of the rotational motion of particles on the boundary of an object having characteristic size on the order of 10 cm can be substantially enhanced by the coupling of such particles through the
quantum information channel predicted by the byuon theory [25,26].
3.2. Tornadoes and the Global Anisotropy of the Physical Space
Whatever the processed leading to the onset of a tornado, afterwards itcan further accumulate energy along its path by means of well understood processes[2,3]; two further concurrent processes are proposed here, which are thought to sustain or reinforce a tornado during its development.
The first process stems from the consideration, already expressed in Section 3.1., that the reduction of the summary potential AΣ by means of the Earth’s gravitational potential,
that is always negative, is stronger near the Earth’s surface than at any height along the local vertical axis; therefore, according to Eq. (1) the flow in an updraft is further accelerated at the expense of the gravitational potential in the direction of the increasing summary potential, which coincides with the direction to the local zenith.
Such process appears similar to the one described in [26,34]: during the motion of a liquid substancepowered by a centrifugal pump, in a closed circuit having ascending and descending sections (height of about 2.6 m), additional energy is released at the level of 15-20%, which can’t be explained from the perspective of standard calibrated physical models. Of course, the stronger the updraft, the greater the acceleration because the uprising particles experience a faster change (decrease) of the summary potential.
The latter applies as well to a tornado that can gain a fraction of energy of its rotational motion from the minimization of the potential energy of interacting byuons in regions with summary potential weakened by means of the Earth’s gravitational potential; provided that the cosmological vector potential lies around the horizontal plane tangent to the local Earth’s surface, this process results in the generation of further rotation around the vertical axis of any particle while rising in the violent updraft associated to the tornado, thus further contributing to the energy and lifetime of the tornado itself.
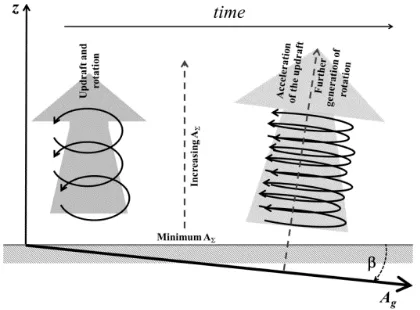
Fig.2 shows a very simplified scheme of the proposed processes contributing to the energy of a tornado system.
Fig. 2.Very simplified scheme of the proposed processes contributing to the energy of a tornado system: Ag is the cosmological vector potential and
β is its altitude with regards to the local Earth’s surface (shaded in the picture).
As a result, the new proposed mechanisms could help to discriminate situations favorable for the further accumulation of energy into a tornado and therefore its development into a high intensity and/or long lifetime or path system.
3.3. From Lightning to Tornado
In [26,29,35]experiments are discussed where, if the magnetic vector potential of a discharge current of intensity up to 4 kA is directed opposite to the vector Ag at an optimal angle (130°-135°), corresponding to the maximum action of the new force of nature, in the discharge can be released 20-40% more energy than that supplied by the power source; if the discharge currents are increased up to 200 kA, the situation can develop into an explosion, leading to the release of energy few orders of magnitude greater than the input energy.
On the basis of the above mentioned experiments as well as of the byuon theory, at least a fraction of the energy available for the onset of a tornado can be explained as the result of the vector of the lightning current, provided such current is high enough, which is collinear to the respective magnetic vector potential,lying on the reverse cone of action of the new force or at least having a component directed opposite the vector Ag in order to weaken the summary potential AΣ, such additional
energy coming from the process of formation of the masses of
the particles in the discharge (electrons, etc.).
Considering a single cubic centimeter of the substance within the lightning discharge with current 100 kA, the value of N will be equal to about 2⋅1020; ∆AΣ≈10−2Tm and for each of the elementary particles (protons, neutrons) the factor
( )
∆
A
∆
x
∆
Σ/
can be assumed equal to the value of themagnetic field in the vicinity of the proton (1012 T), as shown in Baurov et al.[22], therefore at the optimal arrangement of the vector potential of the discharge current with respect to the vector Ag (angle between the vectors ≈ 130°), it follows from Eq.(1) that a cubic centimeter of discharge will receive a new force having an intensity on the order of 10 N. Considering that the mass of 1 cm3 of air is about 10-6 kg, the obtained force will result in a huge acceleration on the order of 107 ms-2. It’s known [36] that a lightning strike can travel at speeds around 150,000 km/s, therefore, assuming that its path length is between 2km and 10 km, its duration can be estimated in the range 10-5s and 10-4s; furthermore, the average width of a lightning bolt is between 2.5 cm and 5 cm, such width of course increasing with the lightning peak current. It could be noted as well that 10 cm is the order of magnitude of the distance a particle accelerated by the new force travels during 10-4s.
On the basis of the above it appears reasonable to assume that the approximately empty cavity (i.e., with vacuum inside) created as a result of an intense lightning explosion has a characteristic size on the order of 10cm, therefore activating the quantum information channelmentioned in Section3.1., and allowing the previously accelerated particles at the boundaries of the cavity to gain substantial energy in the form of rotational motion, in turn contributing to trigger the tornado. Fig.3 shows a very simplified scheme of the proposed processes contributing to the onset of a tornado.
Fig. 3. Very simplified scheme of the proposed processes contributing to the onset of a tornado: Ag is the cosmological vector potential and β is its
altitude with regards to the local Earth’s surface (shaded in the picture); pluses and minuses indicate the cloud and surface electrostatic charges; the +CG lightning below the cloud base is represented too.
The verification of the above described additional mechanism contributing to the onset of tornadoes starting from intense lightning flashes on the basis of observational evidence with real tornadoes is very difficult for few reasons.
for the onset of tornadoes but only a contributing process that sometimes can trigger tornadoes in otherwise less favorable atmospheric environments. Therefore, the fact that the onset of a tornado either allows or not for a role of the proposed mechanism doesn’t speak about its reality.
Another source of difficulty lies in the fact that the tornadoes arise first at some elevation over the local terrain, i.e. inside the convective clouds, therefore the proposed mechanism can work both with cloud to ground (CG) and intra-cloud (IC) lightning flashes, the latter being hardly detected and characterized with regards to intensity, polarity, path by ground based lightning sensors. Additionally, the path is usually not available even for CG lightning.
Moreover, ground based lightning detection networks are mostly privately managed and the respective detailed data are confidential, including exact location, polarity and intensity, not to speak about the detailed path (if observed).
It is known[37] that positive lightning flashes (+CG), which are likely candidates for the activation of the proposed mechanism because they carry the highest peak currents, can follow very complex paths including long horizontal sections between convective and stratiform areas of the storm cloud system before delivering the positive charge to the ground. As a result, the only altitude of Ag can’t be sufficient to assess its angular deviation with
regards to the lightning discharge and the associated magnetic vector potential in the three dimensional domain, its azimuth being needed too.
At least an extensive analysis of the local atmospheric environment supportive of tornadoes would be needed for any event, which is out of the scope of this article, as well as the observation of the intensity, polarity and possibly the paths of both CG and IC lightning would be required, at least for the most intense strikes, which could be available by means of new and future satellite sensors [38].
4. Results and Discussion
Only the processes proposed in Section 3.2., linking the evolution of the strongest tornadoes to the global anisotropy of the physical space,will be verified against observed data; as stated in Section 3.3., the verification of the processes allegedly linking the onset of tornadoes to very high peak current lightning discharges are deferred to a later time until the suitable data sets will be available.
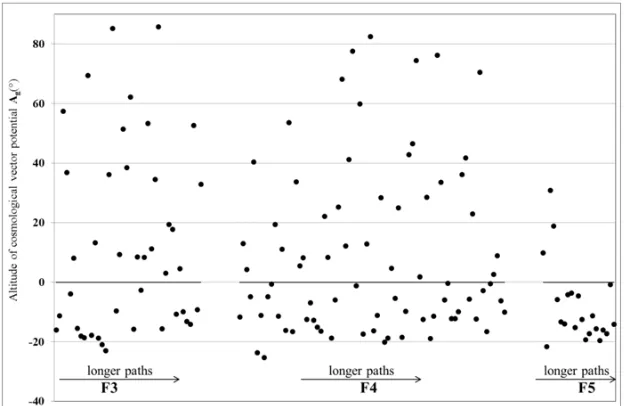
Fig. 4 shows the average altitude of the cosmological vector potential Ag during the lifetime of 139 tornadoes listed in Table 1. The data points are represented separately for each intensity class and, in each class, are arranged according to the increasing tornado path length.
Fig. 4.Altitude of the cosmological vector Ag during the lifetime of 139 tornadoes occurred in the period 1989-2013 and listed in Table 1; the data points
belonging to the three most intense tornado classes (F3, F4, F5) are represented separately and in each class they are arranged according to increasing path lengths.
While no clear pattern arises for F3 tornadoes, with the F4 tornadoes the altitude of Ag appears to concentrate in a range of 20° on each side from the horizontal plane, with the spread clearly reducing with the increasing tornado pathlength and negative altitudes clearly prevailing. A striking evidence arises anyway with the most violent F5 tornadoes: for all the 21 events the altitude of Ag is less than 30° far from the horizontal plane, such angular distance reducing to less than 20° with 18 out of 21 events, all such events occurring with a negative altitude.
Therefore, also recalling the relevance of the path length
besides the intensity to characterize the tornado overall energy, as stated in Section 1 [7], it appears that the local altitude of the cosmological vector potential effectively discriminatesthe most powerful tornadoes.
A closer insight is provided with Fig.5(a) and Fig. 5(b), where the path lengths of the same tornado events represented in Fig. 4, limited to the classes F4 and F5,are shown against the altitude of the cosmological vector potential Ag.
plane (Fig. 5a), and for six out of seven such events the maximum angular distance from horizontal reduces to 10°.
For all the fifteen out of twenty-one F5 events with path
length greater than 26 km the altitude of Ag lies in the range -20° to 0° from the horizontal plane (Fig. 5b).
(a)
(b)
Fig. 5.Path lengths of tornadoes of intensity F4 (a) and F5 (b), occurred in the period 1989-2013, against the local altitude of the cosmological vector Ag.
The abovediscussed results support at least the general idea that the most energetic tornadoesare somehow connected with the global anisotropy of the physical space, which is an original conclusion of this article; here, the total energy of a tornado is meant as a combination of its maximum intensity in the Fujita scale and the length of its path. In the opinion of the authors, consistent clues are accumulating as well about the reality of the proposed mechanism contributing to the intensification of tornadoes.
In order to reduce the probability that the above evidence was obtained by chance, eleventornado outbreaks occurred in the period 1990-2011 and listed in Table 2 have been analyzed. In Fig. 6(a-v) two charts are shown for each considered outbreak, the first representing the intensity
class of each tornado in the outbreak and the altitude of the cosmological vector potential Ag at its touchdown along with the local solar time, the second representing the scatter diagram of the tornado intensity as well as of its path length against the altitude of Ag. It’s noteworthy that here the altitude of Ag at the tornado touchdown is computed instead of its average during the tornado lifetime as in Fig. 4, Fig. 5(a) and Fig. 5(b) because the lifetime was not always available for each tornado; this could introduce small errors especially with the longest lifetime events but the occurrence of such events just close to the minimum altitude prevents such errors to become significant.
(a)
(b)
(d)
(e)
(g)
(h)
(j)
(k)
(m)
(n)
(p)
(q)
(s)
(t)
Fig. 6(a-v). Representation of the intensity class of each tornado in any outbreak along with the touchdown at the respective local solar time (a,c,e
altitude of Ag (b,d,f,h,j,l,n,p,r,t).
A striking evidence arises from the represented in Fig. 6(a-v): despite the fact that the
the cosmological vector potential Ag performs a daily cycle modulated by the different geographical coordinates of the single tornado events, covering practically any value in the range about -30° to 90°,all events with tornado intensity in the classes F4 and F5 with path length greater than 30 occur when the altitude of Ag is in the range
regards to the local horizontal plane, with the only exception of the outbreak hitting on May 4, 2003 (Fig.
tornado associated with a path length as long as 63 occurred when the altitude of Ag was anyway
20°.
In the opinion of the authors, the combined evidences resulting from the analysis of Fig. 5(a),
more significant, Fig. 6(a-v), strongly support the hypothesized link between the occurrence of the most energetic tornadoes and the global anisotropy of the physical space, in turn adding confidence to the proposed model of intensification of this extremely
phenomenon of the Earth’s atmosphere.
5. Conclusions
The main aim of this article was to investigate the possible relationship between the global anisotropy of the physical space and the occurrence of the most violent tornadoes.
The global anisotropy of the physical space wa
by means of a long series of experiments as well as observations of different natural systems at virtually any scale of the Universe, from the weak interaction
galactic ones; on its basis the byuon theory
was built since the early 1990s’till a stage of development that allows to offer consistent explanations to a variety of physical phenomena covering the fields of nuclear physics,
(v)
Representation of the intensity class of each tornado in any outbreak along with the altitude of the cosmological vector potential (a,c,e,g,i,k,m,o,q,s) and of the tornado intensity class along with the respective
A striking evidence arises from the tornado outbreaks : despite the fact that the altitude of performs a daily cycle, modulated by the different geographical coordinates of the single tornado events, covering practically any value in the all events with tornado intensity in F5 with path length greater than 30 km is in the range -20° to 10° with with the only exception 4, 2003 (Fig. 6p) when an F4 iated with a path length as long as 63 km anyway just less than
In the opinion of the authors, the combined evidences Fig. 5(b) and, likely strongly support the hypothesized link between the occurrence of the most energetic tornadoes and the global anisotropy of the confidence to the proposed extremely powerful arth’s atmosphere.
main aim of this article was to investigate the possible relationship between the global anisotropy of the physical
occurrence of the most violent tornadoes. The global anisotropy of the physical space was detected
series of experiments as well as observations of different natural systems at virtually any weak interaction to the meta-galactic ones; on its basis the byuon theory (Section 3.1.)
till a stage of development that allows to offer consistent explanations to a variety of physical phenomena covering the fields of nuclear physics,
astrophysics, geophysics, as well as harness a new energy source[25,26,32]
So far, no weather phenomena were investigated on the basis of the byuon theory and this article aims to covering the gap with the tornadoes which are likely the most powerful phenomena at scales from hundreds of meters to tenths of km in the Earth’s atmosphere.
Although one can dispute the details of the
processes contributing to supply energy to developing tornadoes (Section 3.2.), the
Section 4. for the link between the global anisotropy of the physical space and the occurrence of the most energetic tornadoes appears much more difficult to discard or to attribute to chance.
Despite the intrinsic huge complexity and chaotic nature of the atmosphere at any scale
shown in this articleit is possible to state
powerful tornadoes belonging to the F4 and F5 intensity classes as well as provided with path lengths greater than some thresholds specific to the intensity class
when the tangent to the local Earth’s surface assumes defined directionsin the Universe.
In other words, such tornadoes can occur only at specific times of the day which depend on latitude, longitude and day of the year as well as to the
affecting significantly only on the millennial scale. All the above deriving from an univ
i.e. the cosmological vector potential
are predicted to be valid even in extraterrestrial atmospheres, provided that the gravitational potential
will represent another important variab
Further verification can be performed increasing the database of tornadoes both in the herein considered U.S.A. territory and outside, e.g. in Europe, South America and other regions of the world.
altitude of the cosmological vector potential Ag at its
along with the respective path length against the
astrophysics, geophysics, as well as offers the chance to [25,26,32].
weather phenomena were investigated on the is of the byuon theory and this article aims to start the tornadoes which are likely the most powerful phenomena at scales from hundreds of meters to tenths of km in the Earth’s atmosphere.
Although one can dispute the details of the proposed processes contributing to supply energy to developing the wide evidence provided in link between the global anisotropy of the physical space and the occurrence of the most energetic ch more difficult to discard or to
the intrinsic huge complexity and chaotic nature of the atmosphere at any scale,on the basis of the analysis it is possible to statethat the most ing to the F4 and F5 intensity classes as well as provided with path lengths greater than specific to the intensity class occur only local Earth’s surface assumes sharply in the Universe.
such tornadoes can occur only at specific times of the day which depend on latitude, longitude and day of the year as well as to the historical time, the latter affecting significantly only on the millennial scale.
All the above deriving from an universal physical constant, i.e. the cosmological vector potential Ag, similar conclusions are predicted to be valid even in extraterrestrial atmospheres, gravitational potential specific to any planet will represent another important variable in the picture.
inSchielicke and Névir[7], the tornado path width could be added to the relevant data to obtain a more accurate characterization of its overall energy and some summary
energy index.
About the proposed processes allegedly contributing to the onset of tornadoes from very high peak current lightning discharges (Section 3.3.), the data presently available to the authors don’t allow any useful verification; nevertheless, such processes are presented because they derive from the same fundamental physical theory which made possible the above discussed finding.On the other side, the need to verify this second class of processes can stimulate the optimization or the planning of both ground-based observation networks and dedicated satellite missions aimed at the detection and full characterization of the lightning dischargesin terms of nature (+CG, -CG, IC), location, peak current and detailed path.
Finally, if the processes contributing to the onset of tornadoes will be aswell verified, some inference could be drawn about the tornado hazard in the changing climate, in example in Mediterranean regions where +CG flashes were found to carry the largest peak currents in the winter months[12].
Acknowledgments
The authors gratefully acknowledge A. Crisci for valuable discussions at the early stage of their research,M. Pagliaro for the outstanding support and motivation by means of the SuNEC 2013 Conference, F. Zabini for assistance in the communication style of the manuscript.
Appendix
Abbreviations used in this article: AΣ = Summary vector potential (T⋅m)
Ag = Cosmological vector potential (T⋅m) CDT = Central Daylight Time
CG = Cloud-to-Ground lightning
-CG = Negative Cloud-to-Ground lightning +CG = Positive Cloud-to-Ground lightning CST = Central Standard Time
EST = Eastern Standard Time IC = Intra-Cloud lightning TD = Touchdown
TNT = Trinitrotoluene
References
[1] S.A. Arsen’yev, "Mathematical modeling of tornadoes and squall storms", Geosci Front vol. 2, pp. 215–221, 2011. [2] S.A. Arsen’yev, N.K. Shelkovnikov, "Electromagnetic fields
in tornados and spouts" Moscow Univ Phys Bull, vol. 67:pp. 290–295, 2012.
[3] A.Y. Gubar, A.I. Avetisyan, V.V. Babkova, "Tornado rise: 3D numerical model in the mesoscale turbulence theory of Nikolaevskiy", Dokl Earth Sci, vol. 419, pp. 467–472, 2008
[4] N. Kufa, R. Snow, "Lightning: meteorology’s new tool. 86th AMS Annu. Meet. (Atlanta, GA)". Second Conf. Meteorol. Appl. Light. Data, American Meteorological Society; 2006. [5] A.J. Litta, U.C. Mohanty, S. Kiran Prasad, M. Mohapatra, A.
Tyagi, S.C. Sahu, "Simulation of tornado over Orissa (India) on March 31, 2009, using WRF–NMM model. Nat Hazards", vol. 61, pp. 1219–1242, 2011
[6] A.E. Mercer, C.M. Shafer, C.A. Doswell, L.M. Leslie, M.B. Richman, "Objective Classification of Tornadic and Nontornadic Severe Weather Outbreaks". Mon Weather Rev, vol. 137, pp. 4355–4368, 2009
[7] L. Schielicke, P. Névir, "Comprehensive analysis of tornado statistics in comparison to earthquakes: intensity and temporal behaviour", Nonlinear Process Geophys, vol. 20, pp. 47–57, 2013
[8] V.I. Ermakov, Y.I. Stozhkov, "Thunderstorm Cloud Physics". Moscow (in Russian). Available at:
Http://ellphi.lebedev.ru/wp-content/uploads/2011/12/2004_2.pdf: 2004.
[9] A. Nag, V.A. Rakov, "Positive lightning: An overview, new observations, and inferences", J Geophys Res, 117:D08109, 2012.
[10] C.G. Price, "Lightning Applications in Weather and Climate Research". Surv Geophys, vol. 34, pp. 755–767, 2013. [11] W. Lyons, T. Nelson, E. Williams, J. Cramer, T. Turner,
"Enhanced positive cloud-to-ground lightning in thunderstorms ingesting smoke from fires". Science, vol. 282, pp. 77–80, 1998.
[12] T.G. Chronis, "Preliminary lightning observations over Greece", J Geophys Res 117:D03113, 2012.
[13] T.C. Marshall, M. Stolzenburg, "Voltages inside and just above thunderstorms", J Geophys Res, vol. 106, pp. 4757– 4768, 2001.
[14] C. R. Maggio, T.C. Marshall, M. Stolzenburg, "Estimations of charge transferred and energy released by lightning flashes", J Geophys Res, 114:D14203, 2009.
[15] A.H. Perez, L.J. Wicker, R.E. Orville, "Characteristics of Cloud-to-Ground Lightning Associated with Violent Tornadoes". Weather Forecast, vol. 12, pp. 428–437, 1997. [16] A. Seimon, "Anomalous Cloud-to-Ground Lightning in an
F5-Tornado-Producing Supercell Thunderstorm on 28 August 1990", Bull Am Meteorol Soc, vol. 74, pp. 189–203, 1993.
[17] L.D. Carey, W.A. Petersen, S.A. Rutledge, "Evolution of Cloud-to-Ground Lightning and Storm Structure in the Spencer, South Dakota, Tornadic Supercell of 30 May 1998", Mon Weather Rev, vol. 131, pp. 1811–1831, 2003.
[18] Storm Prediction Center WCM Page, http://www.spc.noaa.gov/wcm/#data(last accessed: November 16, 2013.
[19] Tornado history project,
http://www.tornadohistoryproject.com/(last accessed: November16, 2013).
[21] Yu.A. Baurov, "Space magnetic anisotropy and a new interaction in nature", Phys Lett A, vol. 181, pp. 283–288, 1993
[22] Yu. A. Baurov, A.A. Konradov, V.F. Kushniruk, E.A. Kuznetsov, Yu.G. Sobolev , Yu. V. Ryabov, et al. "Experimental investigations of changes in beta-decay rate of 60Co and 137Cs", Mod. Phys. Lett. A, vol. 16, pp. 2089– 2101, 2001
[23] I.F. Malov, Yu.A. Baurov, "The distribution of space velocities of radio pulsars", Astron Reports, vol. 51, pp. 830–835, 2007.
[24] Yu.A. Baurov, "The Anisotropy of Cosmic Rays and the Global Anisotropy of Physical Space", J. Mod. Phys., vol. 3, pp. 1744–1748, 2012.
[25] Yu.A. Baurov, On the structure of physical vacuum and a new interaction in Nature (Theory, Experiment and Applications). NY: Nova Science; 2000.
[26] Yu.A. Baurov, Global Anisotropy of Physical Space, Experimental and Theoretical Basis. NY: Nova Science; 2004.
[27] Yu.A. Baurov, I.F. Malov, "On the Nature of Dark Matter and Dark Energy", J. Mod. Phys., vol. 1, pp. 17–32, 2010. [28] Yu.A. Baurov, I.F. Malov, "Variations of Decay Rates of
Radio-active Elements and their Connections with Global Anisotropy of Physical Space", Int. J. Pure Appl. Phys., vol. 6,pp. 469–482, 2010; Also at: http://arxiv.org/abs/1001.5383. [29] Yu.A. Baurov, I.B. Timofeev, V.A. Chernikov, S.F. Chalkin,
A.A. Konradov, "Experimental investigations of the distribution of pulsed-plasma-generator radiation at its various spatial orientation and global anisotropy of space", Phys. Lett. A, vol. 311,pp. 512–523, 2003.
[30] Yu.A. Baurov, Yu.G. Sobolev, Yu.V. Ryabov, V.F. Kushniruk, "Experimental investigations of changes in the rate of beta decay of radioactive elements", Phys. At Nucl., vol. 70, pp. 1825–1835, 2007.
[31] P.A. Sturrock, J.B. Buncher, E. Fischbach, II. D. Javorsek, J.H. Jenkins, J.J. Mattes, "Concerning the Phases of the Annual Variations of Nuclear Decay Rates", Astrophys J., vol. 737, p. 65, 2011.
[32] Yu.A. Baurov, "Research of global anisotropy of physical space based on investigation of changes in β and α-decay rate of radioactive elements, motion of pulsars and anisotropy of cosmic rays", Am. J. Mod. Phys., vol. 2, pp. 177–184, 2013.
[33] Yu.A. Baurov, A.A. Spitalnaya, A.A. Abramayan, V.A. Solodovnikov, "Seismic activity of the earth, the cosmological vectorial potential and method of a short-term earthquakes forecasting", Nat. Sci., vol. 3,pp. 109–119, 2011. [34] Yu.A. Baurov, F. Meneguzzo, A.Yu. Baurov, A.Yu.
Baurov(j) , "Plasma Vacuum Bubbles and a New Force of Nature , The Experiments", Int. J. Pure Appl. Sci. Technol., vol. 11,pp. 34–44, 2012.
[35] Yu. A. Baurov, A.G. Znak, V.G. Farafonov, "Experimental Investigation of Heat Content in the Jet of Magnetoplasmadynamic Accelerator in Accordance with its Spatial Orientation", Adv. Plasma Phys. Res., New York: Nova Science Publishers Inc; pp. vol. 5, pp. 179–96, 2007. [36] T.A. Deecke, J.V. Hyde, J.M. Hylko, "Packaging waste and
hitting home runs: how education and lightning strike detection technology supports company and community activities", WM’06 Conf. Febr. 26-March 2, 2006, Tucson,
AZ. Available
http//www.wmsym.org/archives/2006/pdfs/6070.pdf, Tucson, AZ: 2006, p. 23.
[37] L.D. Carey, "Lightning location relative to storm structure in a leading-line, trailing-stratiform mesoscale convective system", J. Geophys Res.,110:D03105.,2005.