215
Estimate Of Reference Effective Dose And Renal
Dose During Abdominal CT Scan For Dose
Optimization Procedures In Ghana
Issahaku Shirazu, Y. B Mensah, Cyril Schandorf, S. Y. Mensah
ABSTRACT: The study is to estimate renal and effective dose during abdominal MDCT scan, using image data for dose optimization for purposes of radiation protection in Ghana. In addition dose influencing parameters including: CTDIVOL, DLP and MSAD were recorded and compared with ICRP/ICRU, AAPM, EU and IAEA dose optimization recommendations. All the measurements were done during abdominal MDCT examination. The measured parameters were part of image data on the MeVisLab (DICOM) application software platform. The total photon fluence (mAs per area) and the photon energy fluence (kVp per area) on the abdominal and renal surface was also determined. Renal and effective dose were estimated using ICRP publication 103 recommendations. The results of the measured parameters based on the average renal surface area of 29.52cm2 and 30.67cm2 for the right and left kidney respectively, shows that: The mean dose parameters were; 6.33mGy, 7.78mGy, 936.25mGy cm, 5.76mGy, 10.99mSv and 14.09mSv for CTDIV, CTDIW, DLP, MSAD, RD and E respectively. The average values were lower than the general recommended average critical values, but this seems misleading, based on the fact that 37% of the individual dose and exposure parameters exceeded the recommended critical values. A tradeoff between patient radiation dose and image quality in abdominal CT has been established. Where at a mean SNR of 6.6 decibels an adequate images were produce to answer all the clinical questions, with an average effective dose of 14.09mSv and renal dose of 10.99mSv. Radiation dose during x-ray CT imaging is an important patient safety concern. Reducing radiation dose result in a reduction of the risk to patient; however, reducing dose also reduces the signal strength and thereby reduces the signal to noise ratio in the resulting CT image, hence, the image quality is affected. It is recommended that the established reference values be use as clinical advisory mechanism to protect patience and clinicians. It is also recommended that the studies should be carry out periodical to estimates the abdominal effective dose in all the centers.
Keywords: Abdominal CT scan, effective dose, renal dose, CTDI, DLP, SNR
————————————————————
OBJECTIVES
Estimate reference effective and renal dose parameters leading to patients’ dose optimization procedures without loss of acceptable image quality during abdominal CT scan in Ghana. Reviewed and compare the established effective
and renal dose estimates with international recommendations and reference values and make appropriate recommendations.
1.0 INTRODUCTION
Over the past 20 years the world has seen the emergence of several medical imaging modalities like, Fluoroscopy, CT, SPECT and PET [3, 4]. In addition, to enable the assessment of morphological, physiological and functional information together, advance hybrid systems have also been developed, these include SPECT-CT, PET-CT and PET-MRI [5, 6].
This development has made medical image acquisition, analysis and interpretation much easier and faster [1]. Unfortunately however, all of these imaging modalities are major sources of ionizing radiation exposure with direct and indirect prognostic consequences [5, 6, 7]. These are used mainly for diagnostic and therapeutic clinical application. Even though, medical imaging plays a crucial role in cancer control and management. Without medical imaging diagnostic tools such as CT, and wherever affordable in combination with PET (PET-CT) or SPECT (SPECT-CT), the implementation of cancer control programs will not meet the standard of practice of clinical Oncology. This is essential for successful treatment of patients’ which are based on CT images for treatment planning. Indeed, CT is an imaging modality that is part of many current projects in radiotherapy and nuclear medicine, which make use of various reference organ model for treatment planning [8]. Therefore, there is the need to design a local based organ models and CT dose reference levels in order to address clinical and radiation protection issues caused by the increasing use of CT in Ghana. Even though the beneficiary of these increase use of CT are mainly the patients, there is the need to establish a tradeoff between these benefits and the high potential biological effects due to exposure to ionizing radiation with high prognostic challenges [9, 10 and 11]. Furthermore, it should be noted that, dose estimates are used for risk assessment and not the exact determination of radiation dose during image study. The dose levels are mainly used by the institutions and the radiation regulatory authority, whose main objective is to plan, regulate and formulate laws to safeguard the peaceful use of radiation
________________________
Issahaku Shirazu, Y. B Mensah, Cyril Schandorf, S. Y. Mensah
Medical Radiation Physics Centre: Radiological & Medical
Sciences Research Institute Ghana Atomic Energy Commission
Ghana Contacts: +233 (208) 152864
Graduate school of Nuclear and Allied Sciences University of
Ghana, Legon, Ghana Ghana. Contact+233 (208) 147517
National Centre for Radiotherapy and Nuclear Medicine
Department of Nuclear Medicine Korle-Bu Teaching Hospital, Accra Ghana. Contact: +233 (302) 676222
University of Ghana Medical School Department of Radiology
Korle-Bu Teaching Hospital, Accra Ghana. Contact: +233 (02) 6301310
University of Cape Coast School of Agriculture and Physical
Sciences Faculty of Physical Sciences Department of Physics
2.0 LITERATURE REVIEW
2.1 EXPOSURE AND DOSE PARAMETERS
It is important to note that photons are energetic enough to overcome the binding energy of an orbiting electrons in an atoms. This energetic photon can knock off electron from its orbital shell, thereby creating ions [12]. In human body the result of this knock off when exposure to photons, results in the creation of hydroxyl radicals in the body. These are due to the x-ray interactions with the human body cells which consist of approximately 70% water molecules. The nearby DNA will cause a base damage or strand breaks and the hydroxyl may even ionize DNA directly [13, 14]. It should be noted that, various systems within the cell may rapidly repair most of these radiation-induced damage, this however is based on a number of factors. However, it is less easy to repaired double-strand breaks, which may lead to induction of cancer [14]. These biological exposure to photon energy give rise to the determination of various fundamental dosimetric quantity in radiological imaging. The fundamental dosimetric quantity in radiological protection is the absorbed dose, D. At low dose levels, the mean absorbed doses in organs or tissues in the human body are taken to be indicators of the probability of subsequent stochastic effects; at high dose levels, absorbed doses to the more heavily irradiated sites within the body are taken to be indicators of the severity of deterministic effects [13]. In medical imaging where low-dose radiation exposure is use, the risk-related quantities can be obtained from the practical dosimetric quantities such as CTDIVOL, CTDIW and DLP, using the
dose-conversion coefficients in Table 2.1. In addition, effective dose are general estimated for referencing and provide advice to clinicians.
2.2 ORGAN AND TISSUE DOSE
Recommendation by ICRP provide appropriate dosimetric indicator for the probability of stochastic radiation effects by using the average absorbed dose in a tissue or organ [15, 16]. Absorbed dose is defined as the mean of the stochastic distribution of energy deposited in a volume element (Voxel). The mean absorbed dose in a specified organ or tissue is further simply referred to as organ dose [17]. In this study the, renal dose was estimated using ICRP publication 103 recommendation, define as:
2.1
Where in the case of the kidney P is 0.0086 and T is the kidney
Dkidney = 0.0086CTDIW. 2.3
Where 0.0086 is the normalized renal dose factor from ICRP publication 103 and CTDIW, weighted computed
Tomography Index. The standard SI unit for organ dose us the mSv. CTDIvol represents the average absorbed radiation dose over the x, y, and z directions. It is conceptually similar to the MSAD. The CTDIvol provides a single CT dose parameter, based on a directly and easily measured quantity, which represents the average dose within the scan volume for a standardized (CTDI) [17]. The CTDIvol provides a single CT dose parameter, based on a directly and easily measured quantity, which represents the average dose within the scan volume for a standardized (CTDI) [64]. The relationship between CTDIVOL and CTDIW is given as:
2.4
Where P is the pitch factor.
2.3 FFECTIVE DOSE
Effective dose, E, is a dose descriptor that reflects this difference in biological sensitivity. It is a single dose parameter that reflects the risk of a non-uniform exposure in terms of an equivalent whole-body exposure [13]. The effective dose is defined as the sum of the weighted equivalent doses in all the tissues and organs of the body. A broad estimates of effective dose (E) may be derived from values of DLP for an examination using appropriately normalized coefficients (Table 2.1) designed by European commission [20]. The effective dose is define as the product of the region-specific normalizing constant (EDLP)
and the dose length product (DLP).
Define mathematically as:
ED = EDLP × DLP
This definition by ICRP was used in this study to estimate the effective dose with known DLP and EDLP [22]. In the
case of the abdomen EDLP is 0.0153, hence the equation
become:
217
Table 2.1 Region specific normalized effective doses for CT scan [23]
European Commission and ICRP has proposed reference dose values for some CT examination [70]. These values depend on the body region examined (Table 2.3). The following are comparisons of effective radiation dose (Table 2.4) in adults with background radiation exposure for various CT region [16, 22].
Table 2.2: Typical effective dose in various European countries
3.1 MATERIALS
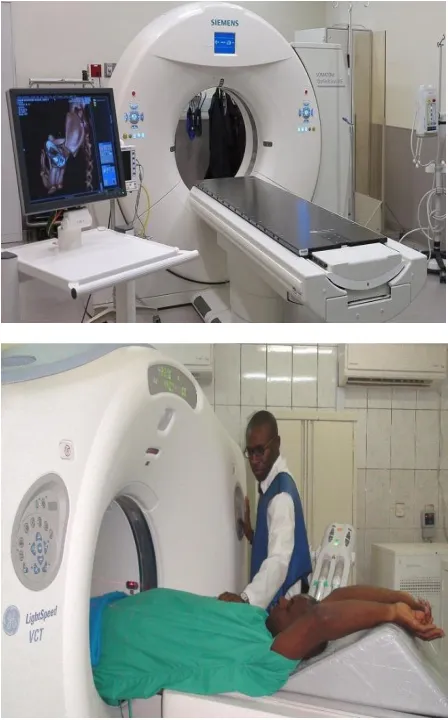
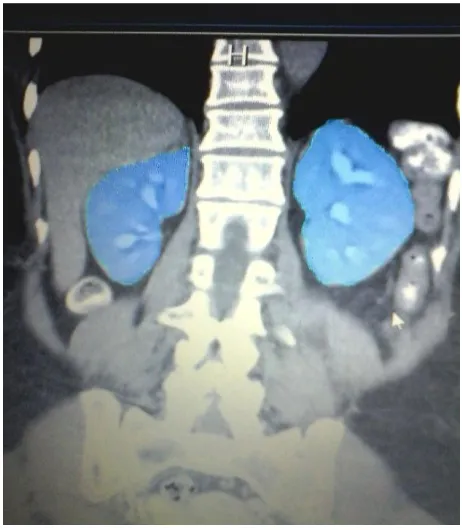
The material used include the following equipment and tools: three dimensional (3D) MDCT Machine (Figure 3.4), with diffent models and number of slices varied between 16 slice to 640 slice. The images (Figure 3.5 ) that met the selection criteria were copied onto DVD and transfer onto the the MVL aplication workstation (Figure 3.6). The MVL user interface (Figure 3.7) enable it to be implemented in any advance computer system (Figure 3.8).
Figure 3.2: Clinical MDCT images
3.2 METHODOLOGY
DETERMINATION OF RENAL AND EFFECTIVE DOSE On the console there are selectable parameters such as mAs, kVp, tube current and acquisition time before image acquisition. The selection of these parameters depends on several factors, this include; patients weight, size, gender, body region and type of procedure. This enable a trade-off between a balance of image quality produce and the dose received for purposes of patient radiation protection. Furthermore, the automatic control unit automatically adjust these parameters based on the attenuation of the patients’ body tissues and record these values on the image data. For purposes of radiation protection these data was extracted from the image data using the MVL application software. The displayed of these recorded parameters are shown in Figure 3.3. MVL DICOM application software standard supplement was issued in 2007 for the reporting of dose parameters in CT [97]. This became mandatory for all manufacturers of CT equipment. It requires a report summary to be given for the whole patient examination and the accumulated dose applied.
Figure 3.3: Acquisition parameters
The patient information, the patient study information and the general equipment information is stored within the general part of the structured report. This development enable the obvious difficulties in measuring the distribution of absorbed dose within the body during CT imaging to be overcome. A more practical dosimetric quantities captured as part of image data were used to readily estimate these parameters from closely related measurements. The risk-related quantities were obtained from the practical dosimetric quantities such as CTDIVOL and DLP, using the
dose-conversion coefficients in Section 2.3, Table 2.1. On the image data, using MVL platform detail information on the CTDIvol and DLP were available for recording as shown
219 Where 0.0153 is the estimated abdominal conversion factor
from ICRP publication 103 as stated in literature. This is because the effective dose is not measured but it is theoretical calculated dose based on the organs exposed by the applied radiation multiplied by tissue-weighting factors. Because the tissue-weighting factors can change with new data and continuing analysis of existing data, the effective dose conversion factor estimates can change over time. In addition using organ dose estimates and ICRP 103 recommendations. This was estimated by using a converting factor known as weighted CTDI air kerma at the axis of rotation CTDI. Once the CTDIW is known, it is
straightforward to multiply it by the mAs value and the relevant conversion coefficients (0.0086 for kidney) to obtain the renal organ doses from all the examination. For partial-body irradiation, effective dose is the weighted summation of the absorbed dose to each specified organ and tissue multiplied by the ICRP-defined tissue-weighting factor for that same organ or tissue [99]. Furthermore, the conversion factor for renal tissues as recommended by ICRP publication 103 was 0.0086 at 1 mAs. Hence, the renal organ dose was calculated using ICRP publication 103 as:
Dkidney = 0.0086CTDIW * mAs 3.2
Where 0.0086 is the renal tissue conversion factor from ICRP publication 103, CTDIW is the weighted Computed
Tomography dose Index and mAs is the effective Milliameter per second with a value of 48.19 mAs. In addition, with the above definitions organ and effective dose were estimated and a comprehensive standard reference organ dose (organ absorbed dose per unit Computed Tomography Air Kerma Index) was established. The mathematics model was developed to estimate organ doses with tube current modulation techniques and age and gender specific dose estimates. A graphical user interface was designed to obtain user input of patient- and scan-specific parameters, and to calculate and display organ doses.
4.0 RESULTS AND DISCUSSION
The basic framework of this chapter describe the pictorial view of the relationship between the various parameters in tables and graphical representation. Presentation of the summarized data and the analysis are shown below.
4.2 GRAPHICAL REPRESENTATION
Figure 4.1 Comparative male radiation effective dose and renal dose
Figure 4.2 Comparative female radiation effective Dose and renal dose
0 10 20 30 40 50 60
1 7 13 19 25 31 37 43 49 55 61 67 73 79 85 91
AG
E VARIAT
ION
FREQUENCY
MALE VARIATION OF
EFFECTIVE AND RENAL DOSE
E mSv RD mSv
0 10 20 30 40 50 60
1 9 17 25 33 41 49 57 65 73 81 89 97
105
AG
E VARIAT
ION
FREQUENCY
FEMALE VARIATION OF
EFFECTIVE AND RENAL DOSE
Figure 4.3 CTDIVOL variation of Age and Gender
Figure 4.4 DLP variation of Age and Gender
Figure 4.6 Renal dose variation of Age and Gender
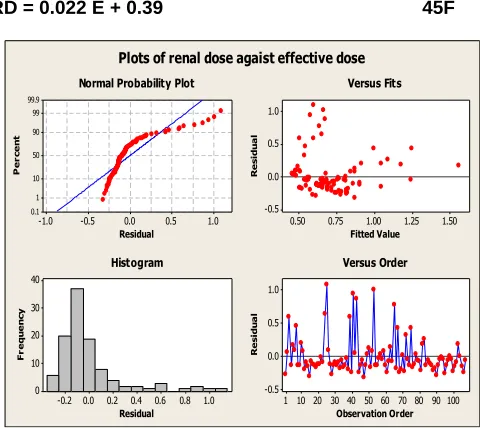
4.3 REGRESSION ANALYSIS RELATIONSHIP
BETWEEN RD AND E DOSE
Model Equation
RD = 0.022 E + 0.39 45F
1.0 0.5 0.0 -0.5 -1.0 99.9 99 90 50 10 1 0.1 Residual P e r c e n t 1.50 1.25 1.00 0.75 0.50 1.0 0.5 0.0 -0.5 Fitted Value R e s id u a l 1.0 0.8 0.6 0.4 0.2 0.0 -0.2 40 30 20 10 0 Residual F r e q u e n c y 100 90 80 70 60 50 40 30 20 10 1 1.0 0.5 0.0 -0.5 Observation Order R e s id u a l
Normal Probability Plot Versus Fits
Histogram Versus Order
Plots of renal dose agaist effective dose
Figure 4.7 Effective and Renal Dose variations for age and gender 5 5.5 6 6.5 7
1 2 3 4
RE
QUE
N
CY
AGE AND GENDER VARIATION
AGE AND GENDER VARIATION
FOR CTDI
MCTDIVOL FCTDIVOL 850 900 950 100020-40 41-60 61-80 MEAN
FRE
QUE
N
CY
AGE AND GENDER VARIATION
AGE AND CENDER VARIATION
FOR DLP
DLPM DLPF
15
Y
AGE AND GENDER VARIATION
FOR E
0 0.02 0.04 0.06 0.0820-40 41-60 61-80 mean
FRE
QUE
N
CY
AGE AND GENDER VARIATION
AGE AND GENDER VARIATION
FOR RD
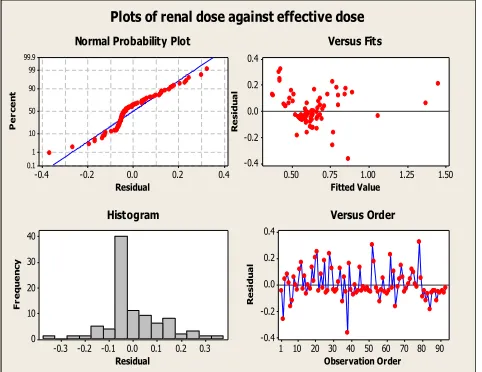
221 0.4 0.2 0.0 -0.2 -0.4 99.9 99 90 50 10 1 0.1 Residual P e rc e n t 1.50 1.25 1.00 0.75 0.50 0.4 0.2 0.0 -0.2 -0.4 Fitted Value R e si d u a l 0.3 0.2 0.1 0.0 -0.1 -0.2 -0.3 40 30 20 10 0 Residual F re q u e n cy 90 80 70 60 50 40 30 20 10 1 0.4 0.2 0.0 -0.2 -0.4 Observation Order R e si d u a l
Normal Probability Plot Versus Fits
Histogram Versus Order
Plots of renal dose against effective dose
Figure 4.8 Effective and Renal Dose variations for age and gender
4.4 ANALYSIS
4.4.1 ABDOMINAL AND RENAL DOSE PARAMETERS The estimated pre-set parameters during the abdominal scan were kV and mAs to enable the prediction of prognostic consequences of these parameters. In all the examinations, the average protocol setting in terms of exposure time and kilovolts peak were 500s and 120kVp respectively. These parameters play an important role in the determination of the level of exposure in term of particle and energy fluence in the abdominal CT examinations to the kidney and other abdominal tissues. The influence of these parameters in abdominal scan depends on the scan time, scan scope, the size of the renal surface area (RSA) which has varied values as shown in Table 4.12. The summarized data shows an average renal surface area of 29.5199 cm2 and 30.6662 cm2 on the right and left kidney respectively, with mean milliamp second (mAs) of 48.19 mAs and tube current of 94.22A. The minimum recorded milliamp second (mAs) in all the abdominal examination was 25mAs and the maximum recorded value was 126mAs. Furthermore, the minimum and the maximum tube current in all the examinations were 50A and 253A respectively. The various variations are shown in Table 4.12. These parameters were used to estimate the effect on abdominal and kidney tissues. In terms of the level of exposure based on recommended exposure limits by ICRP and other institution. A number of exposure parameters determine the dose to patients when performing multidetector CT examination (low-dose radiation exposure). Based on the LNT model supported by BIER committee, there is a link between low-dose radiation exposure and tissue damage leading to stochastic effect. However, in MDCT examination CTDIVOL and
DLP are common measurable parameters in relation to patient’s dose. Generally, these parameters are used to estimate renal and effective dose in clinical environment. This enable a comparism between these parameters and the recommended dose limits by ICRP. The detailed measured CTDI, DLP, MSAD, renal and effective dose in relation to age and gender variation are summarized in Table 4.15. The analysis of the abdominal image data at the v a r i o u s CT centers in the study s h o w t h a t the mean male and female CTDIVOL values were
6.17mGy and 6.48mGy respectively. The detailed average values of the CTDIVOL are shown in Table 4.15.
Furthermore, the me a n r e c o r d e d value of CTDIVOL was well within proposed ICRP r e c o m m e n d a t i o n when the protocol was completed in one scan. On the other hand, in t h e case of multiscan the total CTDIVol was higher than t h e I C R P recommendations. The corresponding estimated weighted CTDI (CTDIW) mean and varied values
were shown in Table 4.15.
Figure 4.9. DLP of the abdomen examination.
TABLE 4.2 SUMMARY OF ED, RD AND OTHER RELATED DOSE PARAMETERS
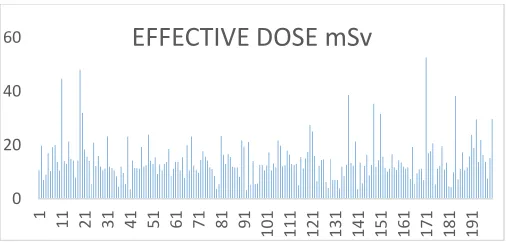
Several interesting observations were made on the basis of the data provided in the Appendix 7. The calculated effective dose from the DLP using conversion factor of ICRP publication 103 which shows a variation from a minimum of 3.2 mSv to a maximum of 38.53 mSv with a mean value of 14.35 mSv for female. The corresponding male mean effective dose was 13.83mSv and the distribution was in the range of 3.52 mSv to 52.45mSv for minimum and maximum values respectively. The renal dose was also estimated using the ICRP publication 103 as in the case of the effective dose. The measured male mean renal dose was 10.36mSv with 27.24mSv and 5.55mSv as maximum and minimum recorded values respectively. The corresponding measured female mean renal dose was 11.58mSv with 28.29mSv and 5.21mSv as maximum and minimum renal dose values respectively. The over average values of renal and the effective dose values were 10.99 and 14.09 which exceeded the accepted values of the ICRP and the EC recommendations of 12mSv and 14.0mSv respectively. However, approximately 34% of the individual data were higher than the recommended effective dose and renal dose as shown by the black line in figure 24.
Figure 4.40: Recommended Renal Dose level
It is important to note that ionizing radiation, such as x-rays, is uniquely energetic enough to overcome the binding energy of the electrons orbiting an atoms and molecules. This energetic photon can knock off electrons in its orbital shell, thereby creating ions. In abdominal and renal tissues exposure to x-rays, results in a creation of hydroxyl radicals from x-ray interactions with water molecules in the abdomen tissues, these free radicals in turn interact with nearby DNA to cause strand breaks or base damage or may ionize DNA directly. This radiation induce damage may rapidly repaired by various systems within the cell, but DNA double-strand breaks are less easily repaired. However, this disrepair can lead to induction of point mutations, chromosomal translocations, and gene fusions, all of which are linked to the induction of cancer. These biological exposure to photon energy give rise to the determination of various fundamental dosimetric quantity in radiological imaging. The result of these three exposure parameters on the abdomen are the deposition of dose to the renal and abdominal tissue based on the extrapolation by the LNT model may lead to cancer. Furthermore, optimization refers to the process of keeping the exposure of patients to the minimum necessary to achieve the required diagnostic objective. Patient dosimetry and DRLs are recognized as important tools for optimization of patient radiation protection. Unfortunately, values of these DRLs are not available for Comparison in Ghana. BSS set requirements and recommendations for implementation of the principle of optimization of radiation protection of patients in medical facilities using ionizing radiation. Recommendations from IAEA using BSS and other related international bodies such as ICRP, EC and AAPM set out basic essential practice
40
60
EFFECTIVE DOSE mSv
0 2 4 6 8 10
1 12 23 34 45 56 67 78 89
223 this study suggests that radiation doses from CT are highly
varied between institutions. The results of the measured and estimated exposure and dose parameters showed a wide range of values. Even though, the average values were generally lower than the recommended average critical values. This may be misleading, since some of the individual renal dose and effective dose parameters exceeded the critical values, as much as 400%. The approximately 18% and 37% of the estimated values, above the recommended values may lead to prognostic consequences.
4. 5 CONCLUSION
The results of the measured parameters based on the average renal surface area of 29.52cm2 and 30.67cm2 for the right and left kidney respectively, shows that: While the mean dose parameters are; 6.33mGy, 7.78mGy, 936.25mGy cm, 5.76mGy, 3.26mSv and 14.09mSv for CTDIV, CTDIW, DLP, MSAD, RD and E respectively. These
values were lower than the general recommended average critical values. Even though, this may be misleading. This is based on the fact that some individual dose and exposure parameters exceeded the critical values. It is recommended that further studies be done to estimates the abdominal effective dose in all the centers. In order to confirm or refute the estimated high dose in some cases based on the study findings. Patients with a high BMI received relatively greater radiation dose. This is regulated by the automatic exposure control system, the dose received depend to a larger extend the thickness of the area being imaged. This is because greater x-ray penetration is needed to create acceptable images, which increases radiation dose. The amount of incident radiation is suboptimal and the resultant images appear grainy and noisy. Generally, in CT an increase in incident radiation results in an increase in image quality, due to lesser image noise and this may results in DNA damage. However, this depend to a larger extend a number of factors which include the body mass index of the patient. The increased in incident radiation did significantly improve image quality in patients with a very high BMI, but resulted in an increased dose. In patients with a low and average BMI, increase in incident radiation do not substantially affecting image quality, but this was often not the case in patients with a high BMI whose studies proved to be noisy. Exposure to radiation leads to DNA double-strand breaks, the most serious and potentially lethal type of cellular damage that can result in carcinogenesis. In addition, even low-dose radiation (50 mSv) can result in loss of heterozygosity and telomere impairment that can result in chromosomal damage, leading to cancer [36, 37].
RECOMMENDATION
It is recommended that a confirmatory standard reference values of effective dose and renal dose be established in all the CT centers to confirm or otherwise of the estimated abdominal effective dose in all the centers. As clinical advisory mechanism to protect patience and clinicians. In addition it is recommended that the established reference values be use as clinical advisory mechanism to protect patience and clinicians. It is recommended that the studies should be carry out periodical to estimates the abdominal effective dose in all the centers.
REFERENCE
[1] Hendee W R. Physics and applications of medical imaging. Rev Mod Phys. 1999; 71: 444–50.
[2] Tommy Löfstedt, Olof Ahnlund, Michael Peolsson, and Johan Trygg, Dynamic ultrasound imaging: A multivariate approach for the analysis and comparison of time-dependent musculoskeletal movements, BMC Med Imaging. PMCID: PMC3570433, 10.1186/1471-2342-12-29. 2012
[3] Sören Mattsson and Marcus Söderberg, Radiation dose management in CT, SPECT/CT and PET/CT techniques, Oxford University Press. Radiation Protection Dosimetry 2 July 2011, Vol. 147, No. 1– 2, pp. 13–21,
[4] National Council on Radiation Protection and Measurements. Ionizing radiation exposure of the Population of the United States. National Council on Radiation Protection and Measurements; MD, USA: 2009. National Council on Radiation Protection report no. 160.
[5] ICRP, Basic Anatomical and Physiological Data for Use in Radiological Protection Reference Values. ICRP Publication 89. Ann. ICRP 32 2002, pages: 3-4.
[6] Tsapaki V, Kottou S, Papadimitriou D, ―Application of European Commission reference dose levels in CT examinations in Crete, Greece‖, The British Journal of Radiology, 2001, 74(885):836-40.
[7] International Commission on Radiological Protection (ICRP), Radiological Protection and Safety in Medicine, ICRP Publication 73, Ann. ICRP 26(2) (Oxford: Pergamon Press), 1996.
[8] Committee to Assess Health Risks from Exposure to Low Levels of Ionizing Radiation, National Research Council. Health risks from exposure to low levels of ionizing radiation: BEIR VII phase 2. . Washington, DC: The National Academies Press; 2006.
[9] I Reiser, Z Lu, R Nishikawa, University of Chicago, CHICAGO, IL, Contrast-To-Noise Ratio Is Not An Appropriate Measure of CT Image Quality When Comparing Different Iterative Reconstruction Algorithms, 54th annual meeting, July 29-August 2 2012, charlotte, NC
[10] Leitz, W., Axelsson, B., Szendro, G., ―Computed tomography dose assessment a practical approach‖, Radiat. Prot. Dosimetry., 1995, 57 377– 380
Algorithms, 54th annual meeting, July 29-August 2 2012, charlotte, NC
[12] Faiz M. Khan,‖ The physics of Radiation Therapy‖, Lippincott Williams & Wilkins, 2nd Edition, 1984, USA.
[13] Mullenders L, Atkinson M, Paretzke H, Sabatier L, Bouffler S. Assessing cancer risks of low-dose radiation. Nat. Rev. Cancer. 2009; 9:596–604. [PubMed: 19629073] [Excellent review of the differences in biological responses to high- and low-dose radiation that may affect carcinogenic risk]
[14] Rothkamm K, Lobrich M. Evidence for a lack of DNA double-strand break repair in human cells exposed to very low x-ray doses. Proc. Natl Acad. Sci. USA. 2003; 100:5057–5062. [PubMed: 12679524]
[15] Perisinakis K, Damilakis J, Tzedakis A, Papadakis A, Theocharopoulos N, Gourtsoyannis N, 2007, ―Determination of the weighted CT Dose Index in modern multi detector CT scanners‖, Physics in Medicine and Radiology, 2007, 52:6485- 6495.
[16] Leitz, W., Axelsson, B., Szendro, G., ―Computed tomography dose assessment a practical approach‖, Radiat. Prot. Dosimetry., 1995, 57 377– 380
[17] AAPM Report No. 39, ―Specification and Acceptance Testing of Computed Tomography Scanners‖, 1993
[18] AAPM Report No.96, ―The measurement, Reporting, and Management of Radiation Dose in CT‖, 2008
[19] The 2007 Recommendations of the International Commission on Radiological Protection. ICRP publication 103. Ann. ICRP. 2007; 37(2–4):1–332
[20] Origgi D, Vigorito S, Villa G, Bellomi M, Tosi G,‖ Survey of Computed Tomography techniques and absorbed dose in Italian hospitals: a comparison between two methods to estimate the dose-length product and the effective dose and to verify
using Monte Carlo techniques, Chilton, NRPB-SR250 (1993)