118
Air Pollution Prediction Using Machine Learning
Supervised Learning Approach
Madhuri VM, Samyama Gunjal GH, Savitha Kamalapurkar
Abstract: Due to human activities, industrialization and urbanization air is getting polluted. The major air pollutants are CO, NO, C6H6,etc. The concentration of air pollutants in ambient air is governed by the meteorological parameters such as atmospheric wind speed, wind direction, relative humidity, and temperature. Earlier techniques such as Probability, Statistics etc. were used to predict the quality of air, but those methods are very complex to predict, the Machine Learning (ML) is the better approach to predict the air quality. With the need to predict air relative humidity by considering various parameters such as CO, Tin oxide, nonmetallic hydrocarbons, Benzene, Titanium, NO, Tungsten, Indium oxide, Temperature etc, approach uses Linear Regression (LR), Support Vector Machine (SVM), Decision Tree (DT), Random Forest Method (RF) to predict the Relative humidity of air and uses Root Mean Square Error to predict the accuracy.
Index Terms: Air Pollution, Decision Tree, Linear Regression, Machine Learning, Random Forest, Supervised Learning, SVM.
—————————— ——————————
1 INTRODUCTION
The Environment is nothing but everything that encircles us. The environment is getting polluted due to human activities and natural disaster, very severe among them is air pollution. The concentration of air pollutants in ambient air is governed by the meteorological parameters such as atmospheric wind speed, wind direction, relative humidity, and temperature. If the humidity is more, we feel much hotter because sweat will not evaporate into the atmosphere. Urbanization is one of the main reasons for air pollution because, increase in the transportation facilities emits more pollutants into the atmosphere and another main reason for air pollution is Industrialization. The major pollutants are Nitrogen Oxide (NO), Carbon Monoxide (CO), Particulate matter (PM), SO2 etc. Carbon Monoxide is produced due to the deficient Oxidization of propellant such as petroleum, gas, etc. Nitrogen Oxide is produced due to the ignition of thermal fuel; Carbon monoxide causes headaches, vomiting; Benzene is produced due to smoking, it causes respiratory problems; Nitrogen oxides causes dizziness, nausea; Particulate matter with a diameter 2.5 micrometer or less than that affects more to human health.Measures must be taken to minimize air pollution in the environment. Air Quality Index(AQI), is used to measure the quality of air. Earlier classical methods such as probability, statistics were used to predict the quality of air, but those methods are very complex to predict the quality of air. Due to advancement of technology, now it is very easy to fetch the data about the pollutants of air using sensors. Assessment of raw data to detect the pollutants needs vigorous analysis. Convolution Neural networks, Recursive Neural networks, Deep Learning, Machine learning algorithms assures in accomplishing the prediction of future AQI so that measures can be taken appropriately.Machine learning which comes under artificial intelligence has three kinds of learning algorithms, they are the Supervised Learning, Unsupervised
learning, Reinforcement learning. In the proposed work we have used supervised learning approach. There are many algorithms under supervised learning algorithms such as Linear Regression, Nearest Neighbor, SVM, kernel SVM, Naive Bayes and Random Forest. Compared to all other algorithms Random forest gives better results, so our approach selects Random Forest to predict the accurate air pollution.
2
LITERATURE
SURVEY
Ishan et.al [1] described the benefits of the Bidirectional Long - Short Memory[BiLSTM] method to forecast the severity of air pollution. The proposed technique achieved better prediction which models the long term, short term, and critical consequence of PM2.5 severity levels. In the proposed method prediction is made at 6h, 12h, 24h. The results obtained for 12h is consistent, but the result obtained for 6h, and 24h are not consistent. Chao Zhang et.al [2] proposed web service methodology to predict air quality. They provided service to the mobile device, the user to send photos of air pollution. The proposed method includes 2 modules a) GPS location data to retrieve the assessment of the quality of the air from nearby air quality stations. b) they have applied dictionary learning and convolution neural network on the photos uploaded by the user to predict the air quality. The proposed methodology has less error rate compared to other algorithms such as PAPLE, DL, PCALL but this method has a disadvantage in learning stability due to this the results are less accurate.
Ruijun Yang et.al [3] used the Bias network to find out the air quality and formed DAG from the data set of the town called as shanghai. The dataset is dived for the training and testing model. The disadvantage of this approach is they have not considered geographical and social environment characteristics, so the results may vary based on these factors. TemeseganWalelignAyeleet.al [4] proposed an IoT based technique to obtain air quality data set. They have used Long Short-term Memory [LSTM] technique in-order to predict the air quality the proposed technique achieved better accuracy by reducing the time taken to train the model. But still, the accuracy can be improved by compared other techniques such as the Random forest method NadjetDjebbriet.al [5] proposed artificial based Regressive model which is nonlinear to predict 2 major air pollutants 2 ————————————————
Madhuri V M, is currently pursuing masters degree program in CSE , UVCE Bangalore University. Bangalore India. E-mail: [email protected]
Samyama Gunjal GH, is currently working as Assistant Professor, in CSE , UVCE Bangalore University. Bangalore India. E-mail: [email protected], [email protected]
119 such as carbon monoxide and nitrogen oxides. They have
considered the variables such as the speed of the air, air direction, temperature, and moisture and the toxic elements from the industrial site such as Skikda. They have used RMSE and MAE to determine the performance, but this method considered only 2 pollutants such as NO and CO the other major pollutants such as sulfur dioxide, PM2.5, PM10 are not considered.
3
PROPOSED
WORK
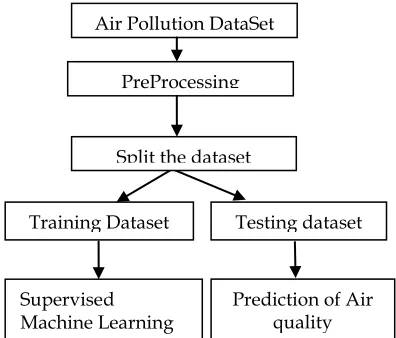
The Air pollutants information is retrieved from the sensors which are processed in a unified schema and stored as a dataset. This dataset is preprocessed with different functionalities such as normalization, attribute selection and discretization. Once the dataset is ready, it is split into training dataset and test dataset. And further Supervised Machine Learning Algorithms are applied on the training dataset. The obtained results are matched with the testing dataset and results are analyzed. Fig. 1 describes the architecture of the proposed model. The air pollution prediction using Supervised Machine Learning approach considers four machine learning algorithms such as LR, SVM, DT, and RF.
3.1 Linear Regression
Linear Regression is used to predict the real values using continuous variables. It is used in many areas such as Economics, Finance, Biology, etc.
Fig. 1. Architecture of the proposed model
Assumptions in Linear Regression:
• Linear Relationship: The relationship between independent and dependent variables should be linear. Using the scattered graph, the linearity is tested.
• Little or No Multi Co-linearity between the dependent variable and independent variable.
• Little or No Auto-Correlation: Auto co-relation is the replica of delay of its function. In linear regression, it is assumed that there is no autocorrelation.
• Dependent Residual errors: It occurs when there is too much dependency among the independent variables.
The equation of the line is given by Yp = Xi(a + b), Where Yp is predicted variable, Xi is independent variable, a is slope and b is the intercept. The error E is,
which is the square of the difference between actual output to the predicted output, where AP is actual output and PO is predicted output. The Fig. 2 shows the flow chart of LR used in calculating AQI.
3.2 SVM
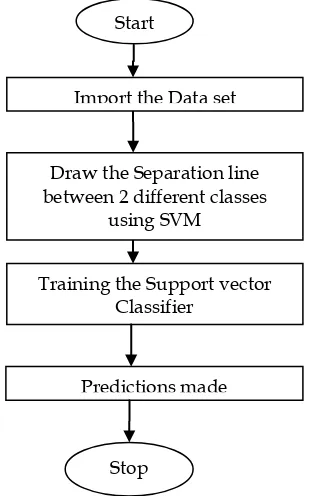
SVM is a SL algorithm in which it divides the plane into 2 parts by drawing a line between the 2 different classes. The line which separates the plane into different parts is called hyper-plane. It always gives a perpendicular distance from the data point to the line of separation. It can do both linear and non-linear classification. It is mainly used to do the classification and regression. Fig. 3 explains the pictorial representation of flow in support vector machine under supervised learning.
Fig. 2. Flow chart of Linear Regression Training Dataset Testing dataset
PreProcessing
Prediction of Air quality Supervised
Machine Learning Algorithms
Split the dataset Air Pollution DataSet
Import air pollution data set
Finding the linearity Cleaning of data
Verifying the results Training the model
Testing the model Start
120 Fig. 3. Flow chart of SVM
3.3 Decision Tree
Decision Tree is one of the supervised learning algorithms which it is used to represent the decision that is made based on the condition. It is used for both classification and regression. The Decision tree is always constructed from top to bottom. The first node from the top is called as root node. The last nodes is called as a leaf node. Internal nodes are present in between the root node and leaf nodes. Based on some condition the internal nodes are split and finally, the decisions are made. In the real time as the number of variables increases tree grows larger and algorithm becomes complex. In Decision tree we have two types, they are classification and regression trees. Classification tree is used to classify the dataset, so that it is easy to analyze the data. But using this algorithm we cannot make a prediction. The Regression tree is a tree mainly used to predict continuous values. Growth of tree depends on factors like:
• the attribute which is chosen to make a prediction; • condition used for the split the tree;
• deciding when to stop or terminate the growth of the tree;
As a tree grows it becomes very complex to analyze, so we need to trim the tree growth. Fig. 4 shows tree with conditions C1, C2, ..., Cn applied on each decision tree DT1, DT2, DT3,.., DTn. Recursive Binary Split technique is used for splitting the tree. In this technique all the attributes are considered and using the cost function split points are tested, and then split points with the best costs are selected. It is also called a recursive algorithm because the decision groups are divided further with the same condition. It is also called as a greedy algorithm since we are concentrating more on reducing the value of the cost of function, so that the root node is considered as a good predictor.
Fig. 4. Decision Tree
Steps involved in Decision Tree:
• Reading dataset : Read the dataset and clean dataset by deleting the unwanted data, dropping missing value, etc.
• Selecting the attributes for predictions: Select the attributes for prediction and split the root node. • Training the dataset: The air pollution data set is split
for training and verification. 75% of the air pollution data is for training and remaining dataset is considered for testing.
• Testing phase: Calculation of accuracy of the split using cost function. It selects the best split with least value cost of a function from both classification and regression, and try to find uniform branches or groups. The sum of the difference between the real value to the predicted value is called Cost Function.
R = Sum(Y − P)2
where R is Regression, Y is the actual value, P is prediction value.
• Stopping the growth of a tree: Complexity of the tree increases as the tree grows, hence stopping the tree growth is one of the important things which must be considered.
3.4 Random Forest
It is defined as a set of decision trees to do regression and
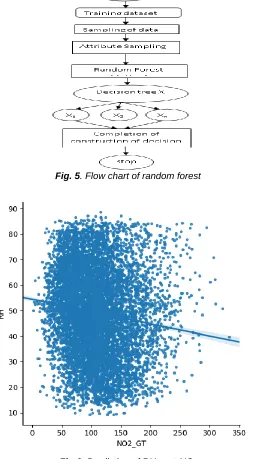
classification. Classification is used to find out the majority voting. Regression is used to calculate the mean value. This algorithm is more accurate, robust, and can handle a variety of data such as binary data, categorical data, and continuous data. Random Forest is nothing but multiple decision trees. 75% of the dataset is considered for the training. The training data is subjected to sampling and based on attribute sampling different decision trees are constructed by applying the Random Forest. Fig. 5. Shows flow chart of Random Forest.
C 2
DTn-1
DT2 DT1
Root node
DTn C
1
Cn-1 Cn
Start
Training the Support vector Classifier
Stop
Draw the Separation line between 2 different classes
using SVM
121 Fig. 5. Flow chart of random forest
Fig 6. Prediction of RH w.r.t NO2
4
EXPERIMENTAL
ANALYSIS
Our approach considers the Mean Squared Error (MSE), Root Mean Squared Error (RSME) to predict the accuracy.
MSE: It is one of the simplest and easiest metrics used in regression. It is defined as the sum of the squares of the difference of the actual value to the predicted value or it is average squared errors of the prediction made. It is given by the equation
Where MSE is Mean Squared Error yk is the actual output
y’k average of observation of yk N is the total observations considered
The drawbacks of MSE: This model is not useful when data is more noisy. Hence RMSE approach is used in the paper.
RMSE: It is defined as Square root of Mean square error. The square root minimize the errors and the equation is
R=√ MSE
Where R is Root mean Squared Error. N is the total of observations
Results are verified using RMSE value. Below are the RMSE values obtained for air-pollution prediction using different supervised learning methods.
Higher the value of RMSE lesser the accuracy of SL methods Lower the value of RMSE higher the accuracy.
Table 1. Accuracy of different models
DISCUSSION
• Over fitting is less in Random Forest because many decision trees are involved.
• Less error in classification in RF: RF gives Better performance compared to Support Vector Machine, Decision Tree, Linear Regression.
• Less Variance compared to Single Decision Tree in RF.
• RF is a highly flexible Algorithm.
• The Minimum time is required for preprocessing the data.
• RF is a very stable algorithm.
• Even if we introduce a new dataset the performance is not affected and attribute Scaling is not required.
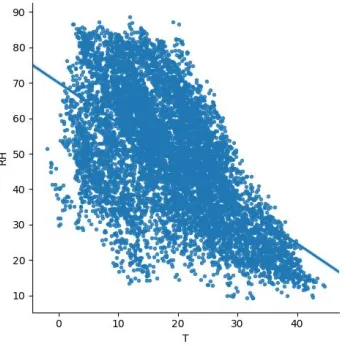
Fig. 6 to 11 represents prediction of Relative Humidity of air by considering a various parameters such as such as tin oxide, benzene, Nitrogen oxide, temperature, Carbon monoxide.
Algorithms Accuracy
Random Forest 0.84
Decision Tree 1.34
SVM 3.89
122 Fig 7. Prediction of RH w.r.t C6H6
Fig8. Prediction of RH w.r.t Temperature
Fig 9. Prediction of RH w.r.t tin oxide
Fig10. Prediction of RH w.r.t NO
Fig 11. Prediction of RH w.r.t tin CO
5
CONCLUSION
The concentration of air pollutants in ambient air is governed by the meteorological parameters such as atmospheric wind speed, wind direction, relative humidity, and temperature. Air Quality Index(AQI), is used to measure the quality of air. The proposed work is a supervised learning approach using different algorithms such as LR,SVM,DT and RF. The result show that AQI prediction obtained through RF are promising which are analyzed with results.
REFERENCES
[1] Verma, Ishan, Rahul Ahuja, HardikMeisheri, andLipikaDey. ”Air pollutant severity rediction using Bi-directional LSTM Network.” In 2018 IEEE/WIC/ACM International Conference on Web Intelligence (WI), pp. 651-654. IEEE, 2018.
[2] Figures Zhang, Chao, Baoxian Liu, Junchi Yan, Jinghai Yan, Lingjun Li, Dawei Zhang, XiaoguangRui, and RongfangBie. ”Hybrid Measurement of Air Quality as a 5 Fig. 8. RH w.r.t tin oxide Fig. 9. RH w.r.t C6H6 Mobile Service: An Image Based Approach.” In 2017 IEEE International Conference on Web Services (ICWS), pp. 853- 856. IEEE,2017.
123 International Conference on Communication
Softwareand Networks (ICCSN), pp. 1003-1006. IEEE,2017.
[4] Ayele, TemeseganWalelign, and RutvikMehta.”Air pollution monitoring and prediction using IoT.” In 2018 Second International Conference on Inventive Communication 6 Fig. 12. RH w.r.t Temperature Fig. 13. RH w.r.t CO and Computational Technologies (ICICCT), pp. 1741-1745. IEEE,2018.
[5] Djebbri, Nadjet, and MouniraRouainia. ”Artificial neural networksbased air pollution monitoring inindustrial sites.” In 2017 International Conference on Engineering and Technology (ICET), pp. 1-5. IEEE,2017.
[6] Kumar, Dinesh. ”Evolving Differential evolution method with random forest for prediction of Air Pollution.” Procedia computer science 132 (2018): 824-833.
[7] Jiang, Ningbo, and Matthew L. Riley. ”Exploring the utility of the random forest method for forecasting ozone pollution in SYDNEY.” Journal of Environment Protection and Sustainable Development 1.5 (2015): 245-254.
[8] Svetnik, Vladimir, et al. ”Random forest: a classification and regression tool for compound classification and QSAR modeling.” Journal of chemical information and computer sciences 43.6 (2003): 1947-1958.
[9] Biau, GA˜ Srard. ”Analysis of a random forest model.” ˇJournal of Machine Learning Research 13.Apr (2012): 1063- 1095.
[10]Biau, Gerard, and ErwanScornet. ”A random forest ´ guided tour.” Test 25.2 (2016): 197-227.
[11]Grimm, Rosina, et al. ”Soil organic carbon concentrations and stocks on Barro Colorado Island— Digital soil mapping using Random Forests analysis.” Geoderma 146.1- 2 (2008): 102-113.
[12]Strobl, Carolin, et al. ”Conditional variable importance for random forests.” BMC bioinformatics 9.1 (2008): 307.
[13]Svetnik, Vladimir, et al. ”Random forest: a classification and regression tool for compound classification and QSAR modeling.” Journal of chemical information and computer sciences 43.6 (2003): 1947-1958.
[14]Verikas, Antanas, AdasGelzinis, and
MarijaBacauskiene. ”Mining data with random forests: A survey and results of new tests.” Pattern recognition 44.2 (2011): 330-349.
[15]Ramasamy Jayamurugan,1 B. Kumaravel,1 S. Palanivelraja,1 and M.P.Chockalingam2 International Journal of Atmospheric Sciences Volume 2013, Article
ID 264046, 7 pages