Techniques for 3-D Surface Reconstruction using
Synthetic Aperture Radar Interferometry
by
A ndrew John W ilkinson
A thesis su b m itted to the University of London for th e Degree of D octor of Philosophy in Electronic Engineering
D ep artm en t of Electronic and Electrical Engineering University College London
ProQuest Number: U643015
All rights reserved
INFORMATION TO ALL USERS
The quality of this reproduction is dependent upon the quality of the copy submitted. In the unlikely event that the author did not send a complete manuscript and there are missing pages, these will be noted. Also, if material had to be removed,
a note will indicate the deletion.
uest.
ProQuest U643015
Published by ProQuest LLC(2015). Copyright of the Dissertation is held by the Author. All rights reserved.
This work is protected against unauthorized copying under Title 17, United States Code. Microform Edition © ProQuest LLC.
ProQuest LLC
789 East Eisenhower Parkway P.O. Box 1346
A b s tra c t
SAR Interferometry (InSAR) has emerged in recent years as a promising technology for topographic mapping. The classical approach to InSAR topographic reconstruc tion involves the decomposition of the problem into a number of distinct stages: SAR focusing, image registration, interferogram formation, phase unwrapping, baseline pa rameter estimation and phase-to-height conversion.
The initial objectives of this research were to investigate and develop techniques for reconstructing topographic maps based on the classical decomposition, focusing particularly on the phase unwrapping and phase-to-height conversion problems.
The thesis begins with a detailed review of existing InSAR theory and classical InSAR processing. This is followed by an analysis of the problem of reconstructing a height map from an unwrapped phase map. A generalized vector analysis of the In SAR geometry is developed and models for the sensor flight trajectories are proposed. Techniques from classical estimation theory are applied to obtain estimates of model parameters from calibration point data. Error propagation theory is applied to esti mate the covariance matrix of reconstructed elevation points in terms of the covariance matrix of the calibration points and an estimate of the accuracy of the unwrapped phase.
In the area of phase unwrapping, existing strategies are reviewed and analysed. From this investigation, it is concluded that currently employed algorithms are not model-based, and may be viewed as “ad doc” classical estimators. Additionally, cur rently employed algorithms provide no measure of uncertainty in the reconstructed phase and consequently existing InSAR processors do not provide realistic indicators of the height uncertainty.
This led to the development of a novel, probabilistic treatm ent of phase unwrapping as a model-based Bayesian inference problem.
A ck n o w led g em en ts
I wish to thank my supervisor Prof. H. D. Griffiths, for introducing me to the field of radar interferometry, and for his patience, support and supervision during the course of this research.
I would like to thank UCL’s visiting professors Dr. R. Benjamen and Dr. K. Milne, for the many discussions, ideas and suggestions.
I wish also to acknowledge Mr. J. J. W. Wilson for his inspiring work.
I wish to thank Dr. R. Bamler and Prof. M. Datcu of the German Aerospace Research Establishment for the many stimulating discussions on InSAR systems.
I am grateful to Prof. M. R. Inggs of the University of Cape Town, for introducing me to the field of radar and remote sensing, and for motivating me to study further. I wish to thank Mr. G. Hassenpflug and Mr. G. Doyle for reading parts of this thesis. To Paul, thank you for your encouragement and support when times were really tough. Thank you also for reading parts of my thesis.
To my parents, thank you for all the support and encouragement.
To my wife, Anja the Bee, thank you for the many energy kisses which helped me through to the end.
C on ten ts
A b stract 3
A cknow ledgem ents 5
C ontents 7
Introd u ction 15
1.1 Basic Principles behind Radar In terfero m etry...i 16 1.1.1 Conventional Side-looking Radar I m a g in g ...j 16
1.1.2 Radar Interferometry ... 17
1.1.3 Topographic Mapping using Radar In te rfe ro m e try ... 19
1.1.4 Classical Interferometric Processing ... | 21
1.2 Historical Literature Survey 1969-1994 ... I 24 1.3 Identification of and Motivation behind Chosen Areas of Research 1.4 Contents of this T h e s is ... 28 32 2 T heoretical P rinciples and Classical Interferom etric P rocessing 35 2.1 In tro d u ctio n... 35
2.2 Problem D e fin itio n ... 35
2.2.1 Topography: The Observed S c e n e ... | 36
2.2.2 The Mapping of the Scene into Slant R a n g e ... ] 37
2.3 SAR Image F o rm a tio n ... {38 2.4 Interferometric P r in c ip le s ...
2.4.1 Point Target Model ... 2.4.2 Reconstruction Equations for Simplified G e o m e trie s ... 2.5 InSAR Statistical M odelling... 2.5.1 The Linearized Interferometric Model for Distributed Targets 2.5.2 The Joint Image S ta tistic s... 2.5.3 An Extension to Layover R egions... 2.5.4 The Interferometric Phase S ta tis tic s ... 2.5.5 Coherence Estimation: A Bayesian A p p ro a c h ... 2.5.6 A Note on D ata U sa g e ... ...
43 43 46 48 49 56 59 61 63
C O NTENTS
2.6 Classical Interferometric Processing... 2.6.1 Classical Interferometric Processing P r o c e d u r e ... 2.7 System C a lc u la tio n s ...
2.7.1 Layover and Shadowing C o n s tr a in ts ... 2.7.2 Phase Noise C alcu la tio n ... 2.7.3 Ambiguity Analysis ... 2.8 Summary and C onclusions...
A naly sis o f a S im p lified 2-D In S A R M o d el
3.1 Introduction ...
3.2 Problem Definition and Description of 2-D Geometry and Variables . . . 88
3.2.1 General Modelling P ro c e d u re ... 3.2.2 InSAR Modelling P ro ced u re... 3.3 Review of Applicable Estimation Techniques ... 92
3.3.1 Chi-square E s tim a tio n ... 93
3.3.2 Weighted Least-squares E stim a tio n ... 94
3.4 Dual Pass Analysis (2-D c a s e )... 95
3.4.1 Dual Pass 2-D InSAR M o d e l ... 95
3.4.2 Equations for Estimating Target L o c a tio n ... 97
3.5 Use of Calibration Points for Estimating InSAR Parameters (Dual Pass 2-D C a s e ) ... 102
3.5.1 Calibration Point M o d e l...102
3.5.2 Problem S ta te m e n t... 103
3.5.3 Formulation of Chi-square Estimation P r o b le m ...104
3.5.4 Formulation of C o n s tr a in ts ... 104
3.5.5 Function Minimization using a Numerical M e t h o d ... 106
3.5.6 Simplified Formulation for Computing InSAR Parameters . . . . 108
3.6 Error Analysis (Dual Pass 2-D C a s e ) ... 110
3.6.1 Review of Error P r o p a g a tio n ...110
3.6.2 Absolute Error Analysis (Dual Pass 2-D C a s e ) ...112
3.6.3 Relative Error Analysis (Dual Pass 2-D C a s e )...115
3.7 Single Pass Analysis (2-D C a s e )...118
3.7.1 Single Pass 2-D InSAR M o d el... 118
3.7.2 Equations for Estimating Target L o c a tio n ...119
3.8 Use of Cahbration Points in Estimating InSAR Parameters (Single Pass 2-D C a s e ) ...120
3.9 Error Analysis (Single Pass 2-D C a s e ) ... 120
C O NTEN TS
4 Sim ulation o f In S A R Param eter E stim ation from C alibration P oints
4.1 In tro d u ctio n ... 4.2 General Description of the Simulation and Test P ro c e d u re ... 4.3 Application to the 2-D Dual Pass M o d e l... 4.3.1 Implemented 2-D InSAR Simulation and Parameter Estimation P ro c e d u re ... 4.3.2 Accuracy considerations and selection of simulation parameters . 4.3.3 Minimum number of cahbration points req u ired ... 4.4 Example 1 ... 4.4.1 Simulation D escription... 4.4.2 Optimization P ro c e d u re ... 4.4.3 Results ... 4.4.4 D iscussion... 4.5 Example 2 ...
4.5.1 Simulation D escription... 4.5.2 Optimization P ro c e d u re ... 4.5.3 Results ... 4.5.4 D iscussion... 4.6 C o n clu sio n s...
5 T hree-D im en sional V ector A nalysis o f Interferom etry
5.1 In tro d u ctio n ...i ... 5.2 Problem Definition and Description of 3-D Geometry and Variables . . 5.3 Modelling the Propagation Medium ... . 5.4 Fundamental Equations for Computing Target Location in 3-D . . . .
5.4.1 Formulation 1 ... 5.4.2 Formulation 2 ... 5.5 Dual Pass Analysis in 3 - D ... 5.5.1 Modelling the Antenna Flight Trajectories in Dual Pass Interfer
ometry . ... 5.5.2 Estimation of Target Location in 3-D ... 5.5.3 Estimation of Target Location in 3-D, for the Case of Param et
rically Modelled Flight Trajectories... 5.5.4 Minimizing S ... 5.5.5 Simplified Calculation of Target Location in 3 - D ... 5.6 Use of Calibration Points for Estimating InSAR Parameters (Dual Pass
3-D C a s e ) ... 5.6.1 Formulation of Chi-square Estimation P r o b le m ... 5.6.2 Formulation of C o n s tr a in ts ...
10 C O N TEN TS
5,6.4 Simplified Formulation for Computing InSAR Parameters . . . . 166
5.7 Error Analysis (Dual Pass 3-D C a s e ) ... 168
5.7.1 Com putation of Variances and Covariances of a Reconstructed Point ... J 5.8 Single Pass Analysis in 3 - D 1"^6 | 5.8.1 Modelling the Flight trajectory and Interferometric Baseline in Single Pass I n S A R 170 ; 5.8.2 Estim ation of Target Location in 3-D 172 ;
5.9 Use of Calibration Points for Estimating InSAR Parameters (Single Pass i 3-D C a s e ) 172 I 5.10 Error Analysis (Single Pass 3-D C a s e ) ... 173
5.11 Summary and Conclusions regarding 3-D InSAR A n a ly s is ... 173
6 R eview o f P h a se U nw rapping A lgorithm s 175 6.1 Intro d u ctio n... 175
6.1.1 Phase Unwrapping as treated in Classical SAR Interferometry . 176 6.1.2 A Simple Scheme for Testing and Evaluating Phase Unwrapping A lg o r ith m s ... 177
6.2 Review of Phase Unwrapping Techniques ... 177
6.2.1 A simple one-dimensional unwrapping a lg o r ith m ... 179
6.2.2 “One-Dimensional Unwrapping by Adaptive Integration” . . . . 180
6.2.3 “The Least-squares Method” ...180
6.2.4 “Cellular-automata Approach” ...181
6.2.5 “Phase unwrapping using a priori knowledge about the band limits of a function” ...181
6.2.6 “Fluid Spreading Approach” ...181
6.2.7 “Tile Processing Approach” ... 181
6.2.8 “Phase unwrapping for Non-connected Regions” ... 182
6.2.9 “Residue/Branch-Cut Methods” ...182
6.2.10 “Fringe Detection Method” ... 184
6.2.11 “Minimization of a Surface Energy Measure” . ... 184
6.2.12 General Comments Regarding the Reviewed Phase Unwrapping A lg o r ith m s ...185
7 A nalysis and Im p lem en ta tio n o f Integer-B ased P h ase U nw rapping Strategies 187 7.1 Introduction... 187
7.2 N o ta tio n ... 189
7.3 Analysis and Implementation of a Residue/Branch-cut Algorithm . . . . 190
7.3.1 B ac k g ro u n d ... 190
C O NTENTS 11 194 197 198 199 200 200 205 208 7.3.3 Linking of Residues with Cuts ...
7.3.4 Practical Im p le m e n ta tio n ... 7.3.5 Results and Discussion... ... 7.3.6 C onclusions... 7.4 Phase Unwrapping in Terms of Maximizing P r o b a b i l i t y ... 7.4.1 A Formulation in Terms of Probability ...
7.4.2 Optimization of the Objective Function . . . ...j 203 7.4.3 A More Efficient Optimization Algorithm: “T he Ranking Algo
rithm ” ... 7.4.4 Improved Ranking Algorithm using “Residue Tracking” . . . .
7.4.5 The Relationship to the Residue/Branch-Cut A lg o rith m ... i 210 7.4.6 Comments on Numerical T ractability... 210 7.4.7 The Existence of “Higher Order” Residues in 1-D and 2-D Phase |
U nw rapping...210 7.5 Improved Residue Linking via Optimization of a Cost F u n c tio n ... | 211
7.5.1 Derivation of a Cost Function for Linking Two R esid u e s... 212 7.5.2 Minimizing the Cost Function using D ijkstra’s Shortest P ath Al
gorithm ...I 214 7.5.3 Application of Cost Function to Residue L in k in g ... 7.6 A Recently Published Global Strategy based on “Minimum Cost Flow”
Network O p tim iz a tio n ... j 217
7.6.1 The Objective F u n c tio n * 218
7.6.2 The Minimum Cost Flow P r o b le m I 218
7.6.3 Equivalence of Costantini’s Objective Function and the Minimum ^ Cost Flow P ro b lem ... 219 7.6.4 The Similarity to The Residue/Branch Cut A lg o rith m | 219
7.6.5 Practical Im p le m e n ta tio n ! 221
7.6.6 MCF Unwrapping R e s u lts i 221
7.6.7 D iscussion ; 223
7.6.8 The Relationship between Costantini’s Objective Function and | the “Smoothness” Objective F u n c tio n ... 7.6.9 Alternative Definitions of the Network to Improve Performance . 7.7 Discussion and C o n clu sio n s...
' 214
8 A P robabilistic A nalysis o f P h ase Unw rapping
8.1 In tro d u ctio n... 8.1.1 N o tatio n ... 8.2 Zero-D Phase U nw rapping... 8.2.1 Modelling the Phase as a Random Variable
12 CONTENTS
8.2.3 A simple Unwrapping R u l e ... 233
8.2.4 Phase unwrapping with Multiple S a m p le s... 235
8.2.5 Joint Probability Approach based on Bayesian Estimation . . . . 236
8.2.6 Comparison of phase averaging by Sim ulation... 243
8.3 One-Dimensional Phase U nw rapping... 245
8.3.1 N o tatio n ... 245
8.3.2 The Bayesian Joint Probability Formulation... 246
8.3.3 Constructing an a priori PDF ... 250
8.4 Two-Dimensional Phase U nw rapping... 257
8.4.1 The Prior D istribution... 258
8.5 Higher-Dimensional Phase Unwrapping ...258
8.6 Posterior Inference Statements ...258
8.7 Summary and Conclusions...260
8.7.1 The Applicability of Phase Unwrapping in SAR Interferometry ... 260
9 A View of In S A R as a B ayesian In feren ce P ro b lem 263 9.1 Background and M otivation...263
9.2 Introduction...264
9.2.1 The Issue of Height E rro rs... 264
9.2.2 The Inverse P ro b lem ... 266
9.3 An Overview of Bayesian Inference and the Model-based Approach . . . 266
9.4 Application to SAR Interferom etry...267
9.5 InSAR; A Bayesian Model-based Form ulation...270
9.5.1 The Param eters... 270
9.5.2 The M easurem ents... 271
9.5.3 The Likelihood D istrib u tio n ... 271
9.5.4 The Prior Distribution ...274
9.6 Inference Statements: the derivation of a topographic m a p ... 276
9.7 A Simple Experiment ...277
9.8 Strategies for Finding the Maxima of the Posterior D istribution ... 279
9.8.1 Decomposition of the Bayesian Form ulation...279
9.9 Discussion and C onclusions...281
10 Sum m ary, C onclusions an d F u tu re R esearch 283 10.1 S u m m a ry ... 283
10.2 Concluding R e m ark s... 288
C O N TEN TS 13
A E r r o r A n aly sis C a lc u la tio n s in 2-D j293
A .l Dual Pass Error Analysis ... ! 293
A. 1.1 Variances as Error Estimates (2-D dual pass c a s e ) ... I 293 A. 1.2 Partial derivatives of the component e q u a ti o n s ...{ 294
A. 1.3 Target Location S e n s itiv itie s ... [ 296
A.2 Single Pass Error A n alysis... | 299
A.2.1 Variances as Error Estimates (dual pass) ...! 299
A.2.2 Partial derivatives of the component e q u a ti o n s ... | 299
A.2.3 Target Location S e n s itiv itie s ...I 300 B A sp e c ts o f Single P a ss In S A R A n aly ses 1303 B .l Use of Calibration Points in Estimating InSAR Param eters (Single Pass * 2-D C a s e ) ... 303
B.1.1 Formulation of Chi-square Estimation P r o b le m ... 303
B.1.2 Formulation of C o n s tr a in ts ... 304
1 B.1.3 Function M inim ization...
j
305 B.1.4 Simplified Formulation for Computing InSAR Param eters . . . J 305 B.2 Error Analysis (Single Pass 2-D C a s e ) ...306B.2.1 Absolute Error Analysis (Single Pass 2-D C a s e )... 306
B.2.2 Relative Error Analysis (Single Pass 2-D C a s e ) ... | 307
B.3 Use of Calibration Points for Estimating InSAR Param eters (Single Pass 3-D C a s e ) ... 309
B.3.1 Formulation of Chi-square Estimation P r o b le m ... 309
B.3.2 Formulation of C o n s tr a in ts ... 310
B.3.3 Function M inim ization... ! 311
B.3.4 Simplified Formulation for Computing InSAR Parameters . . . J 311 i C P a r a m e te r E s tim a tio n P ro g ra m O u tp u t ' 313 C .l Simulation Example 1: O utput L istin g ... i 313 C.2 Simulation Example 2: O utput L istin g ... ,315
C.3 Simulation Example 2: Tabulated R e s u lts ...| 316
14 C O N TEN TS
E.2 Sarajevo Test Scene ... 338
E.2.1 Sarajevo S c e n e ...338
E.2.2 Case 1: Uniform C o s ts ...339
E.2.3 Case 2 ... 339
E.2.4 Case 3 ... 339
E.3 Minimum Cost Flow Phase Unwrapping Algorithm: Sample Program O utput ... 354
F InSA R Sim ulated E xperim ent 3 5 7 F .l Investigation of the Bayesian Objective Function to be Optimized . . . . 357
F.1.1 The Simplified 2-D M o d e l...357
F .l.2 Devising a D em onstration...358
F .l.3 Simulation Implementation and Resulting W a v e fo rm s ... 360
F .l.4 C onunents... 362
List o f Figures 3 7 1
List o f Tables 3 7 7
List o f Sym bols and A cronym s 3 7 9
C hapter 1
In trod u ction
Topographic data in the form of digital elevation models or contour maps are required in many geological, geophysical and surveying applications. There exist several techniques for the acquisition of large scale topographic data. These include:
• traditional surveying techniques, such as land based geodetic levelling..
• stereo photogrammetry (American Society of Photogrammetry 1980) utilizing black and white photographs.
• satellite altimetry, both laser and radar (Elachi 1988).
• stereo radargrammetry, utilizing two or more radar intensity images (Leberl 1990).
• radarclinometry, also known as “shape-from-shading” , utilizing a single radar intensity image (Wildey 1986).
• radar interferometry utilizing both the phase and intensity information in coher ent radar images.
Synthetic aperture radar interferometry, known also as interferometric SA R or In SAR, is a high resolution radar based technique which can be used for topographic mapping. This thesis addresses aspects of the theory and techniques required for the production of topographic maps using radar interferometry.
This introductory chapter begins with a brief overview of radar interferometry, discussing the basic principles and terminology. This is followed by a review of the historical development of the theory and application of interferometry for topographic mapping. W ith this perspective, the areas of research addressed in this thesis are identified and motivated. Lastly a brief description of the contents of the subsequent chapters is given.
16 Chapter 1. Introduction
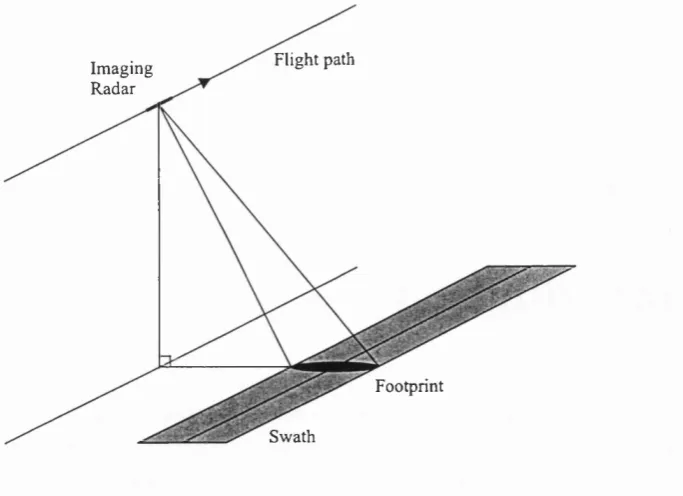
Flight path Imaging
Radar
Footprint
Swath
F ig u re 1.1: Typical SAR imaging geometry.
1.1
Basic Principles behind Radar Interferom etry
1.1.1 C o n v e n tio n a l S id e -lo o k in g R a d a r Im a g in g
Conventional radar imaging for remote sensing is performed by transmitting pulses of high frequency electromagnetic energy in the direction of a target scene from a moving platform passing over the scene. The resulting echoes are received and processed to form a two-dimensional map of the reflective properties of the surface.
A typical imaging geometry for a side-looking imaging radar (SLAR) is depicted in Figure 1.1. As the radar flies along its flight trajectory, it transmits pulses towards the ground at regular intervals. The antenna concentrates the transmitted energy within a beam which illuminates an oval-shaped patch on the surface of the Earth. The echo from a particular pulse is received a short time later, and is sampled as a function of delay time. This signal can be viewed as a projection of the reflection from the surface into range from the radar. High range resolution is achieved by either transmitting a pulse of short duration, or by using pulse compression techniques. The image is built up on a line by line basis by assembling the range profiles as the radar moves along its trajectory. The image is thus expressed in coordinates of time delay (or range) and location of the radar along its trajectory (referred to as azimuth). In conventional side-looking aperture radar imaging, the azimuth resolution is limited by the width of the projected antenna beam on the surface which is in turn limited by the physical size of the antenna and the range to the target scene.
1.1. Basic Principles behind Radar Interferometry 17
(Curlander & McDonough 1991). High azimuth resolution is achieved by a focusing operation, involving the correlation of the image with a reference function derived from knowledge of the radar parameters and system geometry. SAR focusing enables az imuth resolutions of the order of the physical length of the azimuth dimension of the aperture to be realized, independent of range.
Radar images formed from single antenna SLARs suffer from several limitations related to the non-linear projection of the scene into the image coordinates. A radar image formed from a single antenna side-looking radar is essentially a two-dimensional projection of the surface into range and azimuth coordinates.
A focused SAR image is usually expressed in closest-approach (or zero-Doppler) coordinates being those of range perpendicular to the flight trajectory, and azimuth location of the antenna. For a single point, these coordinates define an arc in 3-D space somewhere along which the point lies. In order to fix the precise location of a point additional information is required. This is obtained either from a digital elevation model or by assuming an approximate surface and projecting the SAR data onto the surface. If an accurate DEM is not available, then the image projection will be distorted in regions where the assumed surface deviates from the true surface.
The availability of a second radar image, obtained from a slightly different view angle on a nearly parallel flight trajectory, allows for the possibility of reconstruct ing a 3-D image of the scene by means of a technique known as “across track radar interferometry” .
1.1 .2 R a d a r In te r fe r o m e tr y
The term “radar interferometry” is used broadly to describe a range of measurement techniques involving the signal processing of coherent radar observations of a scene, taken from either different angles or at different times. The word “interferometry” refers to the “combination” or “interference” of the images, and particularly to the exploitation of the phase information contained in the radar images. The terms: “SAR interferometry” , “interferometric SAR” and “InSAR” are terms commonly used to describe radar interferometry involving images produced using the synthetic aperture technique.
The imaging geometry is chosen according to the particular application. In the following sections the most common configurations are described.
A cross Track Interferom etry
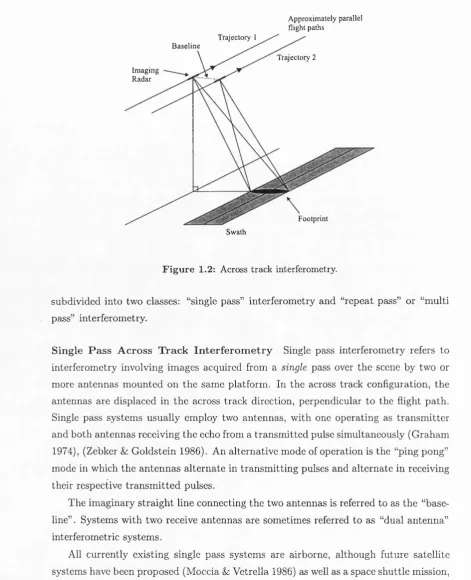
18 Chapter 1. Introduction
A pproxim ately parallel flight paths
Trajectory 1 B a se lin e
Trajectory 2 Im aging
Radar
Footprint Sw ath
F ig u re 1.2: Across track interferometry.
subdivided into two classes: “single pass” interferometry and “repeat pass” or “multi pass” interferometry.
Single P ass A cross T rack In te rfe ro m e try Single pass interferometry refers to interferometry involving images acquired from a single pass over the scene by two or more antennas mounted on the same platform. In the across track configuration, the antennas are displaced in the across track direction, perpendicular to the flight path. Single pass systems usually employ two antennas, with one operating as transmitter and both antennas receiving the echo from a transmitted pulse simultaneously (Graham 1974), (Zebker & Goldstein 1986). An alternative mode of operation is the “ping pong” mode in which the antennas alternate in transmitting pulses and alternate in receiving their respective transmitted pulses.
The imaginary straight line connecting the two antennas is referred to as the “base line” . Systems with two receive antennas are sometimes referred to as “dual antenna” interferometric systems.
All currently existing single pass systems are airborne, although future satellite systems have been proposed (Moccia & Vetrella 1986) as well as a space shuttle mission, planned for around 2000 (the SRTM mission; see JPL website).
1.1. Basic Principles behind Radar Interferometry 19
D ifferential In te rfe ro m e try Repeat pass interferometry can also be used to mea sure minute changes on the surface between passes using a technique known as “differ ential interferometry” (Gabriel, Goldstein & Zebker 1989).
B ista tic In te rfe ro m e try It is also in principle possible to perform interferometry in a bistatic mode in which the transmitter is located on a separate platform from the receivers.
A long T rack In te rfe ro m e try
Along track interferometry (Goldstein & Zebker 1987), (Carande 1992), (Carande 1994), refers to a configuration involving two antennas, located on the same plat form in the along track direction. By analysing the phase difference it is possible to detect movements on the surface and estimate the radial component of the surface velocity. This technique has found application in measurement of surface velocity of ocean waves.
1.1.3 T o p o g ra p h ic M a p p in g u sin g R a d a r I n te r f e r o m e tr y
Topographic mapping using radar interferometry involves the reconstruction of a topo graphic surface from two or more radar images of a scene, observed from slightly different angles. The appropriate imaging geometry for topographic mapping is the across track geometry depicted in Figure 1.2.
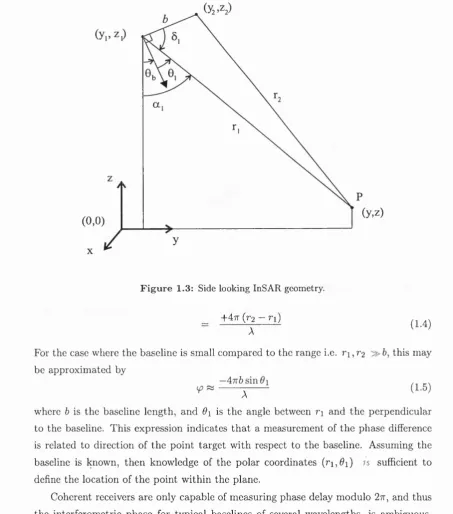
The information about the shape of the topography is primary contained in the A
phase information in the received signals. The principle behind the technique is com monly explained^ by considering the phases of the signals received by two antennas from a point on the target scene (Zebker & Goldstein 1986), (Prati & Rocca 1990), (Rodriguez &: Martin 1992), as depicted in Figure 1.3. For the case of a dual pass system, operating at a carrier wavelength A, the phase delays at each antenna resulting from two way propagation are
(1.1)
(1.2)
where ri and r2 are the ranges and cp2 are expressed in radians. The difference
between these two phases is known as the interferometric phase delay (/?, defined by
y = yi - ^2 (1.3)
20 Chapter 1. Introduction
(0,0)
(y,z)
F ig u re 1.3: Side looking InSAR geometry.
_ -h47T (r2 - r i )
A (1.4)
For the case where the baseline is small compared to the range i.e. r i , r2 this may be approximated by
A
where b is the baseline length, and 9i is the angle between ri and the perpendicular to the baseline. This expression indicates that a measurement of the phase difference is related to direction of the point target with respect to the baseline. Assuming the baseline is known, then knowledge of the polar coordinates (ri,6i) is sufficient to define the location of the point within the plane.
Coherent receivers are only capable of measuring phase delay modulo 27t, and thus the interferometric phase for typical baselines of several wavelengths, is ambiguous. The measured phase difference (in the absence of noise) is related to the absolute phase delay y by
(p = '\p + k2'ïï (1.6)
where k is an integer, and 'tp denotes the noise-free wrapped^hase.
1.1. Basic Principles behind Radax Interferometry 21
which may assume any value in the principal range (—7r,7r]. It can, however, be shown th at for small differences in incidence angle, this effect is common to both images, and subtraction of the phase between two registered sample points still yields a useful phase measurement. As the difference in view angle increases, the degradation effect becomes more pronounced, and the interferometric phase must be modelled as a ran dom variable, with an associated probability function. This random component in the phase is referred to as geometric (or baseline) decorrelation noise.
If one now considers accurately coregistering two SAR images, and computing an image of phase differences then the resulting image, known as an “interfero gram” , exhibits a topography related phase pattern. An example of such a pattern is shown in Figure D.4, Appendix D, which was computed by simulation from the digital elevation model depicted in Figure D .l. Over flat regions of the topography, the phase pattern appears as^series of uniformly spaced parallel fringes. Changes in the slope of topography translate into corresponding changes in the fringe spacing, as can be seen by comparing Figures D.4 and D .l.
An example of an interferogram formed from real radar data is shown in Figure E.2 of Appendix E. This interferogram was formed from a pair of ERS-1/2 SAR images of the Sarajevo valley, and illustrates the effect of the topography on the fringe pattern
(after removal of the average fringe rate).
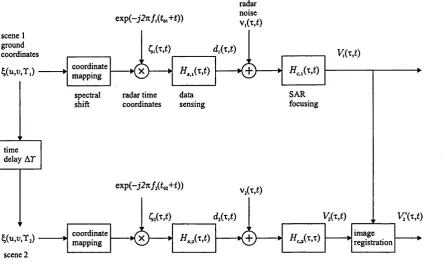
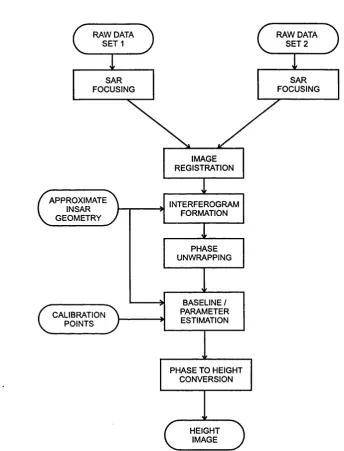
1 .1 .4 C la ssic a l In te r fe r o m e tr ic P r o c e ssin g
The current approach to interferometric processing (which we term “the classical In SAR approach” ), as developed by Zebker &: Goldstein (1986), is based on reconstructing the topography from an interferogram obtained by accurate coregistration of two SAR images. As already discussed, the interferometric phase measurement is only known modulo 27T, and in order to reconstruct the spatial location of a point in the scene, the absolute phase (p =
ip
+ k2TT must be constructed from the noisy interferogram phase ■0(x,r). The standard approach to resolving this ambiguity, is first to “unwrap” the interferogram on a relative basis using a phase unwrapping algorithm, and then to shift the entire unwrapped phase to the correct level by adding a constant phase shift to the entire image. The determination of the unknown phase offset is usually performed with the aid of calibration points of known location on both the imaged surface and interferogram.22 Chapter 1. Introduction
the errors a t the calibration points. Once the model param eters have been estim ated,
the topography can be reconstructed by calculating the 3-D location of every point on
the interferogram from th e knowledge of the baseline and the absolute phase surface.
The simplified explanation given above outlines the processing steps commonly used
in the reconstruction of a digital elevation m odel from two SAR images. A critical stage
in the processing is the unw rapping of the interferogram ; unw rapping errors tran slate
directly into corresponding distortions in th e resulting height map.
L im itations of T o p o g rap h ic Im aging U sing R a d a r In te rfe ro m e try
Several factors place fundam ental lim itations on the accuracy of digital elevation models
derived from SAR interferom etry. These include lim itations owing to the imaging
geometry, frequency of operation, rad ar resolution in range and azim uth, receiver noise,
signal decorrelation owing to varying surface reflectivity properties, and atm ospheric
propagation effects.
The side-looking geom etry imposes several constraints. Because the
radar views the topography a t an angle (typically between 20° and 80° from the verti
cal) parts of the scene in hilly areas may be hidden from line-of-sight view. This effect
is known in SAR term inology as “shadowing” . In shadowed regions of the image, the
topography m ust either be estim ated by interpolation, or alternatively, by acquisition
of a second set of SAR images from a different view angle. A second lim itation of view
angle is the phenom enon of “layover” which occurs in p arts of an image where the
steepness of the terrain results in different areas of the image falling within the same
set of range bins, i.e. two or more p arts of the scene are “overlaid” . M ultipath effects
may also be present. R econstruction of the terrain in layover regions is a fi^'^c.A^task
R epeat pass system s suffer from several fundam ental problems not present in single
pass systems. These include: a lack of user control over the baseline geometry; signal
degradation owing to changes in th e surface reflectivity properties between passes (a
phenomenon referred to as “tem poral decorrelation” ); phase distortion caused by vari
ation in the propagation characteristics of th e atm osphere between passes. Single pass
systems on the other hand capture two or more images sim ultaneously and thus do not
suffer from the effects of tem poral decorrelation. Atm ospheric propagation delays are
also of negligible effect. T he baseline length is fixed and is selected by the designer,
within the physical constraints of the platform . Aircraft systems do, however, require
accurate m otion com pensation.
Lim itations also vary according to the particular objective of th e m easurem ent
system. If the objective is to m easure th e level of the soil, earth and rock of the
E a rth ’s surface, then vegetation and other objects on th e surface represent an unwanted
obstruction or bias on th e signals. In some applications the objective may include
1.1. Basic Principles behind Radar Interferometry 23
electromagnetic wave with the surface necessitate^ the development of models relating the physical surface to the received signals.
Accurate models are also required for the various elements of the system, including the flight trajectories of the sensors, which are usually estimated with the aid of cali bration points. The calibration point accuracy and availability are factors which must be considered in the design of a practical system.
System s for Topographic M apping
Many systems exist for both airborne and spaceborne interferometry. This section con tains a list of systems and some technical specifications obtained from various sources including (Moreira 1995).
A irborne S y stem s
Modern airborne systems operate in single pass mode with two or more receiver an tennas mounted in the across track direction. Most sensors operate in the microwave frequency range with baseline lengths of between 1 and 12 m with differing orientations. Airborne systems (past and present) include:
• The Goodyear Interferometer, developed by Goodyear, USA: across track inter ferometry in X-band (no longer operational) (Graham 1974).
• AIRSAR & TOPSAR, JPL, USA: along and across track interferometry in L and C-band (Zebker, Madsen, Martin, Wheeler, Miller, Lou, Alberti, Vetrella & Cucci 1992).
• OCRS: single pass across track interferometry in C-band. Repeat pass interfer ometry demonstrated in both C and X-band (Gumming, Hawkins & Gray 1990).
•. Norden Systems, UTC: across and along track interferometry in Ku-band (O’Brien k Held 1992).
• Do-SAR, Dornier, Germany: across and along track interferometry in C-band (Faller, Meier, Fritsch & Sieber 1994).
• EMI-SAR, Technical University of Denmark: repeat pass and single pass inter ferometry in C-band.
• Car abas, FOA, Sweden: repeat pass interferometry in UHF-band, 10-90 MHz.
• UK Defence Research Agency SAR: across and along track interferometry in C-band (Barker 1993).
24 Chapter 1. Introduction
• Aero Sensing Systems, Germany: across track single pass interferometry in X- band (Aerosensing 1997).
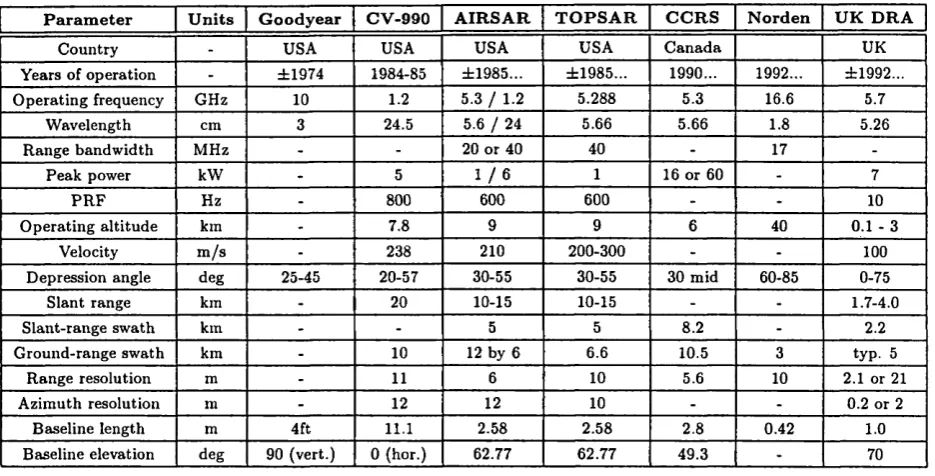
A brief summary of the technical specifications of some of these airborne InSAR systems is given in Table 1.1.
Spaceborne System s
All currently existing spaceborne interferometric systems operate in repeat pass mode. Operating baselines vary according to platform height, look angle and radar parameters - typically baselines range between tens and hundreds of metres. Spaceborne platforms used for interferometry include:
• SEAS AT, JPL, USA: repeat pass interferometry in L-band.
• SIR-B, JPL, USA: repeat pass interferometry in L-band.
• ERS-1/2, ESA, Europe: repeat pass interferometry in C-band.
• J-ERS-1, NASDA, Japan: repeat pass interferometry in L-band.
• SIR-C/X-SAR, JPL/D A R A /A SI, USA/Germany/Italy: repeat pass interferom etry in L, C and X-band.
• Almaz, NPO, Russia: repeat pass interferometry in S-band.
• RadarSAT, Canada: repeat pass interferometry in C-band.
• A-SAR/EnviSAT, ESA, Europe: repeat pass interferometry in C-band (under construction).
• SIR-C/X-SAR (SRL-3), JPL/D A RA /A SI, USA/Germany/Italy: across track in terferometry (the SRTM mission to be launched around 1999/2000).
A brief summary of the technical specifications of some of these spaceborne InSAR systems is given in Table 1.2.
1.2
H istorical L iterature Survey 1969-1994
The purpose of this section is to present a brief survey of the historical development of SAR interferometry for topographic mapping.
1.2. Historical Literature Survey 1969-1994 25
P aram eter U n its G oodyear C V -990 A IR S A R T O P S A R OCRS N orden U K D R A
Country - USA USA USA USA Canada UK
Years of operation - ±1974 1984-85 ±1985... ±1985... 1990... 1992... ±1992...
Operating frequency GHz 10 1.2 5.3 / 1.2 5.288 5.3 16.6 5.7
Wavelength cm 3 24.5 5.6 / 24 5.66 5.66 1.8 5.26
Range bandwidth MHz - - 20 or 40 40 - 17
-Peak power kW - 5 1 / 6 1 16 or 60 - 7
FRF Hz - 800 600 600 - - 10
Operating altitude km - 7.8 9 9 6 40 0.1 - 3
Velocity m /s - 238 210 200-300 - - 100
Depression angle deg 25-45 20-57 30-55 30-55 30 mid 60-85 0-75
Slant range km - 20 10-15 10-15 - - 1.7-4.0
Slant-range swath km - - 5 5 8.2 - 2.2
Ground-range swath km - 10 12 by 6 6.6 10.5 3 typ. 5
Range resolution m - 11 6 10 5.6 10 2.1 or 21
Azimuth resolution m - 12 12 10 - - 0.2 or 2
Baseline length m 4ft 11.1 2.58 2.58 2.8 0.42 1.0
Baseline elevation deg 90 (vert.) 0 (hor.) 62.77 62.77 49.3 - 70
Table 1.1; Some Airborne SAR systems used for interferometry 1974-1996
P a r a m e te r U n its S E A S A T S IR -B A L M A Z E R S - 1 /2 J E R S -1 S I R -C /X -S A R
Launch date - June 1978 Oct. 1984 1990 1991/96 1992 1993/94
Operating frequency GHz 1.275 1.2 S-band 5.3 L-band L,C,X
Wavelength cm 23.5 23.4 - 5.66 - 3.12/5.67/24.2
Range bandwidth MHz 19 12 - 15.55 -
-Peak power kW 1 - - 4.8 -
-PRF Hz - - - 1679 - 1736
Operating altitude km 800 236 300 785 568 ‘ 215
Off nadir angle (mid) deg 23 31 30-60 23 35 15-60
Slant range (mid) km 860.6 280 - 844.5 - ‘ 320
Swath width km 15 by 100 100 20 100 80 10-150
Slant range resolution m 6.27 / 7.89 - - 10 - 13 or 26
Ground range resolution m 20 30 15-30 25 30 25
Azimuth resolution m 3.93 / 22.4 25 - 5 - 13 or 26
Baseline length m - <1600 - <1000 -
-Baseline elevation deg 0 (hor.) 0 (hor.) - 0 (hor.) -
-Repeat cycle days 3 - - 3/35 or 1 -
26 Chapter 1. Introduction
obtain elevation data of the Moon using two E arth based antennas (Zisk 1971), (Zisk 1972). This is probably the first use of radar interferometry for topographic mapping.
The first reported^ airborne radar interferometer was an analogue system operating at X-band (Graham 1974), which was used to produce elevation maps of the Earth. In the early eighties it was suggested (Elachi 1982) that this radar interferometer approach was feasible from space. Moccia & Vetrella (1986) (with further analysis in (Moccia &: Vetrella 1992), (Moccia, Vetrella &: Grassi 1993)) proposed an interferometer experiment from space involving satellites connected by a tether.
In 1985, JPL began work on interferometry and developed an airborne dual antenna L-band SAR interferometer (known as AIRSAR) flown on a NASA CV990 aircraft. This system was reported in a paper by Zebker & Goldstein (1986), which described the fundamental principles behind the technique which is referred to in this thesis as the “classical” approach to interferometric processing. From this point in time, interest in SAR interferometry increased dramatically.
A paper by Hirosawa &; Kobayashi (1986) discussed height measurement capabilities of a Graham-type dual antenna single pass interferometer operating from space. Hug, Kaupp, Waite &: MacDonald (1986) discussed how the interferometric technique could be used to rectify distortions in SAR images. Durand (1987) discussed aspects of the feasibility of repeat pass interferometry from space.
JPL extended the application of radar interferometry by applying the technique to repeat pass satellite data. The first reported example of repeat pass satellite interfer ometry (Goldstein et al. 1988) demonstrated the use of SEASAT d ata for topographic mapping. This paper also described a technique for 2-D phase unwrapping based on “the identification and connection of residues by branch cuts” . Gabriel & Goldstein (1988) further extended the repeat pass technique to the case of non-parallel crossed or bits, demonstrating practical results from a SIR-B experiment. Coherence constraints and an image registration procedure were also discussed. A paper by Gabriel et al. (1989) introduced the application and theory of repeat pass differential interferometry for mapping small elevation changes. A paper by Rodriguez, Parsons &: Walsh (1989) analysed systematic and random errors in interferometric altimeters. Li Sz Goldstein (1990) introduced a simple model for the statistics of the interferogram phase, and obtained (by simulation) graphs of the phase variance as a function of the local scene coherence.
Researchers in Italy (Prati 1989), (Prati, Rocca k Guarnieri 1989), (Prati k Rocca 1990), (Prati, Giani k Leuratti 1990), further developed the theory and processing of repeat pass satellite data, with practical appHcations of SEASAT data. Their work included further development of the residue/branch-cut phase unwrapping technique.
Gumming et al. (1990) produced a list of sources contributing to the errors in
1.2. Historical Literature Survey 1939-1994 27
airborne SAR interferometry.
Marom, Goldstein, Thornton & Shemer (1990) investigated the use of interferom etry for remote sensing of ocean wave spectra.
In Germany, Dornier Aerospace developed an interferometric processor for ERS-1 data, and unpublished work (Wilson 1991) included further development of the theory, and theoretical calculation of interferometric phase errors.
Lin Sz Vesecky (1991) proposed an alternative approach to phase unwrapping based on the detection of fringes using edge detection techniques. Further enhancements to their fringe detection approach were described in (Lin, Vesecky & Zebker 19926) and (Lin, Vesecky & Zebker 1994), and a registration technique was described in (Lin, Vesecky & Zebker 1992c) and (Lin, Vesecky &: Zebker 1992a).
Bertoni, Dente, Vinelli & Farina (1992) developed a simulator for interferometry, which included models for both shadowing and layover effects.
The JPL DC-8 mounted airborne system was modified to operate at C-band (Ze bker, Madsen, Martin, Wheeler, Miller, Lou, Alberti, Vetrella & Gucci 1992), (Evans, Farr, Zebker, van Zyl Sz Mouginis-Mark 1992), and papers by Madsen Sz Zebker (1992), (Madsen, Zebker & Martin 1993) described automated techniques for motion compen sation, absolute phase retrieval, and three-dimensional reconstruction. A paper by Rodriguez Sz M artin (1992) addressed the overall design of interferometric SAR sys tems, including the further developrhent of models for the signal statistics, an optimal estimator for the interferogram phase and design curves for estimating the optimal baseline. Zebker Sz Villasenor (1992) further analysed the factors contributing to the signal decorrelation. SEASAT and ERS-1 results were compared (Zebker, Villasenor Sz Madsen 1992).
In Canada, the OCRS developed a C/X-band airborne interferometer (Gray, M attar & Farris-Manning 1992a), (Gray, M attar Sz Farris-Manning 19926). Gray Sz Farris- Manning (1993) demonstrated the first airborne repeat pass interferometric results.
O ’Brien &: Held (1992) of Norden Systems, UTC developed a Ku band airborne interferometric system.
Seymour & Scheuer (1992) of MacDonald Dettwiler in Canada developed a proto type interferometric processing facility.
A significant contribution to the understanding of interferometry was the devel opment of the “spectral shift” concept (Prati Sz Rocca 1992), (P rati Sz Rocca 1993), (Gatelli, Guarnieri, Parizi, Pasquali, P rati Sz Rocca 1994). This work resulted in the proposal of a tunable SAR system or “TINSAR” (Prati Sz Rocca 1993) to allow inter ferometry with wider baselines. Also proposed were “spectral shift” filters for reducing interferogram phase noise, and techniques for separating terrain returns in layover ar eas.
28 Chapter 1. Introduction
Researchers at CNES in France (Massonnet & Rabaute 1993), (Massonnet 1993) analysed the potential of InSAR with ERS-1 data. ERS-1 InSAR applications were also studied at the University of Stuttgart, Germany (Hartl &: Wu 1993), (Hartl, Thiel, Wu & Xia 1993), (Hartl, Thiel & Wu 1993), (Hartl, Thiel, Wu & Sievers 1994).
Small, Werner & Nuesch (1993) of the University of Zürich, Switzerland, described baseline modelhng and estimation from tie points.
Wegmuller, Werner & Rosen (1993) derived expressions relating the terrain slope to the interferogram phase gradient and applied their results to the normalization of SAR backscatter images (Werner, Wegmuller &: Small 1993).
Papers by (Bamler Sz Just 1993) and (Just Sz Bamler 1994) of the DLR, Germany, applied a linear systems approach to the analysis of phase statistics in interferograms.
Rodriguez, Imel Sz Madsen (1994) analysed in detail the factors determining the accuracy of airborne InSAR systems.
Stevens, Gumming Sz Gray (1994) analysed aspects of motion compensation for airborne InSAR systems.
Zebker, Werner, Rosen Sz Hensley (1994) presented the results of a study of the errors in maps derived from ERS-1 repeat pass data.
Faller et al. (1994) described the results of the Dornier DO-SAR single pass airborne system.
A paper by Lee, Hoppel Sz Miller (1994) derived statistics for the intensity and phase of multilook polarimetric and interferometric SAR imagery.
As can be seen from this survey, SAR Interferometry is a rapidly developing field with new publications appearing every year. This survey is extends to the end of 1994, and serves to place the work presented in this PhD thesis in its historical context.
1.3
Id entification o f and M otivation behind C hosen A reas
o f R esearch
In the context of the above literature, two main areas of research were identified and chosen for investigation. These were the geometric modelling of the InSAR system and the problem of phase unwrapping. As a consequence of the work on phase unwrapping, a new approach to InSAR topographic mapping was formulated, based on a model- based Bayesian approach.
Prepgiratory W ork on Background T heory and System C alculations
1.3. Identification of and Motivation behind Chosen Areas of Research 29
the coherence is addressed and a new approach for coherence estimation is proposed within a Bayesian framework.
Convenient expressions for various system calculations are derived, including the development of convenient equations for calculating parameters like shadowing and layover constraints, interferogram fringe spacing and other ambiguity spacings. Some system parameters are evaluated for the ERS-1 system geometry.
W ork on G eo m etric M odelling of InS A R System s
The classical approach to InSAR processing treats the problem of phase unwrapping and phase-to-height conversion as two separate processing stages. This work on geo metric modelling focuses on the development of techniques for reconstructing the 3-D topographic surface from an unwrapped phase map.
Examination of the literature addressing the classical approach to InSAR, showed few papers addressed in detail the issues of mathematical modelling of the system geometry, particularly mathematical models for the flight paths of the antennas. None of the papers found in the literature survey developed a comprehensive error analysis of an InSAR model. Some papers (Rodriguez et al. 1989), (Li & Goldstein 1990), (Wilson 1991), (Rodriguez & Martin 1992), (Rodriguez et al. 1994) and (Zebker et al. 1994) performed basic sensitivity analyses, but these were of a limited nature, not taking into account the correlations between model parameters in the estimation of errors (which is necessary).
With these factors in mind, a general, model-based approach to reconstructing a height image from an unwrapped phase map was developed. Because the 3-D geometry is complicated to visualize and difficult to analyse, it was decided first to devise a simple 2-D InSAR model, and to develop the appropriate techniques on this simple model with the intention of extending the same techniques to the 3-D geometry. This work is documented in Chapter 3 and includes a review of the applicable parameter estimation theory and error propagation theory. Techniques from classical estimation theory (e.g. maximum likelihood and least-squares techniques) are applied to obtain “best”^ estimates of the model parameters from which the surface is reconstructed, again using a second application of classical estimation theory.
In order to verify the proposed parameter fitting technique, a simple InSAR simu lation was devised. This involved defining a known InSAR geometry, generating a set of calibration points, and then computing a set of radar phase measurements for each calibration point. By application of the parameter estimation techniques developed in Chapter 3, these measurements were then used to obtain the model parameters to
^Although this work is baaed on classical estim ation theory, the author is a proponent o f the Bayesian approach to inference and applies the classical techniques w ith the frame of mind that they arc equivalent to finding the Bayesian maximum posteriori under the hypothesis of a uniform prio r
30 Chapter 1. Introduction
a high degree of accuracy. Chapter 4 documents the simulation work and shows the results obtained.
The next step was to generalize the modelhng techniques to the 3-D case of curved, non-parallel flight trajectories. From a survey of the literature, it was concluded th at none of papers read presented a comprehensive treatment of the 3-D geometric recon struction problem. Some authors did, however, describe techniques for modelhng a time-varying baseline containing various simplifying approximations (Gabriel Sz Gold stein 1988), (Small et al. 1993), (Gray Sz Farris-Manning 1993).
Chapter 5 presents a generalized 3-D vector analysis for both dual pass and single pass systems. Parametric models are developed for both satellite and aircraft systems. Techniques for estimating the model parameters are developed, based on the use of calibration points. In order to estimate the accuracy of the reconstructed surface, a hnear error propagation model is developed. Methods of calculating the covariance matrix of the model parameters are derived, from which the covariance matrix of a reconstructed point on the 3-D image may be computed.
Work on P h ase U nw rapping
The work on phase unwrapping began with a literature survey, and some initial experi mentation with existing techniques. From the literature survey and practical experience gained, it was concluded th at the problem of phase unwrapping was not fully under stood and existing techniques were “ad /loc” , providing no measure of uncertainty in the unwrapped phase. Consequently an effort was made to develop a deeper understanding of the problem, resulting in the author’s novel formulation of the phase unwrapping as a model-based Bayesian inference problem.
The work presented in this thesis is divided into three chapters. The first chapter. Chapter 6, contains an introduction to the problem and a literature survey of phase unwrapping techniques.
1.3. Identification o f and Motivation behind Chosen Areas of Research 31
cally tractable global optimization strategy were unsuccessful, considerable insight was gained, which led to the development of a simple algorithm for linking two residues by optimization of a cost function (Wilkinson, Griffiths & Inggs 1995), This technique is also documented in Chapter 7. The last section in Chapter 7 documents the imple mentation and performance of a recently pubHshed integer-based strategy (Costantini
1996), which solves the problem globally by mapping the problem into an equivalent network problem for which there exists a fast deterministic solution. This algorithm is compared to other techniques.
The third chapter. Chapter 8, entitled “A Probabilistic Analysis of Phase Unwrap ping” documents the author’s attem pts to develop a more rigorous statistical analysis of the problem. The analysis was motivated by the author’s view th at the topographic phase surface should be perceived as a sample of random process, and the phase un wrapping problem should be viewed as that of finding the unwrapped surface which is
“most probable” (initial ideas published in (Wilkinson Sz Griffiths 1994)),
In order to simplify the problem, the author took the approach of attem pting first to solve the simplest of all phase unwrapping problems (the 0-D problem), being that of reconstructing the phase of a single wrapped sample. For this, a simple statistical model was developed. An investigation of how to handle such problems led to the iden tification of the Bayesian inference technique** as being the most appropriate statistical inference technique. The Bayesian approach to parameter inference is based on the representation of our knowledge of the parameters (after measurement of the data) in the form of a conditional probability distribution known as the posterior distribution. From the posterior distribution can be derived the “most probable'^surface(s) and a measure of uncertainty in the form of a confidence interval.
In Chapter 8 these ideas are applied first to the 0-D case and are then extended into one and two dimensions. Several model-based parameterizations are developed, and stochastic models for the phase surface are proposed.
The chapter concludes with a brief discussion on the phase unwrapping problem as it arises in SAR interferometry, as seen in the context of Bayesian inference. It is concluded th a t phase unwrapping is j from the point of mew of optimal inference, a. Suloc^mcj} technique for SAR interferometry. The conclusion stems from the fact that the mapping from topography into slant range is not everywhere one-to-one, and th at the terrain cannot in general be represented (i.e. parameterized) oy a. ^ function in the slant range domain. Finally, we conclude that o_ A/e_: approach is to parameterize the topography directly, and formulate the posterior distribution in terms of these parameters.
32 Chapter 1. Introduction
A lternative V iew o f In S A R as a M odel-based B ayesian E stim ation P roblem
As a consequence of the insight gained in the analysis of the phase unwrapping problem, particularly the modelling of the phase surface as a random process and its formulation as a Bayesian inference problem, a new approach to InSAR topographic mapping was conceived. The theoretical principles are documented in Chapter 9.
The approach is based on a treatment of the InSAR reconstruction problem as a Bayesian inference problem, formulated in terms of a direct parameterization of the topography. The application of the Bayesian approach involves devising: a model relating system geometry, surface topography and reflectivity to the measured radar signals, a stochastic model of the topographic surface embodying the dominant terrain characteristics of slope and curvature and a stochastic model of the surface reflective properties. This information is combined into a conditional probability density function of the model parameters given the measured data. In Chapter 9, system models are proposed and possible algorithms for estimating model parameters are considered. The issue of formulating an error estimate is also discussed.
1.4
C on ten ts o f th is T hesis
In summary, this thesis contains the following chapters:
• Chapter 1 is this introductory chapter.
• Chapter 2 describes the theoretical principles behind classical InSAR techniques for topographic mapping.
• Chapter 3 describes the synthesis and analysis of a simple 2-D model for recon structing elevation data from an unwrapped phase map. It includes the devel opment of a technique for estimating the model parameters based on the use of calibration points, and a thorough analytical error analysis.
• Chapter 4 presents a demonstration of the use of calibration points for estimating the parameters of a simple 2-D InSAR model.
• Chapter 5 presents a generalized 3-D vector analysis of an InSAR system. Tech niques are developed for reconstructing the surface elevation from an unwrapped phase map.
• Chapter 6 contains an introduction to the phase unwrapping problem and a literature survey reviewing various phase unwrapping techniques.
• Chapter 7 describes work performed on the analysis and implementation of
1.4. Contents of this Thesis 33
residues; the implementation of a global optimization algorithm based on a min imum cost flow optimization.
• Chapter 8 presents a probabilistic, model-based analysis of the phase unwrapping problem, formulated within the framework of Bayesian inference.
• Chapter 9 contains the author’s view of InSAR topographic mapping as a para meterized, model-based, Bayesian inference problem.
C hapter 2
T h eoretical P rin cip les and
C lassical Interferom etric
P ro cessin g
2.1
In trod u ction
The theory of InSAR topographic mapping has been rapidly evolving over the past decade. Consequently the theory is scattered over many papers. This chapter serves mainly to provide a description of current theoretical principles, laying a foundation for the work in subsequent chapters.
The chapter begins with a definition of the problem and a discussion on various limiting factors in InSAR topographic mapping. This is followed^n overview of the SAR image formation process and a description of the fundamental interferometric principles. A detailed statistical model of the InSAR system is then developed based on elements of existing InSAR theory and several novel contributions from the author
(which are noted in the text).
This is followed by an overview of the classical interferometric processing and a brief discussion on the various processing stages. The last part of the chapter contains the derivation of several formulae for calculating various system parameters: shadowing and layover constraints, phase decorrelation and a detailed ambiguity analysis. Some numerical examples are given for typical ERS-1/2 imaging geometries.
2.2
P rob lem D efinition
The primary objective in topographic mapping is the production of a digital elevation model of the E arth ’s surface at some desired resolution. To achieve this goal using radar interferometry, a series of radar observations of the scene must be acquired and appropriate signal processing algorithms devised to reconstruct a topographic map.
36 Chapter 2. Theoretical Principles and Classical Interferometric Processing
man-made structures cities etc. vegetation
trees/grass etc. mountains
ice/sn ow flat plain s
sea/lakes
F ig u re 2.1: Illustration of the wide variety of objects and terrain types on the Earth’s surface.
The topographic reconstruction problem is in essence an inverse problem: based on a series of observations of a scene our objective is to reconstruct the scene as accurately as possible using the measured data, together with our knowledge of the observation system and our prior knowledge of the scene. In the case of topographic mapping using radar interferometry, the scene is the surface of the Earth and our observation system is an imaging radar. In order to design a signal processing algorithm is necessary to
A define what is meant by topography.
2.2.1 T opography: T h e O bserved Scen e
As is illustrated in Figure 2.1, the Earth’s surface consists of a wide variety of terrain types including:
• Hat pla s, marshy swamps, sandy deserts, rugged mountains etc. • seas, lakes, rivers, snow, ice etc.
• vegetation, crops etc.
• man made objects, cities, motor vehicles, roads etc.
The task of defining what it is we wish to reconstruct depends on the end-user requirements. For the purposes of civil engineering, for example, the requirement of a topographic map usually refers to the height of the soil or rock on the Earth’s surface excluding vegetation and man made objects. In other applications, for example the guidance of a low-fiying aircraft or military target recognition, a map is required which includes all objects (i.e. trees, high buildings, vehicles etc.) on the surface.
The definition is further complicated by the fact that the Earth’s surface is for ever changing owing to varying weather conditions, seasonal changes, movement of landrnasses etc.
2.2. Problem Definition 37
s h a d o w l a y o v e r
l a y o v e r o n e - t o - o n e
o n e - t o - o n e ( n e g a t i v e f r e q u e n c i e s o n l y ) s h a d o w
s h a d o w
s h a d o w s h a d o w l a y o v e r s h a d o w l a y o v e r o n e - t o - o n e
F ig u re 2.2: Illustration of the mapping of the scene into slant range.
only way to remove this bias is through identification of the objects on the surface and inclusion of some form of compensation for them. This issue requires modelling of the scattering properties of the objects on the Earth’s surface.
2.2.2 T h e M a p p in g o f th e S cen e into Slan t R a n g e
SAR imaging radars view the scene at an angle typically between 10 and 80 degrees from nadir. Consequently some areas of the topography are hidden from direct line of sight and are termed “shadowed” areas. Without additional information these areas may only be reconstructed through interpolation.
A second consequence of the side-looking geometry is the phenomenon of “layover” which occurs when two or more areas of the surface map into the same range from the radar. Figure 2.2 depicts the mapping of a mountainous region from ground range into slant range and illustrates various cases in which shadowing and layover arise.
A third effect is the so called “multipath effect” which occurs when an incident ray reflects energy onto other areas of the surface which returns to the receiver via one or more indirect paths as illustrated in Figure 2.3.