Activity, Dietary Intake, and Weight Changes in a Longitudinal Study of
Preadolescent and Adolescent Boys and Girls
Catherine S. Berkey, ScD*‡; Helaine R. H. Rockett, MS, RD*; Alison E. Field, ScD*;
Matthew W. Gillman, MD, SM㛳; A. Lindsay Frazier, MD, MSc*#; Carlos A. Camargo, Jr, MD, DrPH*¶; and Graham A. Colditz, MD, DrPH*§
ABSTRACT. Objective. To examine the role of phys-ical activity, inactivity, and dietary patterns on annual weight changes among preadolescents and adolescents, taking growth and development into account.
Study Design. We studied a cohort of 6149 girls and 4620 boys from all over the United States who were 9 to 14 years old in 1996. All returned questionnaires in the fall of 1996 and a year later in 1997. Each child provided his or her current height and weight and a detailed as-sessment of typical past-year dietary intakes, physical activities, and recreational inactivities (TV, videos/VCR, and video/computer games).
Methods. Our hypotheses were that physical activity and dietary fiber intake are negatively correlated with annual changes in adiposity and that recreational inac-tivity (TV/videos/games), caloric intake, and dietary fat intake are positively correlated with annual changes in adiposity. Separately for boys and girls, we performed regression analysis of 1-year change in body mass index (BMI; kg/m2). All hypothesized factors were in the model simultaneously with several adjustment factors.
Results. Larger increases in BMI from 1996 to 1997 were among girls who reported higher caloric intakes (.0061ⴞ.0026 kg/m2per 100 kcal/day; ⴞstandard error), less physical activity (ⴚ.0284 ⴞ .0142 kg/m2/hour/day) and more time with TV/videos/games (.0372ⴞ.0106 kg/ m2/hour/day) during the year between the 2 BMI assess-ments. Larger BMI increases were among boys who re-ported more time with TV/videos/games (.0384ⴞ.0101) during the year. For both boys and girls, a larger rise in caloric intake from 1996 to 1997 predicted larger BMI increases (girls: .0059ⴞ .0027 kg/m2 per increase of 100 kcal/day; boys: .0082ⴞ.0030). No significant associations were noted for energy-adjusted dietary fat or fiber.
Conclusions. For both boys and girls, a 1-year in-crease in BMI was larger in those who reported more time with TV/videos/games during the year between the 2 BMI measurements, and in those who reported that their caloric intakes increased more from 1 year to the next. Larger year-to-year increases in BMI were also seen among girls who reported higher caloric intakes and less physical activity during the year between the 2 BMI
measurements. Although the magnitudes of these esti-mated effects were small, their cumulative effects, year after year during adolescence, would produce substantial gains in body weight. Strategies to prevent excessive caloric intakes, to decrease time with TV/videos/games, and to increase physical activity would be promising as a means to prevent obesity. Pediatrics 2000;105(4). URL: http://www.pediatrics.org/cgi/content/full/105/4/e56;
physical activity, gym class, inactivity, television, videos, video/computer games, energy intake, dietary fat, dietary fiber, body mass index, adiposity, obesity, weight change, preadolescence, adolescence, longitudinal.
ABBREVIATIONS. BMI, body mass index; SD, standard devia-tion; FFQ, youth and adolescent food frequency questionnaire; MET, metabolic equivalent.
F
rom 1980 to 1990, the prevalence of obesity in children and adolescents in the United States approximately doubled,1following a steady in-crease in adiposity during earlier decades.2– 4 This rapid increase suggests the role of environmental rather than genetic factors,5although an interaction between genes and environment could be occur-ring.5,6Childhood and adolescent obesity have been linked to higher all-cause mortality in adulthood,7–9 as well as childhood hyperlipidemia, glucose intol-erance, cholelithiasis, and hypertension.10,11 Associa-tions between adolescent blood pressure, cholesterol, and body mass index (BMI) have been reported,3,12–14 and longitudinal change in BMI was accompanied by (same direction) change in blood pressure.14 Others found strong associations between childhood body fatness and plasma lipids/blood pressures that were not explained by fitness.15
In addition to the physical health consequences, both immediate and long-term, obesity has psycho-social effects and substantial economic costs.16,17 Col-lege acceptance rates are lower for obese applicants,18 and obese women face more obstacles in the work-place.19
The tracking of adiposity in childhood is quite strong.20,21One third of obese preschool children be-come obese adults, as do half of obese school-aged children.22 Remission rates are low (⬍1% per year) and decline with age.22As summarized by Klesges et al,23because of obesity’s persistence into adulthood, its resistence to treatment, and its health conse-quences, it is critical to understand the determinants From *Channing Laboratory, Brigham & Women’s Hospital, Harvard
Med-ical School; Departments of ‡Health Policy and Management and §Epide-miology, Harvard School of Public Health;储Department of Ambulatory Care and Prevention, Harvard Medical School, Harvard Pilgrim Health Care; ¶Department of Emergency Medicine, Massachusetts General Hospi-tal; and #Department of Pediatric Oncology, Dana-Farber Cancer Institute, Boston, Massachusetts.
Received for publication Aug 6, 1999; accepted Dec 3, 1999.
of adiposity in children to learn how to prevent the childhood onset of obesity. Although the cause of obesity is complex and multifactorial, including ge-netic factors, environmental factors are clearly im-portant in its development. Excess body weight re-sults from energy intake in excess of expenditure. However, energy intake must exceed energy output in the growing child, particularly during those peri-ods of most rapid adolescent growth.5
Adolescence is a time when independence is es-tablished, and dietary and activity patterns may be adopted that are followed for many years. Thus, it has great influence on adult fatness and chronic dis-ease experiences decades later. Because both behav-iors and adiposity track into adulthood, it is impor-tant to assess the roles of modifiable behaviors (diet, physical activity, and inactivity) on adolescent adi-posity.
We describe a prospective longitudinal study of adolescent weight change over a 1-year follow-up. We limit consideration here to associations among (primarily recreational) physical activity, gym class participation, recreational inactivity (TV, videos, and video/computer games), dietary intakes (total en-ergy, dietary fat, and fiber), and adiposity changes in adolescent and preadolescent boys and girls. We un-dertook the following analysis, on population data collected from youth, to address our longitudinal hypothesis: dietary intakes, physical activities, and inactivities occurring over a year are associated with changes in body fatness during that year.
METHODS Population
Established in the fall of 1996, the ongoing Growing Up Today Study consists of 16 882 children, residing in 50 states, who are offspring of Nurses’ Health Study II participants.24The Growing
Up Today Study was designed to assess prospectively the deter-minants of adolescent weight changes, including dietary intake, physical activity, and inactivity.
Letters were sent in 1996 to mothers of children, in the 9- to 14-year age range, explaining the goals of the new study and requesting consent for their children to participate. Approxi-mately 18 526 mothers returned the consent form, providing the name, age, gender, and mailing address of 26 765 children. Intro-ductory letters and gender-specific questionnaires were then mailed directly to children whose mothers had granted consent. These letters assured potential participants that the information they provided would be confidential. The baseline (1996) sample included 9039 girls (68% response rate) and 7843 boys (58% re-sponse rate) who returned completed questionnaires, thereby as-senting to participate. Some of these respondents were outside the 9- to 14-year age range at the time of questionnaire completion, leaving us with 8980 girls and 7791 boys at baseline. A year later (fall 1997), they were mailed follow-up questionnaires to update all information. These were returned by 7299 girls and 5653 boys. The sample for analysis, to be described later, is smaller because of exclusions and missing values on 1 or more important variables.
Measures Adiposity
We assessed adiposity by computing BMI (BMI ⫽ weight/ height2[kg/m2]) from the heights and weights reported by the
children in 1996 and 1997. Our questionnaire provided specific instructions for measuring height and weight but suggested ask-ing someone to help. Annual change in adiposity was measured by 1-year change in BMI, BMI1997⫺BMI1996, adjusted for the time
lag (not always exactly 12 months) between the 2 returned ques-tionnaires. Shannon et al25reported high validity of self-reported
heights and weights in sixth graders (boys’ weight:r⫽.90, height:
r⫽.74; girls’ weight:r⫽.84, height:r⫽.62). Preliminary results from pilot studies among girls 10 to 17 years old suggested even higher validity (r⫽.98 for weight,r⫽.73 for height, andr⫽.89 for BMI). Data from Strauss26showed that self-reported heights
and weights were extremely reliable for studying issues related to obesity in children 12 to 16 years old.
We excluded any height that was⬎3 standard deviations (SDs) beyond the gender- and age-specific mean height (1996: 41 girls and 59 boys; 1997: 17 girls and 17 boys), and consecutive annual heights if height declined by⬎1 inch or increased by⬎8 inches (mean change⫹3 SD) between 1996 and 1997 (125 girls and 73 boys). We excluded any BMI⬍12 kg/m2as a biological lower limit
(clinical opinion), and any BMI⬎3 SD beyond the gender- and age-specific mean (in the log scale, because the distribution of BMI was skewed toward larger values; 1996: 87 girls and 56 boys; 1997: 56 girls and 51 boys). Consecutive BMIs were excluded if they produced an annual change⬎3 SD beyond the mean change (not log scale because BMI changes were not skewed; 77 girls and 37 boys).
Dietary Intakes
Members of our group designed a self-administered, semiquan-titative food frequency questionnaire (FFQ) specifically for older children and adolescents that is inexpensive and easy to admin-ister to large populations.27This FFQ for youth and adolescents
has been shown to be valid (r⫽.54 for comparing the FFQ with 3 24-hour recalls28) and reproducible.27 This is similar in
perfor-mance to the FFQ in adults.27
The FFQ included questions regarding usual frequency of in-take of 132 specific food items over the past year. Questions differentiated fat content of relevant food items (milk and other dairy products, fried food, salad dressing, and fat and skin on meat). Using nutrient composition databases, assuming food por-tion sizes specific to our age range and each child’s reported intake of each food, we estimated total caloric intake (kcal/day), total fat intake (g/day) and total Association of Official Analytical Chem-ists dietary fiber intake (g/day). Fat and fiber intakes were then energy-adjusted using the method of Willett.29We excluded as
implausible energy intakes ⬍500 kcal/day or ⬎5000 kcal/day (1996: 35 girls and 53 boys; 1997: 26 girls and 45 boys).
Physical Activity
We developed a physical activity questionnaire, specifically for youth, that asked them to recall the typical amount of time spent, over the past year, in various activities and team sports. Questions included, for 17 separate sports and other activities (like hard work outdoors and walking), how many hours per week they typically did them (outside of gym class in school). From each child’s responses, we computed his or her hours of physical ac-tivity (outside of gym class) per week. Assessments of this instru-ment found that estimates of total physical activity were moder-ately reproducible (r⫽.49 for girls;r⫽.53 for boys) and were reasonably correlated with cardiorespiratory fitness (total activity hours with time to complete 1-mile run:r⫽ ⫺.23 for girls;r⫽ ⫺.27 for boys), thus providing evidence of validity.30 –32
We were unable to ascertain details of varying intensity (within sport), or duration per session of activity, which may be related to obesity.33However, we assigned a metabolic equivalent (MET),
based on a compendium by Ainsworth et al,34 to individual
sports/activities and estimated a total MET per week for each child.
The children reported separately on the number of gym or physical education classes in school they were currently partici-pating in per week.
We excluded from analyses those estimates of activity that exceeded 40 hours/week (1996: 398 girls and 537 boys; 1997: 223 girls and 312 boys).
TV/Videos/Games
were excluded as unreliable (1996: 57 girls and 164 boys; 1997: 34 girls and 89 boys).
Other Measures
Children also reported at baseline their race/ethnic group by marking all that apply (6 choices available). We assigned each child to a race/ethnic group following US Census definitions, except we retained Asians as a separate group rather than pooled with other).1,35In 1996 and 1997, children reported their Tanner
maturation stage (5 categories for stage of pubic hair develop-ment) and whether girls’ menstrual periods had yet begun. Self-ratings of sexual maturity in adolescent girls have been validat-ed.36For girls, we derived a menstrual history variable having 3
categories: premenarche in both 1996 and 1997, periods began between 1996 and 1997, and postmenarche at baseline. We com-puted each child’s age from his or her birthdate and the date when the questionnaire was returned to us.
Sample for Analysis
Beyond the exclusions outlined in the above sections, there were some missing data on the factors of primary interest (activ-ity, inactiv(activ-ity, and diet) and also on covariates adjusted for in the analysis (Tanner stage, menarche status, and race). This left us with 6149 girls and 4620 boys providing data for the analysis of change in BMI from 1996 to 1997.
Statistical Analysis
All analyses were performed separately by gender. We com-pared the baseline (1996) values, of those children who returned with those who did not return the 1997 questionnaire, to assess the potential for bias in our sample for the analysis of 1-year change in BMI.
To estimate the effects of diet, activity, and inactivity on annual changes in adiposity, we used linear regression models with 1-year change in BMI as the continuous outcome variable; it was approximately normally distributed. All models controlled for race/ethnic group, baseline BMI, annual change in height (to adjust for the increased energy needs of the growing child5),
menstrual history in girls, Tanner stage, and age, to adjust for changes in BMI that occur because of growth and maturation.37– 43
The 6 factors of primary interest, which we entered simulta-neously in all models, were total energy intake, fat intake (energy-adjusted), fiber intake (energy-(energy-adjusted), number of gym classes per week in school, hours of physical activity, and hours of TV/ videos/games. To assess the timing of these factors, relative to their effects on BMI change from 1996 to 1997, we fit 4 separate versions of the model. One model used diet and activity during the year before the first BMI (recalled in 1996), whereas another used diet and activity during the year between the 2 BMIs (re-called in 1997). A third model used the means over 2 years of each diet and activity variable, and a fourth model used the year-to-year change in diet and activity.
It is possible that the most relevant period may be different for
each factor. For example, the best predictors of change in BMI from 1996 to 1997 could conceivably be a change in activity from 1 year to the next, the number of gym classes per week reported in the fall of 1996, and caloric intake in the year between the 2 BMIs. As an exploratory analysis of this issue, we used stepwise regres-sion, including as potential predictors all 6 variables recorded in the fall of 1996, in 1997, their 2-year means, and changes from 1996 to 1997. We further allowed METs per week (1996 METs, 1997 METs, mean METs, and change in METs) to enter these stepwise models.
Because each child provided to this analysis only 1 annual change in BMI, ordinary linear regression models were appropri-ate. However, we refit the models, taking into account correlations among the small numbers of siblings of the same gender, to confirm that estimates were not materially different. We used generalized estimating equations44and SAS Proc Genmod (SAS
Institute, Cary, NC)45to take these correlations into account. We
also confirmed that our assumption of linear associations between annual BMI changes and the diet and activity variables were reasonable by replicating our analysis using quintile categories for each factor.
RESULTS
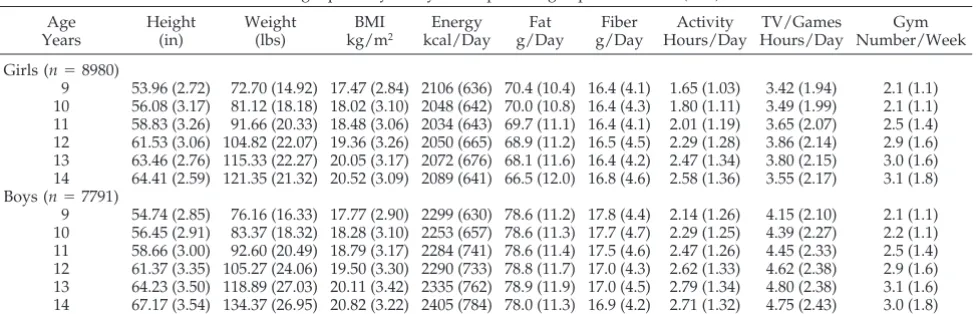
In our cohort, 94.7% were white (not Hispanic), .9% were black (not Hispanic), 1.5% were Hispanic, 1.5% Asian, and 1.4% other (including Native Amer-ican). This reflects the minority representation of their mothers who are all nurses and participants in the Nurses’ Health Study II.24Table 1 presents base-line gender- and age-specific summaries of anthro-pometric measurements and the 6 factors of interest, for 8980 girls and 7791 boys. At baseline, .3% of 9-year-old girls had begun menstrual cycles, 2.4% of 10-year-olds, 11.6% of 11-year-olds, 36.5% of 12-year-olds, 69.4% of 13-year-12-year-olds, and 89.4% of 14-year-old girls.
Using the baseline (1996) data, we compared those children who did not return questionnaires in 1997 with those who did, to assess possible follow-up bias. The 2 groups were comparable on 1996 BMI (age-adjusted), total energy intake, dietary fat intake, dietary fiber intake, and number of gym classes per week. Thus, there do not seem to be biases related to dietary intakes or adiposity. However, those not re-turning the 1997 questionnnaire were older (girls: 12.20 vs 11.98,P⬍.05; boys: 12.18 vs 11.86,P⬍.05), were more physically active (girls: by .11 hours/day [age-adjusted],P⬍.05; boys: by .06 hours/day
[age-TABLE 1. Baseline Values for Growing Up Today Study Participants: Age-Specific Means (SDs) Age Years Height (in) Weight (lbs) BMI kg/m2 Energy kcal/Day Fat g/Day Fiber g/Day Activity Hours/Day TV/Games Hours/Day Gym Number/Week
Girls (n⫽8980)
9 53.96 (2.72) 72.70 (14.92) 17.47 (2.84) 2106 (636) 70.4 (10.4) 16.4 (4.1) 1.65 (1.03) 3.42 (1.94) 2.1 (1.1) 10 56.08 (3.17) 81.12 (18.18) 18.02 (3.10) 2048 (642) 70.0 (10.8) 16.4 (4.3) 1.80 (1.11) 3.49 (1.99) 2.1 (1.1) 11 58.83 (3.26) 91.66 (20.33) 18.48 (3.06) 2034 (643) 69.7 (11.1) 16.4 (4.1) 2.01 (1.19) 3.65 (2.07) 2.5 (1.4) 12 61.53 (3.06) 104.82 (22.07) 19.36 (3.26) 2050 (665) 68.9 (11.2) 16.5 (4.5) 2.29 (1.28) 3.86 (2.14) 2.9 (1.6) 13 63.46 (2.76) 115.33 (22.27) 20.05 (3.17) 2072 (676) 68.1 (11.6) 16.4 (4.2) 2.47 (1.34) 3.80 (2.15) 3.0 (1.6) 14 64.41 (2.59) 121.35 (21.32) 20.52 (3.09) 2089 (641) 66.5 (12.0) 16.8 (4.6) 2.58 (1.36) 3.55 (2.17) 3.1 (1.8) Boys (n⫽7791)
9 54.74 (2.85) 76.16 (16.33) 17.77 (2.90) 2299 (630) 78.6 (11.2) 17.8 (4.4) 2.14 (1.26) 4.15 (2.10) 2.1 (1.1) 10 56.45 (2.91) 83.37 (18.32) 18.28 (3.10) 2253 (657) 78.6 (11.3) 17.7 (4.7) 2.29 (1.25) 4.39 (2.27) 2.2 (1.1) 11 58.66 (3.00) 92.60 (20.49) 18.79 (3.17) 2284 (741) 78.6 (11.4) 17.5 (4.6) 2.47 (1.26) 4.45 (2.33) 2.5 (1.4) 12 61.37 (3.35) 105.27 (24.06) 19.50 (3.30) 2290 (733) 78.8 (11.7) 17.0 (4.3) 2.62 (1.33) 4.62 (2.38) 2.9 (1.6) 13 64.23 (3.50) 118.89 (27.03) 20.11 (3.42) 2335 (762) 78.9 (11.9) 17.0 (4.5) 2.79 (1.34) 4.80 (2.38) 3.1 (1.6) 14 67.17 (3.54) 134.37 (26.95) 20.82 (3.22) 2405 (784) 78.0 (11.3) 16.9 (4.2) 2.71 (1.32) 4.75 (2.43) 3.0 (1.8)
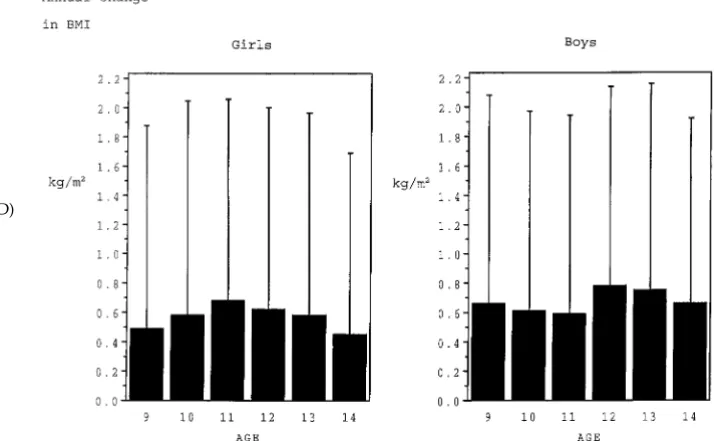
adjusted];P ⫽ .06), and spent more time with TV/ videos/games (girls and boys: by .3 hours/day [age-adjusted],P⬍.05), but these differences were small. Figure 1 presents the mean annual changes (⫹1 SD) in BMI (kg/m2) by baseline age group. Girls who were 11 years old at baseline, and boys who were 12 years old, had the largest mean annual increase in BMI. Regarding growth and development, the larg-est mean increase in height occurred in girls who were 10 years old, and in boys 12 years old, at baseline. Onset of menses occurred most frequently in girls 12 years old at baseline.
Table 2 shows the linear regression model coeffi-cients for predicting 1-year change in BMI (from 1996 to 1997), adjusting for race, menarche history (girls), annual height growth, baseline BMI, age, and Tanner stage. The model on the far right of Table 2 corre-sponds to the test of our longitudinal hypothesis (1-year change in BMI is associated with the child’s diet and activity between the 2 BMI measurements). Annual BMI increases were higher in girls with higher caloric intakes (BMI increased by .0061 kg/m2 per 100 kcal/day;P ⬍ .02), more hours of TV/vid-eos/games (BMI increased by .0372 kg/m2/hour/ day; P ⬍ .001), and fewer hours of activity (BMI decreased by .0284 kg/m2/hour/day of activity;P⬍ .05) during the year between the 2 BMI measure-ments. Energy-adjusted fat and fiber intakes and number of gym classes per week were not predictive. Variations on our hypothesized model appear in the first 3 columns of Table 2. The first model tests whether diet and activity before measurement of the initial BMI are associated with subsequent change in BMI. The second model looks at the means over 2 years of each diet and activity variable, and the third model looks at year-to-year change in each diet and activity variable. For girls, estimates from these other 3 models suggested weaker effects than the model that evaluated our hypothesis. However, a larger increase in caloric intake (from the year before the initial BMI to the year after; column 3) was associated
(.0059 kg/m2 per 1-year increase of 100 kcal/day;
P ⬍ .03) with a larger increase in BMI, and an in-crease in physical activity (from the year before the initial BMI to the year after) was marginally associ-ated (⫺.0262 kg/m2/hour/day increase in activity;
P⫽.054) with an annual BMI decline. Although the 4 modelR2are very close together, the model corre-sponding to our hypothesis (right column in Table 2) had the highestR2⫽.19.
For boys, the model corresponding to our longitu-dinal hypothesis (Table 2, boys, right column; model
R2 ⫽ .17) showed that annual BMI increases were higher among boys who, in the year between the 2 BMIs, spent more time with TV/videos/games (.0384 kg/m2/daily hour;P⬍.0001) and, marginally, had less physical activity (⫺.0261 kg/m2/hour of activity;P⫽.094). Caloric intake, energy-adjusted fat and fiber intakes (during the year between the 2 BMI measurements), and number of gym classes per week (at time of second BMI measurement) were not associated (P ⬎.10) with change in BMI.
As in girls, a larger rise in caloric intake from 1 year to the next was associated with a larger increase in BMI (.0082 kg/m2/100 kcal/day increase,P⬍.01; Table 2, boys, column 3). In the first model (column 1), more gym class time reported for the 1996 –1997 school-year was associated with smaller BMI in-creases from 1996 to 1997 (.03 kg/m2decline in BMI per additional gym class each week;P⬍.03). But an increase in number of weekly gym classes (from fall 1996 to fall 1997) was associated with an increase in BMI for boys (Table 2 column 3).
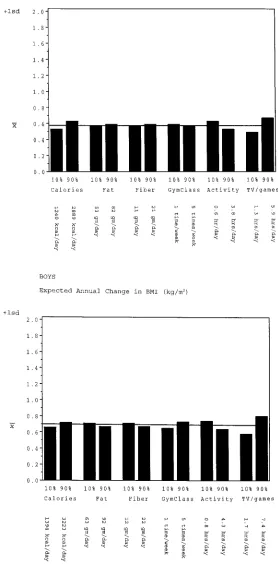
To illustrate the magnitude of the estimated effects of diet and activity, we hold constant (in the model on the far right of Table 2) the adjustment variables and the remaining 5 factors. Figure 2 shows the expected annual change in BMI for girls and boys with extreme values (10th percentile and 90th per-centile) of each factor. Although the significant ef-fects were each in the directions we hypothesized, their magnitudes appear relatively small. But if these
effects are repeated year after year (.2 kg/m2increase in BMI per year for TV/videos/games), they cumu-late to clinically significant effects on adiposity (1 kg/m2after 5 years).
We next performed an exploratory stepwise anal-ysis that included all the adjustment variables but allowed the data to suggest which time period for each of the dietary and activity variables best pre-dicted 1-year change in BMI. We further allowed the inclusion of METs to reflect the intensities of the various physical activities. For girls, the factors that were selected by the algorithm were the same 3 that were significant in the Table 2 model on the right: calories, activity, and TV/videos/games between the 2 BMI measurements. For boys, higher mean (over 2years) hours of TV/videos/games, gym class par-ticipation that increased more from the first to the second year, and caloric intake that increased more from the first to the second year predicted larger increases in BMI. Boys with higher METs during the year between the 2 BMIs had marginally smaller (P⫽ .06) increases in BMI.
To see if there was effect modification by age, we used interaction terms that indicated younger (9 to 11 years old) or older (12 to 14 years old) age at baseline. In younger girls, the effects on change in adiposity by activity (⫺.0755 ⫾ .0209), TV/videos/ games (.0747 ⫾ .0150), and gym class (⫺.0451 ⫾ .0182) were all significantly stronger than in the older girls. Among boys under 12 years old, those with more physical activity in the year between the BMI measurements had smaller annual increases in BMI (⫺.0746⫾ .0212).
DISCUSSION
Currently, there are few effective treatments to reduce weight and maintain the loss among over-weight individuals. Therefore, intentional over-weight losses are rarely sustained. The Council on Scientific Affairs from the American Medical Association
sup-ports prevention as the treatment of choice for adults. For weight loss, they support a nutritionally balanced, low-energy diet while increasing energy expenditure through regular physical exercise.46 Sim-ilar recommendations have been put forth for chil-dren.47But modifying dietary, activity, and inactivity patterns is difficult after lifelong habits are estab-lished. Even with only 1 year of follow-up on our cohort, we note that year-to-year activity and inac-tivity are more stable in the older girls than the younger girls; thus, their habits are already becom-ing established.
Our ongoing longitudinal study of ⬎10 000 boys and girls from all over the United States showed that boys and girls who spent more time viewing televi-sion and videos and playing video/computer games during a year had larger increases in BMI, as did those who increased their caloric intake more from the previous year. For girls, physical activity and caloric intakes during the year were also associated with change in BMI. For younger boys, physical ac-tivity between the BMI measurements was inversely associated with change in BMI. There was some ev-idence, for boys and younger girls, that more fre-quent gym classes in school were associated with smaller increases in BMI, but this evidence should be viewed with caution because of the potential for bias because gym class is optional for some students. Finally, we found no evidence that energy-adjusted fat or fiber intakes were associated with changes in BMI, for either girls or boys.
Although our assessment of body fatness, using only height and weight, was crude, more reliable body composition techniques33were not feasible in a large cohort of self-reporting children. Detailed stud-ies of indices that use weight and height suggested that BMI is the better measure of adiposity at all childhood ages.48 –53We needed a measure that has a high correlation with body fatness, more importantly than a low correlation with height. A frequent
criti-TABLE 2. Linear Regression Model Coefficients, With Standard Errors andPValues for Predicting One-Year Change in BMI (kg/m2)
in Girls and Boys
Factor One-Year Change in BMI Predicted by Diet and Activity
In Year Before Initial BMI
Mean Over Two Years
Year-to-Year Change In the Year Between the Two BMIs
(Standard Error [])
P (Standard Error [])
P (Standard Error [])
P (Standard Error [])
P
Girls
Calories (100 kcal/d) ⫹.0028 (.0026) .293 ⫹.0056 (.0029) .053 ⫹.0059 (.0027) .028 .0061 (.0026) .016 Fat (g/d) ⫹.0012 (.0015) .421 ⫹.0011 (.0018) .537 ⫹.0004 (.0016) .792 ⫹.0008 (.0016) .632 Fiber (g/d) ⫹.0023 (.0041) .577 ⫹.0026 (.0048) .582 ⫺.0031 (.0043) .465 ⫹.0011 (.0043) .799 Gym classes (number/wk) ⫺.0056 (.0111) .615 ⫺.0082 (.0123) .508 ⫺.0088 (.0094) .352 ⫺.0067 (.0098) .496 Activity (excluding gym, h/d) ⫺.0100 (.0137) .469 ⫺.0229 (.0157) .144 ⫺.0262 (.0136) .054 ⫺.0284 (.0142) .046 TV/video/games (h/d) ⫹.0193 (.0081) .018 ⫹.0380 (.0106) .001 ⫹.0053 (.0083) .526 ⫹.0372 (.0106) .001 Boys
Calories (100 kcal/d) ⫺.0038 (.0028) .178 ⫹.0013 (.0031) .661 ⫹.0082 (.0030) .006 .0032 (.0028) .249 Fat (g/d) ⫺.0018 (.0018) .296 ⫺.0017 (.0019) .377 ⫹.0010 (.0018) .577 ⫺.0015 (.0017) .375 Fiber (g/d) ⫺.0059 (.0045) .186 ⫺.0045 (.0051) .373 ⫹.0025 (.0049) .610 ⫺.0046 (.0047) .320 Gym classes (number/wk) ⫺.0300 (.0133) .025 ⫺.0031 (.0147) .830 ⫹.0407 (.0119) .001 ⫹.0185 (.0121) .128 Activity (excluding gym, h/d) ⫺.0090 (.0151) .550 ⫺.0188 (.0170) .267 ⫺.0113 (.0149) .448 ⫺.0261 (.0156) .094 TV/videos/games (h/d) ⫹.0265 (.0085) .002 ⫹.0425 (.0104) .001 ⫺.0019 (.0086) .830 ⫹.0384 (.0101) .001
cism of BMI is that it is correlated with height, but body fatness (by more reliable techniques) is posi-tively correlated with height.10,51,54
Our analysis of annual change in BMI, a continu-ous variable, had the advantage of avoiding arbitrary cut-points to define obesity. Thus, we have avoided misclassification of obesity that would arise if there
were systematic bias in self-reported height or weight.55And we have examined relative weight loss and gain within the whole range of adiposity, from very underweight to very overweight.
Measuring dietary intakes of children is very dif-ficult and fraught with problems.33 By 10 years old, children are able to give accurate dietary information
and are well aware of the foods they have eaten.56 Rockett et al28 presented evidence that the accuracy of our FFQ did not vary according to the BMI or age of the child. Food frequency questionnaires provide enough accuracy in studies of adolescents to permit individual diets to be related to subsequent health outcomes.57We focused our analysis on total energy intake and (energy-adjusted) dietary fat and fiber intakes because of evidence that they have special roles in obesity. At mealtime, fat is less satiating than carbohydrate,58 – 60 and dietary fat is stored more ef-ficiently than carbohydrate or protein.61In contrast, a high fiber diet should be greater in volume and more satiating at mealtime.58 In the United States, diets high in fat tend to be low in fruits and vegetables and complex carbohydrates.62
Most physical activity in children takes place in organized programs outside of school.63Our instru-ment assesses mostly recreational activity rather than approximating total energy expenditure. Recre-ational activity and inactivity patterns are modifiable and could be the object of public health policies.64
Our findings are consistent with a growing body of evidence that among children and adolescents, physical activity and inactivity (particularly TV viewing) are associated with body fatness.2,23,38,63,65–74 Data collection in some of these studies occured even before the advent of VCRs and video/computer games in the home—inactivities that now contribute significantly to our children’s lifestyles. But the pos-itive association between TV viewing and adiposity has not been confirmed by all studies.36,75The role of inactivity in obesity may be even beyond the fewer calories expended; television advertising tends to push foods that are energy-dense and nutrient-poor.58 Children request foods that are more fre-quently advertised on TV, and TV viewing is corre-lated with caloric intake.76
In a 3-year longitudinal study of obesity in 146 preschool children, Klesges et al23 found that high dietary fat intake (total fat energy) was associated with greater increase in BMI. Increasing caloric in-take by as little as 150 calories per day above the number of calories needed for weight maintenance would result in a substantial weight gain over a year.5Efficiency of metabolism of energy intake var-ies among individuals. There are no significant dif-ferences in the metabolic requirements of lean and obese individuals to maintain their body weight,5but a formerly obese adult requires fewer calories to maintain body weight than a never-obese person of the same body weight.77 Perhaps these findings ap-ply to children also.
Other investigators review behavioral, social, and environmental factors that influence energy intake and expenditure and physical activity.58,78
A major strength of our analysis was the longitu-dinal design, which allowed us to study changes over 1 year in adiposity. A cross-sectional study of BMI measured at 1 time-point would be limited be-cause excess adiposity in a child may be attributable to the effects of poor dietary and activity patterns cumulating over years before data collection. A lim-itation of our study was the necessity to collect data
on children and adolescents by self-report on mail-return questionnaires. With our very large cohort, alternatives were not feasible. We considered our model R2 (for predicting annual changes in BMI) approaching .20 quite good, considering that BMI change is a composite of 4 measurements (heights and weights each measured twice), self-reported by children. This represents a correlation of .44 between the model-predicted changes in BMI and the ob-served changes.
The results of this study provide evidence that, in older children and adolescents, energy intake, phys-ical activity, and recreational inactivity are associ-ated with changes in body fatness, but that dietary fat and fiber are not (aside from their energy con-tent). Attempts by pediatricians to modify each of several factors a little, rather than modifying a single factor (activity, TV/videos/games, or energy intake) a lot, might be more successful in individual patients. To prevent excessive annual increases in body fat-ness in children, public health strategies to reduce recreational inactivity (TV, videos, and video/com-puter games), to increase recreational physical activ-ity, and to reduce excess caloric intake may be prom-ising.
ACKNOWLEDGMENTS
This research was funded by Grant DK46834 from the National Institutes of Health and, in part, by Kelloggs.
Other members of the Growing Up Today Study research group who contributed were Gary Chase, Karen Corsano, Cathe-rine Tomeo, Sheryl Rifas-Shiman, Morgan Ford, and Gideon Aweh.
We thank the children (and their mothers) for careful comple-tion of the quescomple-tionnaires.
REFERENCES
1. Troiano RP, Flegal KM. Overweight children and adolescents: descrip-tion, epidemiology, and demographics. Pediatrics. 1998;101(suppl): 497–504
2. Shear CL, Freedman DS, Burke GL, Harsha DW, Webber LS, Berenson GS. Secular trends of obesity in early life: the Bogalusa Heart Study. Am J Public Health. 1988;78:75–77
3. Gortmaker SL, Dietz WH Jr, Sobol AM, Wehler CA. Increasing pediatric obesity in the US.Am J Dis Child. 1987;141:535–540
4. Pate RR, Ross JG, Dotson CO, Gilbert GG. The National Children and Youth Fitness study, the new norms: a comparison with the 1980 AAHPERD norms.J Phys Educ Recreation Dance. 1985;1:28 –30 5. Rosenbaum M, Leibel RL. The physiology of body weight regulation:
relevance to the etiology of obesity in children. Pediatrics. 1998; 101(suppl):525–539
6. Jacobson KC, Rowe DC. Genetic and shared environmental influences on adolescent BMI: interactions with race and sex.Behav Genet. 1998;28: 265–278
7. Nieto FJ, Szklo M, Comstock GW. Childhood weight and growth rate as predictors of adult mortality.Am J Epidemiol. 1992;136:201–213 8. Must A, Jacques PF, Dallal GE, et al. Long-term morbidity and mortality
of overweight adolescents: a follow-up of the Harvard Growth Study of 1922 to 1935.N Engl J Med. 1992;327:1350 –1355
9. Gunnell DJ, Frankel SJ, Nanchahal K, Peters TJ, Davey Smith G. Child-hood obesity and adult cardiovascular mortality.Am J Clin Nutr. 1998; 67:1111–1118
10. Dietz WH. Health consequences of obesity in youth: childhood predic-tors of adult disease.Pediatrics. 1998;101:518 –525
11. Freedman DS, Dietz WH, Srinivasan SR, Berenson GS. The relation of overweight to cardiovascular risk factors among children and adolescents: the Bogalusa Heart Study.Pediatrics. 1999;103:1175–1182 12. Sangi H, Mueller WH. Which measures of body fat distribution is best
for epdemiologic research among adolescents?Am J Epidemiol. 1991;133: 870 – 883
end-point rather than population distribution.Int J Obes Relat Metab Disord. 1996;20:472– 480
14. Berkey C, Gardner J, Colditz G. Blood pressure in adolescence and early adulthood related to obesity and birth size.Obes Res. 1998;6:187–195 15. Dwyer T, Gibbons LE. The Australian Schools Health and Fitness
Survey: physical fitness related to blood pressure but no lipoproteins. Circulation. 1994;89:1559 –1644
16. Gortmaker SL, Must A, Perrin JM, et al. Social and economic conse-quences of overweight in adolescence and young adulthood.N Engl J Med. 1993;329:1008 –1012
17. Wolf AM, Colditz GA. The cost of obesity: the US perspective. Phar-macoEconomics. 1994;5:34 –37
18. Canning H, Mayer J. Obesity—its possible effect on college acceptance. N Engl J Med. 1966;275:1172–1174
19. Roe D, Eickwort K. Relationships between obesity and associated health factors with unemployment among low income women.J Am Med Womens Assoc. 1976;31:193–204
20. Marshall SJ, Sarkin JA, Sallis SF, McKenzie TL. Tracking of health-related fitness components in youth ages 9 to 12.Med Sci Sports Exerc. 1998;30:910 –916
21. Whitaker RC, Wright JA, Pepe MS, Seidel KD, Dietz WH. Predicting obesity in young adulthood from childhood and parental obesity. N Engl J Med. 1997;337:869 – 873
22. Serdula MK, Ivery D, Coates RJ, Freedman DS, Williamson DF, Byers T. Do obese children become obese adults? A review of the literature.Prev Med. 1993;22:167–177
23. Klesges RC, Klesges LM, Eck LH, Shelton ML. A longitudinal analysis of accelerated weight gain in preschool children.Pediatrics. 1995;95: 126 –132
24. Rich-Edwards J, Goldman MB, Willett WC, et al. Adolescent body mass index and ovulatory infertility.Am J Obstet Gynecol. 1994;171:171–177 25. Shannon B, Smiciklas-Wright H, Wang MQ. Inaccuracies in
self-reported weights and heights of a sample of sixth-grade children.J Am Diet Assoc. 1991;91:675– 678
26. Strauss RS. Comparison of measured and self-reported weight and height in a cross-sectional sample of young adolescents.Int J Obes Relat Metab Disord. 1999;23:904 –908
27. Rockett HRH, Wolf AM, Colditz GA. Development and reproducibility of a food frequency questionnaire to assess diets of older children and adolescents.J Am Diet Assoc. 1995;:95:336 –340
28. Rockett HRH, Breitenbach M, Frazier AL, et al. Validation of a Youth/ Adolescent Food Frequency Questionnaire.Prev Med. 1997;26:808 – 816 29. Willett WC.Nutritional Epidemiology. New York, NY: Oxford University
Press; 1990
30. Tomeo CA, Field AE, Hazlett EE, et al. Reproducibilty and validity of a self-administered physical activity instrument for adolescents. Submit-ted
31. Peterson KE, Field AE, Fox MK, et al. Validation of the Youth Risk Behavioral Surveillance System (YRBSS) Questions on Dietary Behaviors and Physical Activity Among Adolescents in Grades 9 Through 12. Boston, MA: Harvard School of Public Health, Division of School and Adolescent Health at the Centers for Disease Control and Prevention; 1996 32. Field AE, Colditz GA, Fox MK, Bosch RJ, Peterson KE. Comparison of
the assessment of vigorous physical activity on the youth risk behavior surveillance system and the youth/adolescent activity questionnaire. Submitted
33. Goran MI. Measurement issues related to studies of childhood obesity: assessment of body composition, body fat distribution, physical activ-ity, and food intake.Pediatrics. 1998;101(suppl):505–518
34. Ainsworth BE, Haskell WL, Leon AS, et al. Compendium of physical activities: classification of energy costs of human physcial activities.Med Sci Sports Exerc. 1993;25:71– 80
35. The National Heart, Lung, and Blood Institute Growth and Health Study Research Group. Obesity and cardiovascular disease risk factors in black and white girls: the NHLBI growth and health study.Am J Public Health. 1992;82:1613–1620
36. Robinson TN, Hammer LD, Killen JD, et al. Does television viewing increase obesity and reduce physical activity? Cross-sectional and lon-gitudinal analyses among adolescent girls.Pediatrics. 1993;91:273–280 37. Siervogel RM, Roche AF, Guo S, Mukherjee D, Chumlea WC. Patterns
of change in weight/stature2from 2 to 18 years: findings from
long-term serial data for children in the Fels Longitudinal Growth Study.Int J Obes. 1991;15:479 – 485
38. Malina RM. Physical activity: relationship to growth, maturation, and physical fitness. In: Bouchard C, Shephard RJ, Stephens T, eds.Physical Activity, Fitness, and Health, International Proceedings and Concensus State-ment. Champain, IL: Human Kinetics; 1994:918 –930
39. Tanner JM. Use and abuse of growth standards. In: Falkner F, Tanner
JM, eds.Human Growth, III. London, UK: Plenum Press; 1986 40. Buckler JMH. Weight/height relationships through adolescence: a
lon-gitudinal study. In: Tanner JM, ed.Auxology 88: Perspectives in the Science of Growth and Development. London, UK: Smith-Gordon; 1989:373–378 41. Garn SM, Clark DC. Trends in fatness and the origins of obesity.
Pediatrics. 1976;57:443– 456
42. Casey VA, Dwyer JT, Coleman KA, Valadian I. Body mass index from childhod to middle age: a 50 year follow-up.Am J Clin Nutr. 1992;56: 14 –18
43. Cronk CE, Roche AF, Kent R, et al. Longitudinal trends and continuity in weight/stature2from 3 months to 18 years.Hum Biol. 1982;54:729 –749
44. Liang K-Y, Zeger SL. Longitudinal data analysis using generalized linear models.Biometrika. 1986;73:13–22
45. SAS Institute Inc.Changes and Enhancements Through Release 6.12. Cary, NC: SAS Institute Inc; 1997:1167
46. Council on Scientific Affairs. Treatment of obesity in adults.JAMA. 1988;260:2547–2551
47. Barlow SE, Dietz WH. Obesity evaluation and treatment: expert com-mittee recommendations. Pediatrics. 1998;102(3). URL: http:// www.pediatrics.org/cgi/content/full/102/3/e29
48. Cole TJ. Weight-stature indicies to measure underweight, overweight, and obesity. In: Himes JH, ed.Anthropometric Assessment of Nutritional Status. New York, NY: Wiley-Liss; 1991:83–111
49. Pietrobelli A, Faith MS, Allison DB, Gallagher D, Chiumello G, Heyms-field SB. Body mass index as a measure of adiposity among children and adolescents: a validation study.J Pediatr. 1998;132:204 –210 50. Michielutte R, Diseker RA, Corbett WT, Schey HM, Ureda JR. The
relationship between weight-height indices and the triceps skinfold measure among children age 5 to 12.Am J Public Health. 1984;74: 604 – 606
51. Killeen J, Vanderburg D, Harlan WR. Application of weight-height ratios and body indices to juvenile populations—the National Health Examination Survey Data.J Chronic Dis. 1978;31:529 –537
52. Schey HM, Michielutte R, Corbett WT, Diseker RA, Ureda JR. Weight for height indices as measures of adiposity in children.J Chronic Dis. 1984;37:397– 400
53. Roche AF, Siervogel RM, Chumlea WC, Webb P. Grading body fatness from limited anthropometric data.Am J Clin Nutr. 1981;34:2831–2838 54. Himes JH, Roche AF. Subcutaneous fatness and stature: relationship
from infancy to adulthood.Hum Biol. 1986;58:737–750
55. Giacchi M, Mattei R, Rossi S. Correction of the self-reported BMI in a teenage population.Int J Obes Relat Metab Disord. 1998;22:673– 677 56. Baranowski T, Domel S. A cognitive model of child’s reporting of food
intake.Am J Clin Nutr. 1994;59:2125–2175
57. Rockett HRH and Colditz. Assessing diets of children and adolescents. Am J Clin Nutr. 1997;65(suppl):1116S–1122S
58. Birch LL, Fisher JO. Development of eating behaviors among children and adolescents.Pediatrics. 1998;101:539 –549
59. Rolls BJ, Kim-Harris S, Fischman MW, Foltin RW, Moran TH, Stoner SA. Satiety after preloads with different amounts of fat and carbohydrate: implications for obesity.Am J Clin Nutr. 1994;60:476 – 487 60. Blundell JE, Burley VJ, Cotton JR, Lawton CL. Dietary fat and the control of energy intake: evaluating the effects of fat on meal size and postmeal satiety.Am J Clin Nutr. 1993;57:772S–778S
61. Poppitt SD. Energy density of diets and obesity.Int J Obes. 1995;19: S20 –S26
62. Subar AF, Ziegler RG, Patterson BH, Ursin G, Graubard B. US dietary patterns associated with fat intake: the 1987 national health interview survey.Am J Public Health. 1994;84:359 –366
63. Ross JG, Dotson CO, Gilbert GG, Katz SJ. After physical education— physical activity outside of school physical education programs.J Phys Educ Recreation Dance. 1985;56:35–39
64. James WP. A public health approach to the problem of obesity.Int J Obes Relat Metab Disord. 1995;19:S37–S45
65. Davies PSW, Gregory J, White A. Physical activity and body fatness in pre-school children.Int J Obes. 1995;19:6 –10
66. Ross JG, Pate RR. The National Children and Youth Fitness Study II: a summary of findings.J Phys Educ Recreation Dance. 1987;58:51–56 67. Dietz WH, Gortmaker SL. Do we fatten our children at the television
set? Obesity and television viewing in children and adolescents. Pedi-atrics. 1985;75:807– 812
68. Pate RR, Dowda M, Ross JG. Associations between physical activity and physical fitness in American children.Am J Dis Child. 1990;144: 1123–1129
69. Berkowitz RI, Agras WS, Korner AF, Kraemer HC, Zeanah CH. Physical activity and adiposity: a longitudinal study from birth to childhood. J Pediatr. 1985;106:734 –738
associated with childhood obesity.Am J Clin Nutr. 1984;39:619 – 624 71. Pate RR, Ross JG. The national children and youth fitness study II:
factors associated with health-related fitness.J Phys Educ Recreation Dance. 1987;58:93–95
72. Gortmaker SL, Dietz WH, Cheung LW. Inactivity, diet and the fattening of America.J Am Diet Assoc. 1990;90:1247–1252, 1255
73. Goran ML, Hunter G, Nagy TR, Johnson R. Physical activity related energy expenditure and fat mass in young children.Int J Obes. 1997;21: 171–178
74. Fonseca V de M, Sichieri R, da Veiga GV. Factors associated with
obesity among adolescents.Rev Saude Publica. 1998;32:541–549 75. Tucker LA. The relationship of television viewing to physical fitness
and obesity.Adolescence. 1986;21:797– 806
76. Taras HL, Sallis JF, Patterson TL, Nader PR, Nelson JA. Television’s influence on children’s diet and physical activity.Dev Behav Pediatr. 1989;10:176 –180
77. Leibel R, Rosenbaum M, Hirsch J. Changes in energy expenditure resulting from altered body weight.N Engl J Med. 1995;332:621– 628 78. Kohl HW, Hobbs KE. Development of physical activity behaviors
DOI: 10.1542/peds.105.4.e56
2000;105;e56
Pediatrics
Lindsay Frazier, Carlos A. Camargo, Jr, MD and Graham A. Colditz
Catherine S. Berkey, Helaine R. H. Rockett, Alison E. Field, Matthew W. Gillman, A.
Preadolescent and Adolescent Boys and Girls
Activity, Dietary Intake, and Weight Changes in a Longitudinal Study of
Services
Updated Information &
http://pediatrics.aappublications.org/content/105/4/e56 including high resolution figures, can be found at:
References
http://pediatrics.aappublications.org/content/105/4/e56#BIBL This article cites 66 articles, 12 of which you can access for free at:
Subspecialty Collections
icine_sub
http://www.aappublications.org/cgi/collection/adolescent_health:med
Adolescent Health/Medicine
http://www.aappublications.org/cgi/collection/chapters_views_news
Chapters Views & News
http://www.aappublications.org/cgi/collection/endocrinology_sub
Endocrinology
following collection(s):
This article, along with others on similar topics, appears in the
Permissions & Licensing
http://www.aappublications.org/site/misc/Permissions.xhtml in its entirety can be found online at:
Information about reproducing this article in parts (figures, tables) or
Reprints
DOI: 10.1542/peds.105.4.e56
2000;105;e56
Pediatrics
Lindsay Frazier, Carlos A. Camargo, Jr, MD and Graham A. Colditz
Catherine S. Berkey, Helaine R. H. Rockett, Alison E. Field, Matthew W. Gillman, A.
Preadolescent and Adolescent Boys and Girls
Activity, Dietary Intake, and Weight Changes in a Longitudinal Study of
http://pediatrics.aappublications.org/content/105/4/e56
located on the World Wide Web at:
The online version of this article, along with updated information and services, is
by the American Academy of Pediatrics. All rights reserved. Print ISSN: 1073-0397.