Using straw in steep furrows
to reduce soil erosion and
increase dry bean yields
M. J. Brown and W. D. Kemper
ABSTRACT; Furrow-irrigated fields often have different slopes along a furrow, which tend to cause different water intakes and erosion rates. Irrigated furrows on the steeper slopes develop narrow channels that reduce the wetted perimeter in the furrow. This results in lower infiltration, and crops growing on the steep acres do not receive adequate water for the highest crop yield. Plants growing adjacent to straw-treated furrows received 1.3 to 2.1 times as much irrigation water as plants growing next to untreated furrows. Dry bean yield increases on the straw-treated furrows, compared to the untreated furrows, ranged from 614 kg/ha to 1,306 kg/ha—a 21 % to 62 % increase, respectively. Also, sedi-ment yield reductions in the straw-treated furrows ranged from 69% to 90 % compared to untreated furrows.
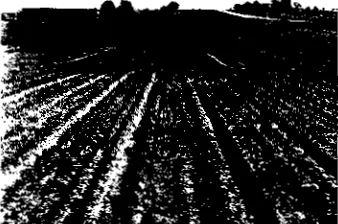
°LOPES on furrow-irrigated fields often 16,7 differ along the furrow. These differ-ing slopes tend to cause different water in-take rates. For example, when irrigation wa-ter flowing through a furrow with a 1% slope comes to a section with a 4% slope the wetted perimeter and cross section of flow decreases. The water then moves faster, ex-erting more shear on the soil, and erosion may increase by a factor of as much as 15 (6). As a result of this erosion, narrow deep channels develop on the steep slopes (Figure 1). This change in furrow shape further de-creases the wetter perimeter and infiltration rate; crops on the steep area do not receive adequate water. The erosion also removes
M. J. Brown is a soil scientist and W. D. Kemper is a supervisory soil scientist, Snake River Conservation Research Center, Agricultural
Research Service, U.S. Department of Agricul-ture. Route I, Box 186, Kimberly, Idaho 83341.
nutrient-rich topsoil and exposes subsoils of low fertility on the steeper slope. This also reduces production potential (5).
To obtain a preliminary assessment of how differences in slope affect crop yields, we measured bean yields on areas of dif-ferent slopes within several fields in Twin Falls County, Idaho. Generally, yields were lower on steeper slopes. Table 1 represents a field in which the furrow slope was 2% in the top section, 8% in the middle, and 1% in the bottom section. The bean field was irrigated when the beans on the top end needed water. This resulted in underirriga-tion and wilting of beans in the steep sec-tion, with consequent yield reduction.
Another farmer with similar field slopes recognized this problem and irrigated for about twice as long to get adequate water into the steep slope sections. This resulted in relatively good and uniform bean and
the flatter sections when nonlegumes were grown, probably because applied nitrates were leached below the root zone by over-irrigation.
In this case erosion generally was greater and the soils were lighter colored on the steeper slopes. Carter and associates 0) showed that removal of topsoil from this Portneuf soil substantially reduced produc-tion potential. Consequently, it was surpris-ing to find more nitrate in the steeper por-tions than in the flatter porpor-tions of the bean field (Table 1). Available phosphate (as determined by Olsen's bicarbonate pro-cedure) also was about three times as high in the steeper sections. The relatively high concentrations of these two nutrients in the steep sections probably resulted from uniform fertilizer applications to the field over the last 40 years and inadequate water intake on the steep slopes to allow for the crop growth for which the fertilizer applica-tions were designed. Hence, the low-yielding crops removed smaller portions of these nutrients on the steep sections in con-trast to other portions of these fields. Also, more nitrates may have leached on the sec-tions with less slope.
Landowners need an inexpensive means of improving infiltration on steep areas to increase crop yields and hold nutrient-rich topsoil in place. Previous studies have shown that plant residues placed in furrows effec-tively reduce erosion and increase infiltra-tion (1, 2, 4, 7, 8, 9). Increased infiltration rates on the steep slopes can increase corn production as much as 19 % .
In fields with uniform slopes, farmers often can simply apply water long enough to obtain adequate infiltration. Straw in the furrows can increase the intake rate and reduce soil erosion to acceptable levels. However, most natural fields do not have uniform slopes. In such fields, additional problems arise. For example, many farmers are concerned more about sediment deposi-tion than about erosion. Where segments of lower slope follow sections of higher slope, deposited sediments often fill the furrows. Water then is free to find a new course, commonly joining the flows from several furrows in a single furrow and leaving the bottom ends of the other furrows without water. This problem often becomes acute in the latter part of the season when the crop canopy is complete and farmers cannot clean out the furrows between irrigations with power equipment. The resulting misdirection of water is difficult to detect because of the canopy cover. And the prob-lem often is difficult to correct without substantial labor and crop destruction. Failure to correct the misdirection results in
Table 1. Effects of furrow slope on bean
yields and nitrate levels in the soil at the end of the season.
Furrow Bean Nitrate in Soil at
Slope Yield End of Season
(01a) (kg/ha) (kg/ha 30 cm)
2 4,767 22
6 1,680 85
1 3,808 31
lack of water and reduced production in the down-furrow portion of the field.
We designed a study to determine if straw in the furrows would reduce soil erosion and associated deposition in such fields, increase bean production, and provide a solution to this management problem.
Study methods
We conducted the study during 1984 and 1985 on the University of Idaho research farm near Kimberly. The soil was Portneuf silt loam (Durixerollic Calciorthid). In 1984 the upper one-third of the plot area had a 2.4 % slope, the middle one-third had a 3.9% slope. and the lower one-third had a 1.9% slope (Figure 2). In 1985 the slopes were 2.4 To , 4.4 % and 2.4% for the upper, middle, and lower one-third areas, respect-ively.
The study area previously had been planted to dry beans. Plots were roller-har-rowed, chemically treated for weeds, cor-rugated, and planted to dry beans. Soil
Water Level or 1% Slave, RWP v 1.00 toili al Water Level at 4% Slope,
RWP • 0.59 RWP • Relative Wetrea Perimeter
Furrow Sat tam Water Level of 4% Slope During or After Eroaiaa, RWP • 045
Figure 1. Effects of slope on erosion and wetted perimeter.
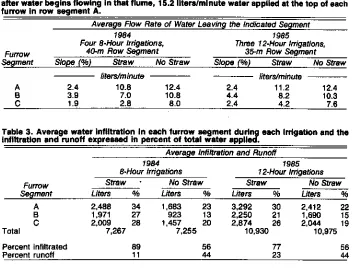
Figure 2. View from top of row-segment A show-`ing the three different slopes and the smelt trapezoidal flumes at the ends of segments A, B, and C, respectively.
moisture was sufficient for bean germina-tion and emergence.
We placed 45 g of straw/m in the straw-treated furrows in 1984 and 30 g/m in 1985. We divided furrows into three 40-m row segments during 1984 and three 35-m seg-ments in 1985. Water was supplied to the top end of segment A (2.4% slope) at 15.2 Iiters/minute. The water traveled through the first segment, then passed through a small trapezoidal flume where flow rate was measured and samples for sediment concen-tration determination were collected. The water then passed through segment B with the steeper slope, at the bottom of which was another small trapezoidal flume. Water thereafter traveled through the final seg-ment C with lower slope and a third trapezoidal flume. From the flume measurements we calculated soil erosion, in-filtration, and water runoff for each row segment. We harvested and threshed the dry beans at the end of the growing season to determine dry bean yields. There were four 8-hour irrigations during 1984 and three 12-hour irrigations during 1985.
We selected trapezoidal flumes for the flow measurement because head loss is small and could be kept to less than 4% of the total elevation change along any furrow seg-ment. The I-cm to 2-cm head loss at these flumes did cause some sediment deposition in front of the flumes, but this was a prac-tically negligible fraction of the total sedi-ment moving.
Results and discussion
Table 2 shows the flow rates out of each segment during the 2 years. Initial flow rate at the top of the furrows was 15.2 liters/minute. As water flowed through seg-ment A, some infiltration occurred, reduc-ing the flow rate as it entered segment B, where more infiltration occurred. The flow rate was reduced further by infiltration in segment C.
Effect of straw on infiltration. During 1984, with four 8-hour irrigations, 89 % of the total water applied infiltrated in the straw furrows compared to only 56% in the untreated furrows (Table 3). Only 11 % of the applied water ran off straw-treated fur-rows compared to 44% runoff from un-treated furrows. During 1985 runoff from the straw-treated and untreated furrows was 23% and 44%, respectively. The shorter furrow length and lower amount of straw applied in 1985 probably caused the greater runoff in the straw-treated furrows that year. Also, irrigations were 4 hours longer in 1985 than 1984. Infiltration rate decreased and runoff increased during the last 4 hours of the 1985 irrigations.
Table 3. Average water infiltration in each furrow segment during each Irrigation and the infiltration and runoff expressed in percent of total water applied.
Furrow Segment
Average infiltration and Runoff 1984
8-Hour Irrigations 12-Hour Irrigations1985
Straw - No Straw Straw No Straw
Liters % Liters % Liters % Liters %
A 2,488 34 1,683 23 3,292 30 2,412 22
B 1,971 27 923 13 2,250 21 1,690 15
C 2,009 28 1,457 20 2,874 26 2,044 19
Total 7,267 7,255 10,930 10,975
Percent infiltrated 89 56 77 56
Percent runoff 11 44 23 44
Table 4. Total sediment passing out of each segment and net sediment lose ( - ) or gain ( ) from straw-treated and untreated furrow segments during the 1984 and 1985 Irrigation seasons.
Furrow Segment
Total Sediment (t/ha)
1984 1985
Slope
(%) Straw No Straw Sl(%)ope Straw No Straw
0.4 (In supply) 0.4 0.4 0.4
A 2.4 13.5 (-13.1) 79.9 (-79.5) 2.4 29.6 ( - 29.2) 121.9 (-121.5) B 3.9 18.2 ( - 4.7) 125.7 (- 45.8) 4.4 57.5 ( - 27.9) 226.1 (-104.2)
C 1.9 0.5 (+17.7) 68.3 (+57.4 2.4 4.3 (+53.2) 53.2 (+172.9)
slope) averaged 923 liters in the untreated furrows and 1,971 liters in the straw-treated furrows (Table 3). Thus, plants adjacent to the straw-treated furrows received more than twice as much irrigation water as plants adjacent to untreated furrows.
Effect of straw on erosion and sediment
yield. Table 4 shows total sediment outflows from each furrow segment. The greatest sediment discharge was at the bottom of the steep, middle segments (B) of the untreated furrows. However, total soil loss was greater from the A segments where slope was lower but flow rates higher. Hydraulic theory and previous research (6) indicate greater soil losses due to increasing slope than to increas-ing flow rate. One possible explanation of greater erosion in the A segments is that flow in furrows on the steep (B) segments cut a narrow groove, then stopped eroding, while in the less steep A sections the erosion chan-nels were broader and did not reach the cultivation pan within the period of mea-surement.
However, close observation of the erosion process revealed that a coating formed on the wetted perimeter of the furrows in the B segments. This coating consisted of fine sediment that originated from segment A. Sediment concentration of water entering the A segments was negligible (Table 4), and there was no noticeable coating on the wetter perimeter of the upper ends of the A sections. There was some coating near the bottom of section A. The coating reached maximum intensity in the B segments. The coating appeared to stabilize the wetted pe-rimeter against erosion, and the erosion that took place in the B segments was primarily at head cuts. Water going over these min-iature waterfalls, from 1 to 8 cm high, undercut the coated and stabilized channel perimeter, which then broke off (Figure 3). These head cuts migrated upstream, and one or more migrated through a large por-tion of the B segments.
However, there were larger portions of the B segments where the original wetted perimeter had been coated (Figure 3, left) and remained intact. Practically no erosion occurred along these sections.
Figure 4 shows effective erosion reduction and increased lateral water movement in B segments of the straw-treated furrows. The untreated furrow (Figure 4) was undercut with very little apparent wetting of the soil adjacent to that furrow. Figure 5 shows a closer view of a straw-treated furrow on the 3.9% slope. Lateral water movement, in-dicated by soil wetting adjacent to the fur-row, took place with no deep undercutting. In comparison, figure 6 shows the deep undercutting that occurred in an untreated furrow at the 3.9% slope. The water had
Furrow Segment
A
C
Table 5. Dry bean yields from straw-treated and untreated furrows for the 1984 irrigation season.
Dry Bean Weld (kg/ha) Straw No Straw
3,440 2,773
3,413 2,107
3,600 2,986
not reached the furrow ridge. As time prog-ressed, the channel deep ended, the water level dropped, and the wetted soil surface did not reach the furrow ridge during this irrigation.
The greatest sediment removal occurred in the A and B segments of untreated fur-rows in both 1984 and 1985 (Table 4). Losses from the straw-treated A and B segments ranged from 10% to 24% of the losses on the segments with no straw.
Because less water infiltrated into the un-treated, compared to un-treated, A segments, flow rates were higher in the untreated, compared to treated, B segments. The high-er flow rates (Table 2) contributed to the increased sediment loss in the untreated B
2.4 11.2 12.4
4.4 8.2 10.3
2.4 4.2 7.6
segments compared to treated segments. Straw reduced soil loss in 1984 more than in 1985 for several reasons. In 1984 the 15 g/m more straw applied to the whole fur-row resulted in greater infiltration in the A segments, which helped reduce flow rate in B segments to 7.0 liters/minute compared to 8.2 liters/minute in 1985.
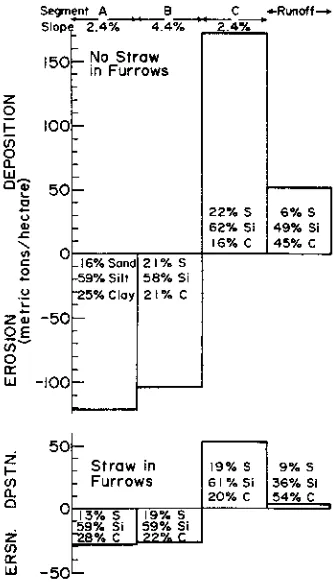
Soil loss from the A and B segments of the untreated furrows during 1985 was more than 100 t/ha (Figure 7). More than 170 tiha of sediment were deposited in the C seg-ments. Straw in the furrows did not elimi-nate erosion completely from the A and B segments or prevent sediment deposition in the C segments. However, erosion and deposition decreased about 30% compared to untreated furrows. This reduced deposi-tion avoided complete filling of the furrows and retained control of the water. The flow-ing water did not remove any straw from the furrows. All the untreated furrows had to be cleaned out at least once to maintain a channel that would retain the water in the proper furrows.
Sediment leaving the field in runoff from C segments of untreated furrows was much Table 2. Average water flow rate passing through flumes at the ends of each row segment after water begins flowing in that flume, 15.2 liters/minute water applied at the top of each furrow In row segment A.
2.4 10.8 12.4
3.9 7.0 10.8
1.9 2.8 8.0
Furrow Slope Segment (%)
A 2.4 3.9 C 1.9
Average Flow Rate of Water Leaving the Indicated Segment
1984 1985
Four 8-Hour Irrigations, Three 12-Hour Irrigations,
40-m Row Segment 35-rn Row Segment
Slope (%) Straw No Straw Slope (%) Straw No Straw
greater than that from the straw-treated fur-rows. Reduced runoff was a contributing factor, causing most sediment to remain on the straw-treated plots.
Effect of straw on water intake and yields. Straw increased water intake and bean yields of all segments (Tables 3 and 5). In-take in segment C was not as great as in seg-ment A. But yields in segseg-ment C were higher than in the A segments. This probably re-sulted from the long-term topsoil removal from the A and B segments and its deposi-tion in the C segments. The percentages of sand, silt, and clay moved from or into the segments under both treatments (Figure 7) illustrates the magnitude of this topsoil movement and an indication of the texture and fertility changes that took place. The texture of the sediment leaving segments A and B was essentially the same as the tex-ture of the soils in those segments. Textex-ture of the sediment deposited in segment C was a function of treatment or how much of the water ran off. Sediment in the runoff was much higher in clay content than the soil from which it came. Consequently, the coarseness of the sediment deposited in seg-ment C increased as runoff increased.
Figure 3. Head cut on a furrow segment where fine sediment coated the wetter perimeter.
Figure 4. View showing row-segment B (3.9% slope) in the foreground. Straw reduced erosion compared to the untreated furrow to the right.
Figure 5. Straw reduced erosion during the first irrigation in segment B (3.9% slope), straw-treated furrow.
Figure 6. Ground-level view up a segment-B (3.9% slope), untreated furrow showing severe erosion during the first irrigation.
However, most of the topsoil eroded from segments A and B was deposited in segment C. Carter and associates (5) found that such erosion and deposition resulted in substan-tial productivity declines in the eroded area and some productivity increases in the dep-osition area.
Straw in segment-A (2.4 % slope) furrows during 1984 increased bean yields 667 kglha (24 % ) and reduced sediment yield 84 % compared to untreated furrows. The largest increase in bean yield resulting from straw treatment occurred in the segments with 3.9 % slope. In the straw-treated segment-B furrows, bean yield increased 1,308 kWha (62%) and sediment loss decreased 10 % compared to untreated furrows. In the straw-treated segment-C (1.9%a slope) fur-rows, bean yield increased 614 kg/ha (21%). The greater yields in the straw-treated, steep B segments resulted in part from increased moisture and to fertilizer accumulated in the steep segments due to inadequate water and low extraction by prior crops (Table 1).
Summary
Our study showed that loose wheat straw placed in irrigation furrows with steep seg-ments can reduce soil loss and sediment
dep-sult in conservation of soil, water, and plant nutrients, reduced labor, and higher yields. A coating of fine sediment tended to ac-cumulate on the wetted perimeter of fur-rows in which the water bears suspended sediment. This coating stabilized the wetted perimeter against the normal hydraulic shear occuring in the furrow. However, where head cuts developed, they cut away the soil under this coating. We need to in-vestigate the role of these surface coatings on erosion to determine if they can be generat-ed or controllgenerat-ed by management practices. In this and similar fields with steep seg-ments, only a small fraction of the eroded soil leaves the field unless the steep section is at the bottom end of the field. When the steep section is not at the bottom end, sedi-ment deposition in the furrows often causes misdirection of the water, failure to irrigate lower sections of many furrows, and lower crop yields. irrigators often perceive this problem as being more immediate and criti-cal than sediment losses in the runoff and as-sociated long-term productivity reductions. Applying straw in the furrows of this erodi-ble soil practically eliminated both proerodi-blems.
REFERENCES CITED
1. Aarstad, J. S., and D. E. Miller. 1978. Corn residue management to reduce erosion in ir-rigation furrows. J. Soil and Water Cons. 33: 289-291.
2. Aarstad, J. S., and D. E. Miller. 1981. Effects
Secynent Slop
150
z 0
l00 (7)
A B C
2.4% 4.4%
No Straw in Furrows
2.4%
o-w oT 50
22% 5 6% S a)
.c 62% Si 49% Si
16% C 45% C 0
16% Sand 21% 59% Silt 58% Si U -25% Cloy 21% C
Straw in 19% S 9% 5
Furrows 61% Si 36% Si
20% C 54% C
Figure 7. Erosion, deposition, and soil loss in the untreated and treated furrows.
2 E a, -50
u) — 0 • -i00
50
o.. 0 2
• -50
13% 5 19% S 59% Si 59% Si "28% C PP% C
of small amounts of residue on furrow erosion. Soil Sci. Soo. Am. J. 45: 116-118.
3. Berg, R. D. 1984. Straw residue to control fur- 7 row erosion on sloping irrigated crop land. . Soil and Water Cons. 39: 58-60.
4. Brown, M. J. 1985. Effect of grain straw and furrow irrigation stream size on soil erosion and infiltration. J. Soil and Water Cons. 40: 8. 389-391.
• . Carter. D. L.. R. D. Berg, and B. J. Sanders. 1985. The effect of furrow irrigation on crop 9. productivity. Soil Sei. Soc. Am. J. 49: 207-211. 6. Kemper, W. D., T. J. Trout, M. J. Brown. and R. C. Rosenau. 1985. Furrow erosion and
water and soil management. Trans., ASAE 28: 1,564-1.572.
Larson. W. E., R. F. Holt, and C. W. Carlson. 1978. liesidues for soil conservation. In W. R. Oswald [ed.] Crop Residue Manage-ment Systems. Spec. Publ. 31. Am. Soc. Agron., Madison. Wise. pp. 1-15.
Miller. D. E. 1989. Residues improve furrow irrigation infiltration rates. Crops and Soils (Aug.-Sept.): 23-24.
Miller, D. E., and J. S. Aarstad. 1971. Fur-row infiltration rates as affected by incorpora-tion of straw or cultivaincorpora-tion. Soil Sci. Soc. Am. Proc. 35: 492-495.