Lincoln
University
Digital
Dissertation
Copyright
Statement
The
digital
copy
of
this
dissertation
is
protected
by
the
Copyright
Act
1994
(New
Zealand).
This
dissertation
may
be
consulted
by
you,
provided
you
comply
with
the
provisions
of
the
Act
and
the
following
conditions
of
use:
you
will
use
the
copy
only
for
the
purposes
of
research
or
private
study
you
will
recognise
the
author's
right
to
be
identified
as
the
author
of
the
dissertation
and
due
acknowledgement
will
be
made
to
the
author
where
appropriate
you
will
obtain
the
author's
permission
before
publishing
any
material
from
the
dissertation.
i
Abstract
Recent intensification of farm systems (especially within Canterbury) has resulted in increased nitrogen losses to water. This has created health risks and the eutrophication of waterways. Winter grazing of dairy cows on forage crops (such as kale and fodder beet) is a particularly “nutrient leaky” system. High stocking rates result in a build-up of soil nitrogen from the nitrogen loading in urine patches. The nitrogen is not taken up by plants (as winter is a low growth season) and is readily leached from the soil.
Government and regional councils have responded by creating regulatory control around nitrogen losses to water for farming systems. The Canterbury regulations are set out in the Land and water Regional Plan (LWRP). The Selwyn Te Waihora zone (a particularly high risk zone) has specific policies and rules outlined in Variation 1 in the LWRP, including nitrogen loss reductions by 2022 (22% for a dairy support farm).
Overseer is the computer modelling tool used by regional councils to measure and regulate nitrogen leaching losses. This research project focuses on management options to reduce nitrogen losses to water, as modelled by Overseer 6.2.2. Due to the irregular updates and new versions of Overseer released this area of study is going to need constant attention, as results will change.
Four case study dairy support farms were used to determine common industry practise for wintering systems. This information was used (along with industry recommendations) to create an Overseer base model for both a kale and fodder beet system. This model was used to determine the success of four management strategies in reducing nitrogen leaching losses. Nitrogen use, feed supplement nitrogen content, soil type and the use of a catch crop were all modelled.
Fodder beet and Kale were not directly compared using Overseer as inconsistencies in the model called into question the reliability of results. Instead a thought experiment was used for a direct comparison.
A number of inconsistencies within the Overseer 6.2.2 model impacted on results. Crop feeding levels were variable between crops and yields, feed supplement had no effect on nitrogen leaching losses and nitrogen losses from kale crops seemed low when compared with published research.
ii
Acknowledgements
This dissertation has been a testament to the fantastic people surrounding me throughout my four years at Lincoln University. Without the support and belief of them all I doubt whether I would have managed to complete what seemed at times like an impossible task.
Firstly, to the Mehrtens family, especially Julie, who instilled in me my passion for the dairy industry. Without them I may not have even begun at Lincoln, let alone finish my dissertation.
I would like to give special thanks to Guy Trafford, who has been a fantastic and supportive supervisor throughout my fourth year. I have really appreciated all the help, guidance and timely feedback that I have received. Good luck to you with your sheep milking venture, I am sure it will be a success!
To my parents I am eternally grateful for all your time and patience. The two of you have given me the gift of roots and wings, and as you always tell me, I selected my parents well.
To Dad, you are my saviour. Thank you so much for giving me insight into Overseer and farming systems, and all the assistance you have provided in nutting out a model or understanding the (sometimes) strange results.
Many people from the industry also helped with this dissertation. Your time and expertise was truly valued. Thanks to my four case study farmers, without you this dissertation would not be possible. Also Milton Munro, Samantha Robinson, Charlotte Glass and Dave Lucock need to be thanked for assistance in creating valid Overseer models given their knowledge of the industry, fodder crops and Overseer itself.
My years of study have been made so much easier through the generous financial assistance I have recieved. Many thanks to the Jeff Farms Scholarship, Harwood Farm Trust, Suffrage Centennial Scholarship, the Ingleby Scholarship, the SS Obery Scholarship and DairyNZ. In particular I would like to thank Susan Stokes at DairyNZ for all the mentorship and opportunities presented to me by DairyNZ.
iii
Table of Contents
Abstract ... i
Acknowledgements ... ii
Table of Contents ... iii
Table of Tables ... vii
Table of Figures ... viii
1 Introduction ... 1
2 Honours Literature Review ... 3
2.1 Introduction ... 3
2.2 Farm systems theory ... 3
2.3 Dairy Wintering ... 4
2.4 Forage wintering systems ... 4
2.4.1 Fodder beet ... 5
2.4.2 Kale ... 6
2.4.3 Feeding levels ... 6
2.5 Environmental concerns ... 7
2.5.1 Soil degradation ... 8
2.5.2 Nitrate leaching ... 8
2.5.3 Water quality ... 9
2.6 Regulations for nutrient leaching ... 9
2.6.1 Environment Canterbury ... 10
2.6.2 Selwyn Te Waihora -Variation 1 ... 11
2.6.3 What this means for farmers ... 12
2.7 Overseer Nutrient Budgets ... 12
2.8 Management options to reduce leaching ... 13
2.9 Conclusion ... 15
3 Research methods ... 17
3.1 Introduction ... 17
3.2 Research objective ... 17
3.3 Research approach... 17
3.4 Obtaining data ... 18
3.5 Quantitative research methods ... 18
iv
3.6 Qualitative research ... 19
4 Case study farms ... 20
4.1 Farm selection ... 20
4.2 Case study farm quantitative information ... 21
4.3 Case study qualitative information ... 22
5 Pilot study ... 22
5.1 Initial Overseer analysis ... 22
5.2 Thought experiment ... 23
5.2.1 Model parameters: ... 23
5.2.2 Nitrogen application required for fodder beet and kale crops ... 24
5.2.3 Nutrition requirements for dry dairy cows over winter ... 25
5.2.4 Daily nutrition supplied by a 11kgDM crop and 3kg DM supplement diet ... 27
5.2.5 Nitrogen balance for the 1000 cow wintering system ... 28
5.2.6 Conclusions from thought experiment ... 29
6 Management options for reducing nitrogen leaching ... 31
7 Overseer results ... 35
7.1 Introduction ... 35
7.2 Kale Results ... 35
7.2.1 Effect of Nitrogen application rate on Nitrogen losses for a Kale wintering system .... 35
7.2.2 Effect of feed supplement choice on Nitrogen losses for a Kale wintering system ... 36
7.2.3 Effect of soil type on nitrogen losses to water under a kale wintering crop ... 38
7.2.4 Effect of crop rotation on nitrogen leaching from kale crops ... 39
7.3 Fodder beet results ... 40
7.3.1 Effect of Nitrogen application rate on N losses from a fodder beet wintering system 40 7.3.2 Effect of feed supplement on nitrogen losses for a wintering fodder beet crop ... 41
7.3.3 Effect of soil type on nitrogen losses to water for a fodder beet wintering crop ... 43
7.3.4 Effect of crop rotation on nitrogen losses to water from fodder beet crop ... 44
7.4 Modelling a 22% nitrogen reduction ... 45
7.4.1 Kale nitrogen loss reduction ... 45
7.4.2 Fodder beet nitrogen loss reduction ... 46
8 Discussion ... 48
8.1 Regulatory framework ... 48
8.1.1 Land and Water Regional Plan ... 48
v
8.2 Overseer and its use in regional policy ... 49
8.3 Management Options for Farmers ... 50
8.3.1 Fodder beet vs kale crop selection ... 50
8.3.2 Winter forage crop management practices ... 51
8.4 Meeting 22% reduction in nitrogen losses to water ... 54
8.5 Practical farm changes ... 55
8.6 Limitations of this research project ... 56
8.7 Future research ... 57
9 Conclusion ... 58
10 Appendices ... 60
10.1 Farm A. Overview ... 60
10.1.1 Soils ... 60
10.1.2 Irrigation ... 60
10.1.3 Supplements and winter feed ... 61
10.1.4 Crop rotation ... 61
10.1.5 Kale/ Fodder beet ... 61
10.1.6 Winter crop gross margins ... 62
10.2 Farm B. Overview ... 63
10.2.1 Soils ... 63
10.2.2 Irrigation ... 64
10.2.3 Supplements ... 64
10.2.4 Stock ... 64
10.2.5 Winter feed ... 64
10.2.6 Crop rotation ... 65
10.2.7 FB/Kale- why? ... 65
10.2.8 How is the fodder crop yields tested/ measured? ... 65
10.2.9 Winter crop gross margins ... 66
10.3 Farm C. Overview ... 68
10.3.1 Soils and Irrigation ... 68
10.3.2 Stock ... 68
10.3.3 Supplement and winter crops ... 69
10.3.4 Why growing FB not Kale? ... 69
10.3.5 Fodder crop rotation ... 69
vi
10.4 Farm D. Overview ... 71
10.4.1 Soils ... 71
10.4.2 Stock ... 71
10.4.3 Feeding contracts ... 72
10.4.4 Supplements/ crops ... 72
10.4.5 Crop rotation ... 72
10.4.6 Irrigation ... 72
10.4.7 Kale vs FB ... 72
10.4.8 CPW ... 73
10.4.9 Financials ... 73
10.5 Plant and Food crop nutrient uptake calculator ... 73
10.6 Overseer 6.2.2 Kale base model nutrient reports ... 74
vii
Table of Tables
Table 1 Overview of case study farms ... 21
Table 2 Case study farms qualitative information ... 22
Table 3 OVERSEER upper and lower feeding limits ... 23
Table 4 Thought Experiment- Nitrogen Application ... 24
Table 5 Thought Experiment- Stock Nutrition Requirements ... 25
Table 6 Thought Experiment- Diet Nutrition ... 27
Table 7 Thought Experiment- Nitrogen Balance ... 28
Table 8 Fodder beet and Kale nitrogen use comparison (for 1000 cows) ... 29
Table 9 OVERSEER Kale Model ... 33
Table 10 OVERSEER Fodder Beet Model ... 34
Table 11 Kale-Nitrogen application leaching results ... 35
Table 12 Kale- Supplement selection leaching results ... 36
Table 13 Kale- Soil type leaching results ... 38
Table 14 Kale- Crop rotation leaching results ... 39
Table 15 Fodder beet- Nitrogen application leaching results ... 40
Table 16 Fodder beet- Supplement selection leaching results ... 41
Table 17 Fodder beet- Soil type leaching results ... 43
Table 18 Fodder beet- Crop rotation leaching results ... 44
Table 19 Nitrogen leaching loss % reductions from crop management strategies ... 45
Table 20 Nitrogen losses from kale crops on different soils, with selective timing of grazing ... 45
Table 21 Nitrogen leaching loss % reductions from crop management strategies ... 46
Table 22 Nitrogen losses from kale crops on different soils, with selective timing of grazing ... 47
Table 23 Farm A Fodder beet gross margin ... 62
Table 24 Farm A Kale gross margin ... 63
Table 25 Farm B Fodder beet gross margin ... 66
Table 26 Farm B Kale gross margin ... 67
viii
Table of Figures
Figure 1(Pinxterhuis et al., 2013) ... 5
Figure 2 Canterbury Water Management Zones (Environment Canterbury, 2009) ... 10
Figure 3 Nutrient Allocation Zones (Environment Canterbury, 2012) ... 11
Figure 4 Kale- Nitrogen application leaching results ... 36
Figure 5 Kale- Supplement selection leaching results ... 37
Figure 6 Fodder beet- Nitrogen application leaching results ... 41
Figure 7 Fodder beet- Supplement selection leaching results ... 42
Figure 8 Plant and Food- crop nutrient uptake calculator ... 73
Figure 9 Kale base model nutrient budget... 74
1
1
Introduction
The recent intensification of farm systems in New Zealand and in particular Canterbury has increased nitrogen losses to water, causing health risks and eutrophication of waterways. Nitrate levels are elevated above background nitrate levels in 39% of monitored waterways, with some higher than the NZFSA recommended levels of 11.3ppm (Baskaran, Cullen, & Colombo, 2009).
Government and regional councils have responded by creating regulatory controls around nitrogen (N) losses to water for farm systems, with a future requirement for leaching reductions across entire regions (Parfitt, Baisden, Schipper, & Mackay, 2008). This is particularly important for farm systems that winter dry dairy cows on forage crops (a common system to preserve pasture quantity for the following spring), as it is a particularly “nutrient leaky” system. Dairy support land makes up 9% of the Selwyn Te Waihora catchment zone (Lilburn 2014), with forage crops commonly grown as supplement feed. Forage crops grazed in situ have much higher stocking rates than pastoral grazing, depositing significant amounts of urine nitrogen (which can contain nitrogen loading of
500-1000kgN/ha equivalent). N deposited in urine is far in excess of what plants can take up and utilise, especially in low plant growth periods (or fallow conditions), causing a build-up of N in the soil, which is readily leached in the wet and muddy conditions. (Dalley & Van der Poel, 2008).
Overseer, a computer modelling tool, was initially developed as a fertiliser decision aid for pastoral farmers. Regional councils have recently begun using Overseer as a regulatory tool to measure the nitrogen losses from a farm system. This is despite its limited accuracy, which comes from the many assumptions contained within its complex models (especially the cropping model). Although never designed for use as a regulatory tool (Overseer is better at predicting N loss from a catchment area- not from an individual farm) it has now become the “tool of choice” by many regional councils. Overseer is updated regularly with development from further research, which results in changes in modelled nutrient losses to water. (Cichota & Snow, 2009; Williams et al., 2013)
2
beet and kale systems. Average farm systems (as determined by case studies from within the Selwyn Te Waihora catchment) are modelled through Overseer, and then adjusted to determine the effect of management changes on nutrient leaching.
There has recently been an increase in research around management practices which can mitigate/ reduce the loss of nitrogen to water. These practices include using a “catch crop”, altering total diet protein through the use of feed supplements, fertiliser use and efficiency of use and the effect of soil type on nutrient losses. However there is little research available on how Overseer measures the effect of these changes, which is critical to farmers given Overseer’s use in regulation.
3
2
Honours Literature Review
2.1
Introduction
The purpose of this literature review is to evaluate current research and knowledge of dairy fodder crop wintering systems. It is particularly focussed on the economic and environmental implications of crop and management choices within the farm system, given the increasing regulations
surrounding nutrient and water management in New Zealand. Particular focus is given to the current regulations, monitoring/ measurement of environmental impacts and available options to reduce/ mitigate the negative environmental effects. The literature review will identify gaps in knowledge and highlight areas for subsequent research.
2.2
Farm systems theory
Farm systems theory was developed after the1960’s Reductionist approach (looking at a single isolated factor) failed to continue to provide further development within the agricultural industry. Farms systems theory is a holistic study of all factors contributing to the farm as a whole (Kelly & Bywater, 2005). This can be further expanded as “an assemblage of components which are united by some form of interaction and interdependence… to achieve specified agricultural objectives”
(McConnell & Dillon, 1997).
Successful farm management therefore requires at least a basic understanding of the principles of soil science, plant and animal husbandry, accountancy, finance, economics and sociology (Dent, Harrison, & Woodford, 1986). Altering one aspect may have unintended consequences on other aspects or the farm system as a whole due to the complex interactions between the system elements.
Farm systems revolve around inputs, outputs and the environment (regulatory, economic and physical) and as such will vary significantly across landscapes and disciplines (Kelly & Bywater, 2005). This is important. Within Canterbury the regulatory environment is changing, introducing constraints around nitrogen leaching, as a result of the negative impact that farming systems are having on the physical environment. Farming systems have intensified to maintain economic viability within a constantly evolving economic environment.
4
2.3
Dairy Wintering
Dairy wintering can be defined as the winter management of dry dairy cows. Correct winter management is critical as it affects the profitability of the whole dairy farm system. The winter diet affects the body condition score of the dairy cows, which in turn impacts on the following season’s milk production, reproductive performance and the growth of young stock. (Dalley & Van der Poel, 2008; Pinxterhuis, Dalley, Tarbotton, Hunter, & Geddes, 2013)
Heightened pressure to increase profitability by improving production/ ha on the milking platform has led to the rapid intensification of dairy farms. This, along with low winter pasture growth rates (due to soil temperatures below 9°C and heavy frosts common in the South Island of NZ), have been key drivers in the shift to dairy support blocks for wintering dry cows and raising replacement stock (Dalley & Van der Poel, 2008). To combat the low winter pasture growth rates, spring sown forage crops (commonly brassicas such as kale and swedes, cereals such as forage oats, and more recently fodder beet) are grown and grazed in situ the following winter. (Dalley & Van der Poel, 2008; Gibbs, 2011).
22,000ha of dairy support land is located within the Selwyn region, making up 9% of the catchment area (Lilburn, 2014). Some of which is dairy owned dairy support, and the remainder is owned by independent third parties/ contract graziers.
Control is the motivation for owning/ leasing a runoff dairy support block as opposed to contract grazing winter dry cows and young replacement stock. Substandard experiences for farmers when contracting stock out has resulted in many farmers deciding the cost of outsourcing the work is too high (Dalley, Wilson, Edwards & Judson, 2008). When contracts are successful a long term
relationship is often formed between the dairy support and the dairy farmer which may continue for many years.
2.4
Forage wintering systems
5
Figure 1(Pinxterhuis et al., 2013)
2.4.1
Fodder beet
Fodder beet as a wintering crop has become increasingly popular over the past 10 years, with an estimated increase in use from 100ha grown nationally in 2006 to 15,000ha in 2014 (Gibbs, 2014). This has been driven by extensive research and extension activities advocating for its use on farm.
Fodder beet , while difficult to grow a successful crop (as it is prone to failure of <10tDM/ha (Oswald, 2011)) can achieve realistic yields of up to 35tDM/ha. Fodder beet is a high energy feed of 11.8-12.5 MJME/kgDM, with low (11%) protein and can be grown at low cost of 8-10 cents/kgDM, with high utilisation of up to 95%. These attributes all contribute to make it a valuable fodder crop during winter months when pasture growth is minimal (Gibbs & Saldias, 2014 a).
Fodder beet is difficult to grow as it is susceptible to many factors which affect the strike rate and yield of the crop. Variation in soil type, cultivation and seed placement can all affect the germination and emergence of fodder beet, which can affect yield by as much at 10tDM/ha across a paddock. (Robinson, 2016). Fodder beet is also very sensitive to soil pH and soil fertility, which needs to be planned for a recommended 18months before planting, as fodder beet has a taproot which can reach as far as 1.5m down. (Munro, 2016)
6
have been known to die from the acidosis (Gibbs & Saldias, 2014 a). Correct management of the transition period onto the fodder beet will allow the rumen microbiology to adapt to the feed, and over 14 days animals can be fully adjusted to an ad- libitum fodder beet diet.
Fodder beet yield can be highly variable throughout a season, within a paddock and between paddocks. Careful and accurate assessment of the yield is necessary to ensure accurate allocation of feed/ head/day.
2.4.2
Kale
Kale has a history of use as a winter crop for dry dairy cows within the South Island of New Zealand. Kale can produce high yields of feed, averaging 13.6tDM/ha, with little deterioration of nutritive quality over the winter. The nutritive value of kale varies within the plant, with the tops and leaves reaching up to 12.7MJME/kgDM, while the tough stem near the base of the plant may only reach an ME of 6.6MJME/kgDM (Judson & Edwards, 2008). Kale is high in protein, (though protein varies between studies from 12-18% crude protein in DairyNZ’s feed supplement publication, to 18 -21% crude protein in (Gibbs & Hughes, 2008)), and can be grown for as little as $800-1200/ha (Agricom, 2012). Kale utilisation varies with feed allocation and climatic effects, but an average of 80% utilisation has been measured across Canterbury wintering farms. (Judson & Edwards, 2008).
Kale is an easy forage crop to both grow and feed. Kale is much less susceptible to factors such as soil type, cultivation, seed placement/ drilling depth than fodder beet.
Kale (a brassica) is high in sulphites, and has some risk of containing toxic levels of S-methyl cysteine sulphoxide (SMCO’s) which when consumed can cause fatal haemolytic anaemia. The concentration of SMCO’s varies with season, region and year, with research providing little understanding of why this occurs. Kale can also cause nitrate poisoning of cattle if they are poorly transitioned onto the crop, a result of rapid plant growth and high nitrogen requirements. (Gibbs & Hughes, 2008).
2.4.3
Feeding levels
Due to the yield of forage crops, wintering dry dairy cows can be contained to a smaller area on kale or fodder beet than if wintered on pasture or pasture/oats. At an estimated average yield of
7
available per hectare (Hawkins, A. 2016). The pasture would have to be shut up in March to ensure sufficient cover is retained to meet stock requirements over winter.
It is a far more efficient use of land to winter cows on high yielding, high energy forage crops than pasture.
Getting feed intake right is critical for the success of wintering dairy cows. If insufficient feed is available then the dairy cows will not achieve required live weight gain, impacting on the following season’s milk production. To ensure the dry cows receive sufficient feed to meet their energy requirements for maintenance and live weight gain, accurate assessment of crop yield is required. A study completed at 49 sites in Canterbury identified that 2/3 of herds were consuming less than the target intake by more than 1kgDM/head/day. (Judson & Edwards, 2008)
Intakes in excess of 150MJME/day will ensure cows gain the required body condition score over an eight week wintering period (Edwards, deRuiter, et al., 2014). Industry standard feed levels of 11kgDM/day of crop along with 3kgDM/day of supplement are used in a number of animal trials (Edwards, deRuiter, et al., 2014; Farrell, 2015; Rugoho, 2013). There is disparity between dry matter intake (metabolisable energy) and animal metabolisable energy requirements. This is suggested to be for a number of reasons including overestimating the ME of the crop, underestimating the ME requirements for maintenance and live weight gain, over estimating the utilisation of feed, and disparity between actual and estimated digestibility of feed (Edwards, deRuiter, et al., 2014)
2.5
Environmental concerns
8 2.5.1
Soil degradation
The high densities of stock required to graze high yielding winter fodder crops can cause soil compaction and pugging damage. A study by Drewry and Paton (2005) found that a kale/ swede wintering system with a stocking density of 556 cows/ ha resulted in severe soil compaction,
increasing the bulk density of the soil and reducing the porosity. This damage will be more severe for weaker soil structures, such as a pallic or gley soil, and will be further compounded if there is high water content in the soil- such as is common in winter. (Monaghan, 2012)
Soil damage and compaction weakens soil structure, increasing the susceptibility of soils to P and sediment loss with surface water runoff. The compaction damage from pugging and treading can reduce the productivity of soil, impacting on the growth of future crops/ pasture covers (Monaghan, 2012). DairyNZ estimates that pasture production can be reduced by 20-80% for four to eight months. From Northland, New Zealand, Farmers Grant and Christine Wes have measured their paddocks and found that they produce 29% less DM/year if severely compacted from stock during winter (Anonymous, 2013).
The damage from winter grazing compaction can be fixed if it is short term/ part of a pasture renewal program. Repeated cropping can result in cumulative damage, reducing future productivity of the soil. Irrigated pastures have been found to suffer longer effects of soil compaction, while dryland pastures recover more quickly (Paton & Houlbrooke, 2010). A good cropping rotation with permanent pasture as well as direct drilling/ minimum tillage between crops can also help improve soil structure stability, reducing the risk of stock damage. (Monaghan, 2012)
2.5.2
Nitrate leaching
Nitrate leaching is increasingly becoming the focus of environmental concerns all over New Zealand. Nitrate (NO3-) is the most commonly available form of mineral nitrogen, and as a negatively charged ion it is repelled from the negatively charged soil ion exchange sites. This means it is readily leached from the soil profile when water drains through (McLaren & Cameron, 1996). Canterbury in
particular is focussing on regulating the nitrate losses from soil as over 200,000ha of the Canterbury region has shallow stony soils which are free draining, and therefore are particularly vulnerable to nitrate losses from high intensity systems (Di & Cameron, 2002).
Animal urine patches are the single biggest source of N for leaching from grazed farmland
9
the soil profile, which unless immobilised in the soil organic matter or lost to the atmosphere, is then readily leached (McLaren & Cameron, 1996). The higher the stocking rate, the greater the density of urine patches, and the more nitrate nitrogen is likely to be lost from the soil.
Grazed forage crop systems have a higher risk of nitrogen losses to water due to low plant growth and nutrient uptake and high stocking rate, increasing the deposition of excretal and urine nitrogen. Also, large amounts of mineral nitrogen are still in the soil from the soil cultivation and crop
establishment from the previous spring. (de Klein, Monaghan, Ledgard, & Shepherd, 2010; Monaghan et al., 2008)
2.5.3
Water quality
Studies have found that 39% of New Zealand’s monitored ground water has levels of nitrate
elevated above the natural background nitrate content, with some areas exceeding the New Zealand Food Safety Authorities (NZFSA) drinking water nitrate concentration limit of 11.3ppm. (Baskaran, Cullen, & Colombo, 2009).
Degrading water quality can lead to eutrophication of waterways. This is where an increase in algal bloom and noxious aquatic plant growth reduces oxygen levels, killing aquatic life off and severely limiting recreational activities. Elevated levels of nitrate in drinking water can also cause
methaemoglobinaemia (blue baby syndrome), causing asphyxiation and death in extreme cases (McLaren & Cameron, 1996).
Dairy and dairy wintering has contributed to this state of water quality. Individually the farm
agronomic practices have minimal effect, but as an industry the contribution to water degradation is significant. If current farm management practices continue then water quality will further degrade, which may impact on New Zealand’s global clean green image (Baskaran et al., 2009).
2.6
Regulations for nutrient leaching
Within New Zealand there are increasing concerns over the environmental impact on land and water quality of dairy farming and wintering dairy cattle. The intensification of dairy farming over the previous 15 years, especially in water sensitive areas such as Canterbury and Otago, is attracting the general public’s attention (Baskaran et al., 2009). The Parliamentary Commissioner for Environment has outline issues associated with the recent intensification, and called for a redesign of farm systems (Parfitt, Baisden, Schipper, & Mackay, 2008).
10
land’s baseline figure for historical land use, as calculated through nutrient budgets (Parfitt et al., 2008). Environment Canterbury, Otago Regional Council, Environment Southland, Waikato Regional Council, and Environment Bay of Plenty currently specify using OVERSEER (a computer based nutrient modelling tool) to estimate nutrient losses from agricultural properties (Williams et al., 2013).
2.6.1
Environment Canterbury
The Environment Canterbury (ECan) region is the focus of the study due to the basis of the research location and specific rules and regulations.
ECan has redefined how water and land is managed, “Since the 1970’s land use intensification has increased pressure on rivers and aquifers. Communities have become increasingly concerned about water quality and cultural health of waterways. This has led to a complete change in the way we manage water.” (Environment Canterbury, 2016a).
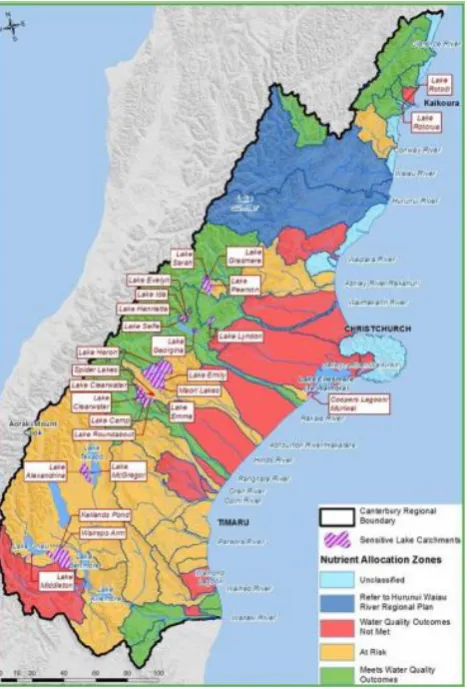
Ten Water Management Zones have been defined within the Canterbury region, each with their own committee which determines the target areas and time specific goals within that nutrient zone/ catchment (see figure 2).
.
Figure 2 Canterbury Water Management Zones (Environment Canterbury, 2009)
11
permitted activities unless consented. The three most relevant nutrient allocation zones to farming activities are:
Red- water quality outcomes are not met
Orange- at risk
Green- meets water quality outcomes
Figure 3 Nutrient Allocation Zones (Environment Canterbury, 2012)
2.6.2
Selwyn Te Waihora -Variation 1
The Selwyn Te Waihora zone, north of the Rakaia River and south of the Waimakariri River is considered a particularly high risk zone. Reduced water flows in rivers and lowland streams along with increasing measured nitrate concentrations in waterways have all contributed to the decreasing health of Lake Ellesmere. (Environment Canterbury, 2016b)
12
discharge of contaminants, to reduce the cumulative effects on water quality within the catchment (Environment Canterbury, 2015). Policy is in place to reduce nitrogen losses to water by 14% beyond what is readily achievable through good management practice by 2022. Farming activities under an irrigation scheme are managed as a collective- under an umbrella consent with permitted quota nutrient losses to be distributed by the irrigation scheme as seen fit. (Environment Canterbury, 2015)
2.6.3
What this means for farmers
Different farming systems are expected to achieve different reductions in nitrogen losses to water. The N loss reduction is measured as a percentage decrease from the baseline N loss figure for the property- as calculated using Overseer nutrient budgets for the 2009-2013 time period unless the farming system is already operating with less than 15kgN/ha loss.
Dairy farms 30% reduction
Dairy support 22% reduction
Irrigated sheep beef and deer 5% reduction
Arable 7% reduction
Dryland sheep and beef 2% reduction
This N loss reduction must be achieved by 2022, and is backed up by a farm environmental plan (FEP). Farmers are expected to achieve these reductions by implementing changes to farming practices halfway between good management practice and maximum feasible mitigation, depending on financial viability of the changes. (Environment Canterbury, 2015)
2.7
Overseer Nutrient Budgets
Reliable estimation of nutrient losses from farming systems is of increasing interest, driven by both economic and environmental concerns. Accurate measurements of nitrogen leaching losses are difficult to obtain and impractical given the scale and variability in farming systems. Computer modelling of a farm system is the most practical alternate for assessing potential nutrient losses from a system (Cichota & Snow, 2009; Lilburne, Webb, Ford, & Bidwel, 2010).
13
Overseer generates a report based on empirical relationships and readily available farm data, evaluating the farm system and nutrient inputs and outputs (Cichota & Snow, 2009). Within the Overseer program there are numerous background models containing equations based on researched knowledge. Where knowledge is incomplete, assumptions have been made (Selbie, Watkins, Wheeler, & Shepherd, 2013). Overseer analyses information at a block and a farm system level, modelling nutrient movements for the whole system. N loss is modelled through two
pathways, the urine and background N models. Typically urine N is lost at 60-90% of ingested N from feed supply (Selbie et al., 2013). However current understanding on N pathways is lacking, with uncertainty about the proportion of N lost to water, de-nitrification, volatilisation and erosion (Parfitt et al., 2008). More research is required to fill in the gaps.
More recent developments of Overseer have seen a cropping model included in the program. While Overseer is likely to still be the best tool available to model the complex cropping systems, it
contains many simplifications in the crop, soil and nutrient interactions. Further research is required to determine if these simplifications are suitable to measure the cropping system, or if they impair Overseer’s ability to accurately model the cropping interactions (Williams et al., 2013).
2.8
Management options to reduce leaching
A number of studies have been completed to determine the effectiveness of different mitigation strategies to reduce nitrogen leaching losses. Nitrogen losses are affected by climatic effects as well as management; however some changes are possible without dramatic changes to farm systems.
Obvious management strategies include dropping stock numbers or changing the farm system away from nitrogen expensive farm systems such as wintering dairy cattle. Other options such as
dicianamide (DCD), a chemical nitrification inhibitor, are no longer legal to use within New Zealand farming systems. DCD has proven to be effective at reducing N loss to water by 37-54% through slowing down the pathway converting ammonium into nitrate, which is more readily leached (Malcolm, Cameron, Edwards, & Di, 2015). The use of feed pads and restricted grazing are also proven methods to reduce nitrogen leaching from wintering systems (Monaghan et al., 2008), however they are outside the scope of this research due to their high capital investment requirements.
14
Nitrogen fertiliser needs to be used efficiently; to both maximise N use efficiency by crops, as well as avoiding wastage. Crop choice has a significant effect on N use efficiency, as a recent study found that fodder beet was much more efficient, producing 99kgDM/kg N applied compared with only 45-58kgDM/kgN applied for early and late kale crops respectively (Edwards, deRuiter, et al., 2014).
Irrigation management is important as it can both increase plant nitrogen uptake by stimulating growth in a dry season and reduce water drainage (through a soil through correct irrigation
scheduling). The more water passing through a soil, the more nutrients will be leached out. (Selbie et al., 2013)
Planting a “catch crop” directly behind a grazed winter crop is an uncommon practice. Normal practice involves a winter fodder crop grazed in situ, remaining fallow until re-planted with next winter’s crop in 3-4 months’ time. All the winter deposited urine N will remain in the soil unless leached out to ground water. By planting a follow up “catch crop” some nitrogen in the soil can be taken up. Recent studies conducted using lysimeters in Canterbury found that a green ‘chop’ oats crop planted within 63 days of grazing will reduce nitrate leaching by 34% on average (19-49% range), taking up 60-80kgN/ha from the soil. The effectiveness of a catch crop is likely to be affected by the season’s climate- as certain growing conditions need to be met for a successful crop to be grown. (Carey, Cameron, Di, Edwards, & Chapman, 2016). While crops such as oats can access the shallow deposited urine N from winter, a deeper rooted crop such as chicory has the potential to absorb nutrients from much lower down in the soil profile. An estimated >70% of soil nitrogen may be located below the root zone at 30cm. In a trial comparing cereals with deep rooted crops such as chicory, chicory recovered the most N (75kgN/ha) over the trial period, from spring to the following autumn. It was highlighted that there is an issue with the length of time required for a crop to develop a deep root system to access the mineral N below the conventional root zone. Retaining more mineral N higher up in the soil profile (by grazing later) would allow for more N to be taken up (Lucci, Shephard, & Carlson, 2015).
15
pasture based diets which often far exceed 300gN/day. (Edwards, De Ruiter, et al., 2014). Further studies simulating a fodder crop wintering system (fodder beet and kale) align with this, showing the fodder beet study as leaching 64-79kgN/ha (averages for the 2013 and 2013 seasons (Malcolm et al., 2016), while the kale study had leaching levels of 213kgN/ha (Malcolm et al., 2015).
2.9
Conclusion
The recent intensification of farm systems in New Zealand and in particular Canterbury has increased nitrogen losses to water, causing health risks and eutrophication of waterways. Nitrate levels are elevated above background levels in 39% of monitored waterways, with some higher than the NZFSA recommended levels of 11.3ppm.
Government and regional councils have responded by creating regulatory controls around N losses to water for farm systems, with a future requirement for leaching reductions, in some cases across entire regions. This is particularly important for farm systems which winter dry dairy cows on forage crops (a common system to preserve pasture quantity for the following spring), as it is a particularly “nutrient leaky” system. Dairy support land makes up 9% of the Selwyn Te Waihora catchment zone, with forage crops commonly grown as supplement feed. Fodder crops grazed in situ have much higher stocking rates than pastoral grazing, depositing significant amounts of urine nitrogen (which can contain nitrogen loading of 500-1000kgN/ha equivalent). N deposited in urine is far in excess of what plants can take up and utilise, especially in low plant growth periods (or fallow conditions), causing a build-up of N in the soil, which is readily leached in the wet and muddy conditions.
Overseer, a computer modelling tool, was initially developed as a fertiliser decision aid for pastoral farmers. Regional councils have recently begun using Overseer as a regulatory tool to measure the nitrogen losses from a farm system, despite its limited accuracy caused by the many assumptions contained within its complex models, especially the cropping model.
There has recently been an increase in research around management practices which can mitigate/ reduce the loss of nitrogen to water. These practices include using a “catch crop”, altering total diet protein through the use of feed supplements, fertiliser use and the effect selective grazing of crops on different soil types on nutrient losses. However there is little research available on how Overseer measures the effect of these management practices on nitrogen leaching, which is critical for farmers given Overseer’s use in regulation.
17
3
Research methods
3.1
Introduction
As discussed in the literature review it is becoming increasingly important for farmers to be able to implement management changes which result in a decrease in nitrogen losses to water. Therefore this study will be based on the analysis of how Overseer models nitrogen losses when management practices are changed. This will provide the information on how to mitigate nutrient losses to water that farmers need to meet regulatory standards.
Case study farms, industry experts and published research will all be used to develop an accurate model for both a kale forage crop wintering system and a fodder beet forage crop wintering system.
3.2
Research objective
The research objective for this research is:
To determine the effectiveness of different management options on reducing nitrogen losses to water from a kale or fodder beet forage system, as measured by Overseer 6.2.2.
Identify the differences in the two forage crops and determine if one crop is particularly favoured over the other considering increased nitrogen loss regulations, particularly within the Selwyn Te Waihora catchment.
NB: This project will be completed using the current version of Overseer, OVERSEER 6.2.2. The results and discussion are specific to this overseer version. Once Overseer is updated (on the 7th November 2016) these results may no longer be current.
3.3
Research approach
The research approach is quantitative. Specific data collected from case study farmers was collated with current research and good management practices (as determined through discussions with industry experts on fertiliser use, crop and feed management) to model dairy support units through Overseer 6.2.2. The nitrogen loss to water figures for both fodder beet and kale will be critically analysed.
18
selection on the whole farm system, the nitrate leaching regulations, the size or scale of the system and any scope for change.
3.4
Obtaining data
Data gathered from the case study farmers focuses on the dairy support system within the whole farm system. This is for ease of comparison between kale and fodder beet. Four case study farms were identified by Guy Trafford and Marv Pangborn as suitable for the project. Farms are all located within the Selwyn Te Waihora catchment in Canterbury.
Case study farmers were contacted first by phone to identify their willingness to participate. This was followed up by a detailed explanatory email, specifying the information required and why it is required. A personal on- farm visit was then conducted to collect all the required information. Only one visit was necessary for each farm.
Experts identified from Agricom, PGG Wrightsons and DairyNZ were contacted along the same lines once the case study farms were visited, and all information collated. Information on fertiliser regimes, crop rotations, potential crop yields and best management practice was all collected.
3.5
Quantitative research methods
3.5.1
Nutrient analysis
A nutrient budget for each case study farm has been constructed using OVERSEER 6.2.2. This information was used to compare the current farm system with the farm’s nutrient baseline, to determine the effect of any farm system changes if there were any.
19
The information gathered from the case study farms was used to create a model within OVERSEER to represent the average Canterbury dairy support unit. This model was then adjusted to determine the effects of management changes on nitrate leaching, for both fodder beet and kale crops.
3.6
Qualitative research
While collecting specific numbers and figures from case study farms for the quantitative research, qualitative information is also required. Information regarding how the fodder crops fit into the whole farm system, ease of use, and crop rotation has also been gathered. Opinions from the farmers about stock performance and health, crop yields and soil degradation have all been
20
4
Case study farms
4.1
Farm selection
As outlined in research methods above, four case study farms were identified and contacted to collect data for kale and fodder beet crops, which was used to create a representative model of a dairy support unit. This model was then run through Overseer 6.2.2 with different management options.
Four case study farms were identified with the help of Guy Trafford and Marv Pangborn. To be suitable for the research the farms had to meet certain specifications.
Farms were to all be located within the Selwyn Te Waihora catchment zone in Canterbury. The research focus is on Variation 1 in the Land and Water Regional Plan, which outlines policies and rules regarding management practices and nutrient loss to water restrictions specific to this zone.
The farms were all to have dairy support as a component of the whole farm system. This research focuses on the environmental issues of dairy wintering systems and the
management options available to reduce nitrogen losses to water.
An equal number of kale and fodder beet crops between all the selected case study farms was necessary to ensure enough data was available to conduct a fair analysis.
The farmers were required to be open to participating in the research and have good historical farm records to ensure any data collected is both reliable and relevant.
21
4.2
Case study farm quantitative information
Table 1 Overview of case study farms
Farm A Farm B Farm C Farm D
Area (total) 523, 483 ha effective 455ha 330ha 550ha
Location North Rakaia River vicinity Hororata North Rakaia River vicinity Hororata
Climate Annual rainfall - 712 mm, average temperature - 11.3, PET- 880mm
Annual rainfall - 794mm, average temperature - 11.3, PET- 882mm
Annual rainfall - 735 mm, average temperature - 11.1, PET- 1020mm
Annual rainfall - 872 mm, average temperature - 11.1, PET- 860mm
N Baseline 61kgN/ha/year 36kgN/ha/year 32kgN/ha/yr NA
N current system 61kgN/ha/year 78kgN/ha/year 32kgN/ha/year
CPW yes yes yes yes
Kale 45ha 70ha 0ha 42ha
Fodderbeet 45ha 30ha 27ha 0ha
Farm system
Dairy support Arable + Dairy support Arable + Dairy support Sheep, beef, arable, dairy support
Stock classes
290 MA Carry-over cull dairy cows, 5400 wintered dairy cows (all friesian)
800 Dairy calves, 90 Coopworth sheep, 50 Trading steers, 1800 MA dairy cows wintered.
50 trading steers, 300 dairy heifers, 1000 MA dairy cows for wintering
2200 MA Coopworth ewes, 310 MA Angus cows, 70 trading cull cows, 650 Friesian calves, 320 MA dairy cows
Dominant soil type Eyre silty loam Lismore silt loam Lismore silt loam Claremont silt loam
Soil Features Well drained, gravelly loam, moderate to high PAW (70-104mm in top 60cm)
Well drained, moderate PAW (86mm in top 60cm)
Well drained, moderate PAW (86mm in top 60cm)
Poorly drained, moderate to deep soil with high PAW (90mm)
Other soil types
Numerous well drained loam soils. 100ha stony fluvial loam, with low PAW (46-55mm). 109 ha of Waimakariri silty loam with very high PAW (109-141mm), 109ha of Lismore shallow silty loam with moderate PAW (86mm)
Darnley silt loam, stony, moderately well drained with low PAW (54mm in top 60cm)
Numerous silt loam soils ranging from Waimakariri (PAW of 141mm) to Eyre soil (PAW of 70mm)
Two shallow silty loams (Ruapuna and Darnley soils), well drained with a high PAW (94mm) aand low PAW (54mm) respectively. A deep silty loam Mayfield soil with moderate PAW (81mm) and a riverbed soil- basically stones.
Irrigation
473 ha irrigated, 59 ha dryland Fully irrigated 242ha Irrigated 210ha irrigated
Type Centre pivot and lateral
irrigators Centre Pivot
Centre Pivot and Travelling
irrigators Centre pivots
Water supply 170ha of CPW irrigation,
303ha Rakaia Gallery CPW CPW CPW
Irrigation Management Some precision Irrigation, neutron probes and irrigation scheduling
Irrigation scheduling, soil moisture content readings from 3 neutron probes
Irrigation scheduling and visual assessment of soil to determine moisture
Some VRI irrigation, visually asses soil moisture for irrigation scheduling
Supplement feeds 4000T/ DM 250T DM 360T DM 256 T DM
Source On farm On Farm and purchased On farm On farm and purchased
Type
Cereal and Grass Silage
Barley Straw and Pea Vine harvested, RG straw purchased
Barley straw and grass silage
Barley grain and straw, pasture and cereal silage all harvested on farm, RG straw purchased
Destination
Wintering dairy cows (6kgDM/d for 55 days) and sold off farm
Barley straw to wintering MA dairy cows, pea vine to replacement heifers on pasture
80% silage/ straw fed out on winter crops, remainder fed to replacement heifers
Barley- MA ewes, P and C silages- farm stock, barley straw- wintering dairy cows. RG straw- calves on crop
Winter crop mgmt Sold standing at $0.23/kgDM (current prices)
Sold standing at $0.21/kgDM (current prices)
Sold standing at $0.21/kgDM (current prices)
Sold standing at $0.21/kgDM (current prices)
Grazing revenue Kale
Yield Average 16tDM/ha Average 14tDM/ha - Average 12.5tDM/ha
Cost $1299/ha $1690/ha - $1732/ha
Income $3680/ha $2940/ha - $2625/ha
Gross Margin $2380/ha $1250/ha - $893/ha
Grazing revenue Fodder beet
Yield 26tDM 23tDM 26.5tDM
-Cost $2535/ha $2331/ha 2815/ha
-Income $5980/ha $4830/ha $5565/ha
-Gross Margin $3444/ha $2499/ha $2749/ha
-Yield test methods Commercially tested Tested on farm Commercially tested Tested on farm
22
4.3
Case study qualitative information
Table 2 Case study farms qualitative information
5
Pilot study
5.1
Initial Overseer analysis
A necessary component of the project is analysing the surveyed farms with OVERSEER to assess their nutrient budgets in relation to current and impending Environment Canterbury regulations.
Overseer, while used as a regulatory tool for nutrient management for farms within the Canterbury region, has shortcomings in accuracy and reliability (Williams et al., 2013). Designed to model pastoral system nutrient flows, it is inconsistent for cropping and horticulture.
An initial analysis of kale and fodder beet wintering systems using Overseer found an anomaly which limited confidence in the results when directly comparing the two crops. Overseer has upper and lower feeding limits for crops, which varied with crop yield and crop type (as seen in table 3 below).
Crop rotation
Fodder beet> barley> pasture for 3 years> Kale> barley> Pasture for 3 years
Pasture> Fodder beet (spring)> fallow> Kale (spring)> Barley> Greenfeed oats
Fodder beet> Fodder beet> Barley grain> Pasture for 3 years
Pasture> Kale> Cereal (barley or wheat) > Rape> Pasture for 3 years
Fertiliser use practises Kale
when Olsen P<20 then NPKS is 170:60:60:3 when Olsen P>20 NPKS is 156:45:70:2
200kg/ha DAP at sowing, 2x 150kg/ha Urea, early January and Mid february.
-250kg/ha borated DAP at sowing, 100kg/ha Urea January, 150kg/ha Urea March.
Fodder beet
when K<7 NPKS is
129:45:105:26 when K>7 NPKS is 91:41:30:18
200kg/ha DAP + 150kg/ha KCl + 80kg/ha Kieserite + 20kg/ha NaCl at sowing. 150kg/ha Urea mid February
385kg/ha Fodder beet Base (Ballance) + 5t/ha poulfert
-Farm A Farm B Farm C Farm D
Contracts/ relationships Long term winter grazing contract with Southern Pastures Dairy fams.
Regular winter dairy graziers Regular winter dairy graziers Family connection to dairy farm.
Reason for wintering
crop selection Fodder beet and kale work together well as feed sources and crop rotation.
Kale been grown on farm historically- easy and simple. Fodder beet has higher crop potential on smaller area.
Historically grew kale but yields were dropping and contracted winter grazing wanted FB so switched.
Kale used as simple and safe feed, and used historically. Fits pasture rotation and renewal and is profitable.
Outlook going forward
Whole farm system is based on dairy support,
Needs higher profit for winter grazing to be continued.
Needs higher profit for winter grazing to be continued.
-Animal Health Acidosis common on fodder beet, not kale. Break out over wires more common in fodder beet.
Fodder beet is higher risk for animal health- acidosis and death, than kale.
- Kale is simple to grow and is a safe feed.
Soil Damage
Fodder beet suffers heavier pugging damage than Kale
-Historical kale yields dropping, soil responds better to fodder beet now
23
Table 3 OVERSEER upper and lower feeding limits
Considering industry practice allocates 11kgDM crop/ head/day, four of the scenarios modelled above are feeding below industry standard (Industry standard feed levels of 11kgDM/day of crop along with 3kgDM/day of supplement are used in a number of animal trials (Edwards, deRuiter, et al., 2014; Farrell, 2015; Rugoho, 2013)). The crop type, or crop yield should not influence animal feed allocation. This indicates that Overseer has models and equations within the program which allocate feed based on crop type and crop yield, rather than animal energy requirement. As the complex models within Overseer are not public knowledge, it was impossible to determine how feed levels are allocated between different crops and crop yields and overcome this issue. Being unable to match feed allocation of crops on Overseer to the feed allocation of common wintering systems (a comparative study was considered impractical) and so an alternate method was used for the comparison.
5.2
Thought experiment
Due to differences in feeding levels (and thus energy intake) associated with the yields and crop varieties, it was determined that a direct comparison between fodder beet and kale using Overseer was not beneficial. To overcome its shortcomings a thought experiment based on published data has been conducted and is used to “create a story” to compare fodder beet and kale as winter fodder crops and assess the relative influences on N leaching.
5.2.1
Model parameters:
1000 cows to be wintered off farm on 3rd party dairy support.
Friesian-Jersey cross bred cows, average of 500kg live weight (LW).
Dry cows in calf with a 35kg LW calf, calving 1st August.
Min feed intake Max feed intake
Crop Yield
Kale 8tDM/ha 8.2 11.7
16tDM/ha 11.7 15.5
Fodder Beet 15tDM/ha 6.9 9.7
29tDM/ha 8.8 12
24
Wintered on either fodder beet or kale for 61 days (1st June to 31st July).
Feed offered 14kgDM/head/day, 11kgDM crop, and 3kgDM barley straw; as this has been identified as common practice from case study farmers.
5.2.2
Nitrogen application required for fodder beet and kale crops
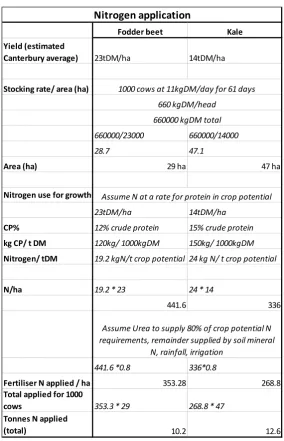
Table 4 Thought Experiment- Nitrogen Application
To winter 1000 cows at 11kgDM/crop/day for 61 days requires 29 ha of fodder beet, or 47 ha of kale. The high yield of fodder beet (23tDM/ha) relative to kale (14tDM/ha) requires a higher stocking rate so less land is required.
Fodder beet Kale Yield (estimated
Canterbury average) 23tDM/ha 14tDM/ha
Stocking rate/ area (ha)
660000/23000 660000/14000
28.7 47.1
Area (ha) 29 ha 47 ha
Nitrogen use for growth
23tDM/ha 14tDM/ha
CP% 12% crude protein 15% crude protein
kg CP/ t DM 120kg/ 1000kgDM 150kg/ 1000kgDM
Nitrogen/ tDM 19.2 kgN/t crop potential 24 kg N/ t crop potential
N/ha 19.2 * 23 24 * 14
441.6 336
441.6 *0.8 336*0.8
Fertiliser N applied / ha 353.28 268.8
Total applied for 1000
cows 353.3 * 29 268.8 * 47
Tonnes N applied
(total) 10.2 12.6
Assume Urea to supply 80% of crop potential N requirements, remainder supplied by soil mineral
N, rainfall, irrigation Nitrogen application
1000 cows at 11kgDM/day for 61 days 660 kgDM/head
660000 kgDM total
25
Nitrogen application is assumed to be at 80% of crop requirements for the estimated crop yield. Crop fertiliser requirements are determined by the crude protein proportion of each crop (12% for fodder beet (Oswald, 2011) and 15% for kale (DairyNZ, 2015)).
Fodder beet requires 353kgN/ha applied, 10.2 tonnes of nitrogen in total. Kale requires 269kgN/ha, 12.6 tonnes of nitrogen in total.
5.2.3
Nutrition requirements for dry dairy cows over winter
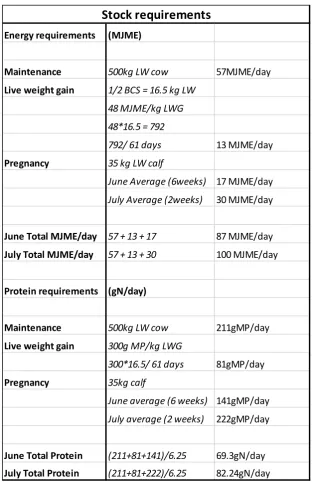
Table 5 Thought Experiment- Stock Nutrition Requirements
Energy requirements (MJME)
Maintenance 500kg LW cow 57MJME/day
Live weight gain 1/2 BCS = 16.5 kg LW 48 MJME/kg LWG
48*16.5 = 792
792/ 61 days 13 MJME/day
Pregnancy 35 kg LW calf
June Average (6weeks) 17 MJME/day
July Average (2weeks) 30 MJME/day
June Total MJME/day 57 + 13 + 17 87 MJME/day
July Total MJME/day 57 + 13 + 30 100 MJME/day
Protein requirements (gN/day)
Maintenance 500kg LW cow 211gMP/day
Live weight gain 300g MP/kg LWG
300*16.5/ 61 days 81gMP/day
Pregnancy 35kg calf
June average (6 weeks) 141gMP/day
July average (2 weeks) 222gMP/day
June Total Protein (211+81+141)/6.25 69.3gN/day
July Total Protein (211+81+222)/6.25 82.24gN/day
26
Stock requirements for energy and protein are calculated using equations given in Pasture and Supplements (Nicols and Brookes, 2007). As stated in 3.2.1, nutrition requirements are calculated for a 500kgLW cow, gaining half a body condition score (16.5kg LW) and supporting a foetus growing into a 35kgLW calf. Protein (in metabolisable protein, MP) and energy (in mega joules of
metabolisable energy, MJME) requirements are averaged separately for June and July due to the increasing pregnancy requirements over winter.
27
5.2.4
Daily nutrition supplied by a 11kgDM crop and 3kg DM supplement diet
Table 6 Thought Experiment- Diet Nutrition
Fodder beet
12.5MJME/kgDM ( Gibbs, 2011)
12% crude protein (Oswald, 2011; DairyNZ, 2015)
95% utilisation (Gibbs, 2014; Edwards et al., 2014)
Kale
11.5MJME/kgDM (DairyNZ, 2015)
15% crude protein (DairyNZ, 2015)
Fodder beet Kale Energy /cow/day 12.5 MJME/kgDM 11.5 MJME/kgDM
(MJME) 12.5 * 11 11.5 *11
137.5 126.5
at 95% utilisation at 80% utilisation
137.5* 0.95 126.5 *0.8
130.625 101.2
PLUS
Total MJME/cow/day 130.6 + 16.8 101.2 + 16.8
147.4 117.9
Protein/cow/day 12% CP 15% CP
11 *12% = 1.32 kgCP 11 * 15% = 1.65kgCP 1.32/6.25 = 211g N/day 1.65/ 6.25 = 264gN/day at 95% Utilisation at 80% Utilisation
200.5 211.2
PLUS
Total gN/cow/day 200.5 + 19.2 211.2 +19.2
219.7 230.4
3kgDM barley straw/ head/day 5% CP * 3kgDM = 150gCP 150/6.25*80% = 19.2gN/head/day
3kgDM barley straw/ head/day Daily nutrition
21 *80% utilisation 3 * 7 MJME/kgDM
28
80% utilisation (DairyNZ, 2015; Judson, 2008)
The fodder beet and straw diet provides 147.4 MJME/head/day and 219.7gN/head/day. The kale and straw diet provides 117.9MJME/head/day and 230.4gN/head/day.
5.2.5
Nitrogen balance for the 1000 cow wintering system
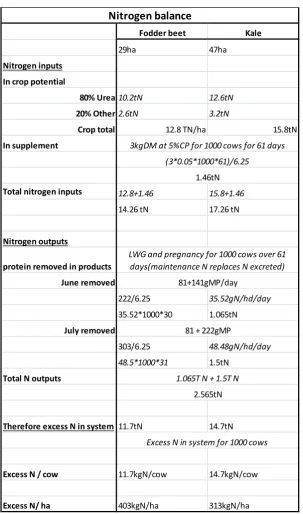
Table 7 Thought Experiment- Nitrogen Balance
Fodder beet Kale
29ha 47ha
Nitrogen inputs In crop potential
80% Urea10.2tN 12.6tN
20% Other2.6tN 3.2tN
Crop total 12.8 TN/ha 15.8tN
In supplement
Total nitrogen inputs 12.8+1.46 15.8+1.46
14.26 tN 17.26 tN
Nitrogen outputs
protein removed in products June removed
222/6.25 35.52gN/hd/day
35.52*1000*30 1.065tN
July removed
303/6.25 48.48gN/hd/day
48.5*1000*31 1.5tN
Total N outputs
Therefore excess N in system 11.7tN 14.7tN
Excess N / cow 11.7kgN/cow 14.7kgN/cow
Excess N/ ha 403kgN/ha 313kgN/ha
Nitrogen balance
81 + 222gMP
2.565tN
1.065T N + 1.5T N
Excess N in system for 1000 cows 3kgDM at 5%CP for 1000 cows for 61 days
(3*0.05*1000*61)/6.25
1.46tN
LWG and pregnancy for 1000 cows over 61 days(maintenance N replaces N excreted)
29
Nitrogen inputs and outputs to the 1000 cow dairy wintering system were calculated. Nitrogen input to the system (from fertiliser, soil mineralisation and supplement imported) is 14.26 tonnes nitrogen for fodder beet, and 17.26 tonnes of nitrogen for kale. Nitrogen removed in products (animal live weight gain and pregnancy) is calculated at 2.56 tonnes of nitrogen for 1000 cows. Maintenance nitrogen replaces the excreted endogenous nitrogen. Excess nitrogen in the system is calculated at 11.7kgN/cow for fodder beet, vs 14.7kgN/cow for kale. However per hectare there is 403kgN/ha excess for fodder beet, and 313kgN/ha excess for kale.
Not all excess N is leached- some will be lost to ground water, some lost to atmosphere through volatilisation and de-nitrification and some will remain in the soil either immobilised or as part of the organic soil pool. The extent of the partitioning of the excess N within the system is beyond the scope of this thought experiment and research.
Key assumption:
Feeding levels are reasonable for winter grazing, based on case study farms. However according to a recent study wintering dry dairy cows should be fed in excess of 150MJME/head/day to meet all energy requirements (Edwards, 2014). This disparity between calculated feed requirements and nutrient intake needed has been highlighted before (see Edwards 2014). So assumptions are actually underfeeding the dry stock- more so for cows on Kale.
5.2.6
Conclusions from thought experiment
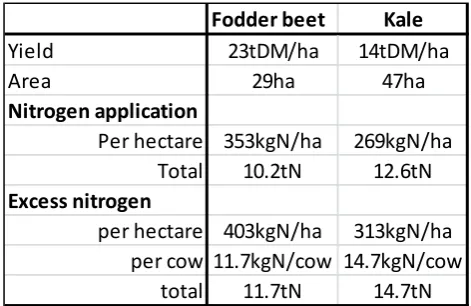
Table 8 Fodder beet and Kale nitrogen use comparison (for 1000 cows)
Fodder beet is a higher yielding crop than kale, with a lower crude protein content. Due to its high yielding energy dense crop, fodder beet can winter 1000 dairy cows on only 29ha, as opposed to kale’s 47ha. Fodder beet requires less nitrogen per tonne of dry matter (low crude protein content),
Fodder beet Kale
Yield 23tDM/ha 14tDM/ha
Area 29ha 47ha
Nitrogen application
Per hectare 353kgN/ha 269kgN/ha
Total 10.2tN 12.6tN
Excess nitrogen
per hectare 403kgN/ha 313kgN/ha per cow 11.7kgN/cow 14.7kgN/cow
30
but more nitrogen per hectare grown (due to its high yield) than kale. Total nitrogen use is less for fodder beet than kale, to feed 1000 cows, at 10.2 ton vs 12.6 ton.
A fodder beet diet provides more energy than a kale diet, due to its high water soluble carbohydrate content, resulting in a low fibre high energy feed. While both the kale and the fodder beet diets provide more than the calculated daily energy requirements for the dry stock, neither diet provides more than 150MJME/head/day eaten (after wastage), as recommended in a study by (Edwards, 2014) to achieve body condition score gain of a half score over the winter period.
31
6
Management options for reducing nitrogen leaching
The input data in tables 9 and 10 was used as the base system to model the effect of various management systems on nitrogen leaching for both a 10ha kale crop and a 10ha fodder beet crop (not wintering 1000 cows). All management changes are easily achievable, with no large capital expenditure involved. The model inputs were chosen to reduce confounding factors in the model, so any changes can be easily assigned to a cause and effect.
The management options modelled included
Altering the nitrogen application rate up to the calculated requirement of nitrogen for a 23tDM/ha crop of fodder beet or a 14tDM/ha crop of kale. Nitrogen applied ranged from the nitrogen in 250kg DAP applied at sowing through increases of 100kgUrea increments, up to theoretical optimum application amount of 353kgN/ha for fodder beet and 269kgN/ha for kale, as determined in 5.2.2.
Altering the feed supplement selection. The five feed supplements used were barley straw, at 6.5MJME/kgDM and 4.5% crude protein, good quality grass silage, at 11MJME and 17% crude protein, Cereal silage at 9-10.5 MJME/kgDM and 13-16% crude protein, maize silage at 10 MJME/kgDM and 8% crude protein, and balage at 10MJME/kgDM and 11% crude protein (DairyNZ, 2015).The amount (in kgDM) allocated was kept constant for all supplements, feeding at a ratio of 11kgDM crop: 3kgDM supplement, at 38tDM for 10ha kale and 63tDM for 10ha fodder beet.
Altering the soil type the forage crops were grown on, using variety of soil types to determine the effect of soil on nitrate leaching. Soil types were selected along a spectrum from soils commonly found in Canterbury. These ranged from very light, well drained soils such as the Lismore sib 18, to very heavy poorly drained soils such as the Flaxton sib 4 soil.
Altering the length of fallow period for each crop after grazing. Modelling the effect of a paddock left fallow for spring or the effectiveness of a catch crop of oats in reducing
nitrogen leaching losses. A catch crop of forage spring oats was sown due to the crops ability to germinate early in spring whilst still cool soil temperatures.
32