EFFECT OF FEED RATE ON THE
GENERATION OF SURFACE
ROUGHNESS IN TURNING
M.RAMALINGA REDDY1
Professor ,Department of Mechanical Engineering CMR College of Engineering & Technology
Hyderabad, Andhra Pradesh, India E mail: [email protected]
P.RAVI KUMAR2
Associate Professor ,Department of Mechanical Engineering CMR College of Engineering & Technology
Hyderabad, Andhra Pradesh, India E mail: [email protected]
.
G.KRISHNA MOHANA RAO3
Associate Professor, Department of Mechanical Engineering JNTUH College of Engineering, JNT University
Hyderabad, Andhra Pradesh, India E mail: [email protected]
Abstract:
In this paper the effects of the feed rate on the generation of surface roughness in turning is analyzed. The studies include roughness profiles, their roughness indices and Fourier spectra. Since the resultant surface is basically the result of metal removal in the form of chips, additional studies include chip related phenomena such as chip morphology, direction of flow and curling of chips and morphology of machined surface. These have been studied under SEM.
Key words: Turning, feed rate, Surface roughness.
1. Introduction:
were obtained through Systat software. The chips were collected and studied under microscope for their morphology and curling behaviour. With a method of quick stop, the chip flow direction and curling pattern was studied with photos from digital camera when still attached to work piece. The morphology of surface and its roughness was further studied under SEM. The chip thickness and width were measured on a tool maker’s microscope by mounting sectioned chips in Bakelite moulds and polishing. The average of three such observations was taken to reduce the error component. The chip curling was studied by interrupted cut with chip still attached to work piece.
3. Experimentation:
3.1. Effect of feed rate
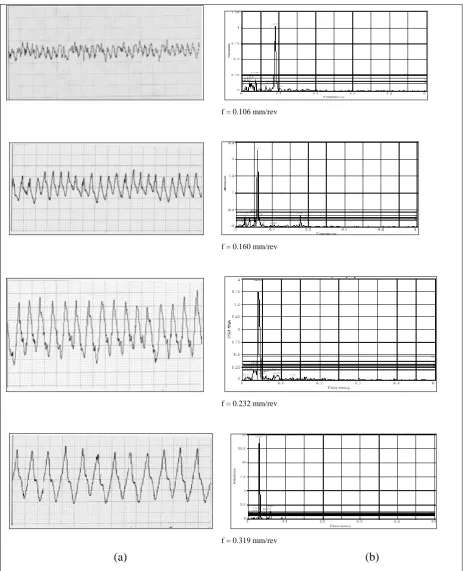
This is the most important factor in the generation of surface roughness. The effect of feed rate on the roughness profiles and their Fourier spectra are shown in Fig.3.1. The roughness indices are listed in Table 3.1. As expected the roughness increases with feed rate. On the roughness profiles, the feed marks also become clearer and prominent. At lower feed rates the roughness becomes independent of feed rate and is a function of nose radius only (1). This causes higher micro roughness i.e. superimposed irregularities over the grooves generated by chip removal. The plastic flow component is comparatively more. Similarly when feed rate is large and nose radius small, the surface roughness depends mainly on feed rate compared to nose radius. The plastic flow is opposite to feed direction with higher height at low feed rate which can also lead to higher roughness at low feed rate (2). Similar anomaly has been reported (3) where by lower roughness occurred at higher feed rates owing to pure cutting action and relative absence of swelling. In the same way at low feed rate material gets ploughed rather than form chips. In this way there exits a possibility of the existence of optimum feed rate. Though the theory suggests roughness to be a function of square of feed rate, in practice it is more like directly related to feed rate. This can be due to flattening of ridges due to side flow or tool work relative vibrations. These effects are corroborated by the Fourier transforms. The generation of several harmonics at lower feed rates due to ploughing action are clearly seen which conforms to the arguments presented for the micro roughness at low feed rates. The reduction in micro roughness and pronounced periodicity is seen with the diminishing harmonics which finally reduces to a single harmonic corresponding to feed rate. This again corroborates the previous argument that at high feed rate the dominant mechanism is of chip removal rather than plastic flow.
The increase in skewness which incidentally is positive shows the roughness profile to be valley biased more so at higher feed rate which again indicates metal or chip removal mechanism of roughness generation at high feed rates. The results are remarkably similar with Copper specimens also which lends high credence to the preceding results and discussion.
Table. 3.1. Effect of feed rate on roughness indices (Material: Mild Steel).
S.No Index
Feed rate (mm/rev) Remarks
0.106 0.160 0.232 0.319
All other factors kept constant 1 Ra(µm) 2.84 3.96 4.38 6.66
2 Rs -0.07 +0.16 +0.36 +0.42
Table. 3.2. Effect of feed rate on roughness indices (Material : Copper).
S.No Index
Feed rate (mm/rev) Remarks
0.106 0.160 0.232 0.319
All other factors kept constants 1 Ra(µm) 1.51 2.75 5.13 5.46
f = 0.106 mm/rev
f = 0.160 mm/rev
f = 0.232 mm/rev
f = 0.319 mm/rev
(a)
(b)
Fig. 3.1. Effect of feed rate on (a) roughness profile and (b) Fourier spectra (Material: Mild Steel).
f = 0.106 mm/rev
f = 0.160 mm/rev
f = 0.232 mm/rev
f = 0.319 mm/rev
(a)
(b)
Fig. 3.2. Effect of feed rate on (a) roughness profile and (b) Fourier spectra (Material: Copper).
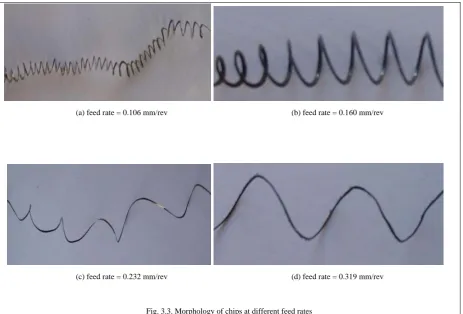
(a) feed rate = 0.106 mm/rev (b) feed rate = 0.160 mm/rev
(c) feed rate = 0.232 mm/rev (d) feed rate = 0.319 mm/rev
Fig. 3.3. Morphology of chips at different feed rates
The chips have normal helical shape with low pitch at low feed rate. With increase in feed rate the pitch goes on increasing and at high feed rate takes a ribbon form due to reduced plastic flow. The feed rate is equal to uncut chip thickness and its ratio with chip thickness is cutting ratio which increases with feed rate (Table.3.3.). It is an effect of lower swelling. This conforms to the theory that at lower feed rates the plastic flow is more . The chip width is unaffected.
Table 3.3. Chip characteristics at different feed rates.
S.No Parameter Feed rate (mm/rev) Remarks
0.106 0.160 0.232 0.319
1 tc 0.38 0.42 0.50 0.78 to = feed rate ( uncut chip thickness) tc = chip thickness
b = chip width
rc = cutting ratio = to/tc
depth of cut = 0.8mm ( uncut chip width) work material = MS
2 b 0.90 0.92 0.92 0.95
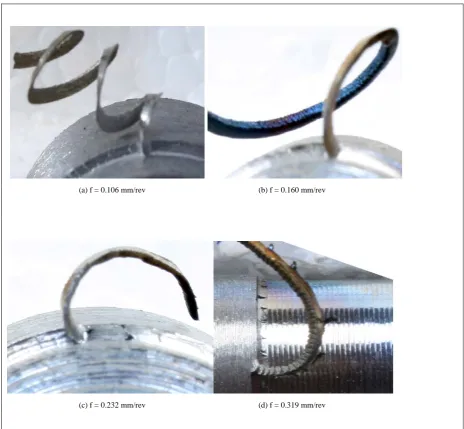
(a) f = 0.106 mm/rev (b) f = 0.160 mm/rev
(c) f = 0.232 mm/rev (d) f = 0.319 mm/rev
Fig. 3.4. Chip curling at different feed rates.
The side flow resulting in chip side curling with low feed rate is seen in Fig 3.5.(a) and with increase in the feed rate the curling is reduced. At still higher feed rates the chip side curl reduces with mainly up curling. The dominant mechanism of surface generation as chip removal is witnessed as finely grooved surface at Fig.3.5.(d) with an appearance akin to a screw thread and very high roughness.
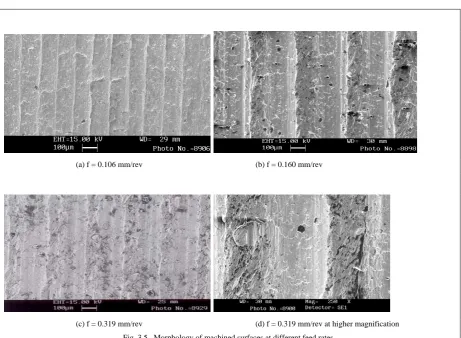
(a) f = 0.106 mm/rev (b) f = 0.160 mm/rev
(c) f = 0.319 mm/rev (d) f = 0.319 mm/rev at higher magnification Fig. 3.5.. Morphology of machined surfaces at different feed rates.
4. Conclusions:
The effect of feed rate is very high on the surface roughness and very clearly observed on the roughness profile as well as the Fourier spectra. Increase in roughness is generally considered to be a function of square of the feed rate. But here it appears to be a direct function due to the effect of swelling and side flow. At low feed rate the micro roughness is more seen in the presence of several frequencies. As the feed rate increases, the periodicity improves with reduction in interference of feed marks producing a uniform roughness profile with reduction in the number of harmonics present. Chip thickness and coil radius increase with increase in feed rate. The roughness furrows and ridges appear like a screw thread profile indicating chip removal to be the dominant mechanism of roughness generation at high feed rate.
References:
[1] Childs. T.H.C., Sekiya. K., Tezuka. R., Yamane. Y., Dornfeld. D., Lee. D.E., Min. S. and Wright. P.K., “Surface finishes from turning and facing with round nosed tools ”, Annals of CIRP, V-57, 2008, pp.89-92.
[2] Abouelatta. O.B. and Madi. J., “ Surface roughness prediction based on cutting parameters and tool vibration in turning operations ”, Journal of Materials Processing Technology, 118, 2001, pp.269-277