INTERNATIONAL RESEARCH JOURNAL OF PHARMACY
www.irjponline.com
ISSN 2230 – 8407
Research Article
DEVELOPMENT AND VALIDATION OF ANALYTICAL METHOD FOR SIMULTANEOUS ESTIMATION
OF SAXAGLIPTIN AND METFORMIN HCl BY USING RP-HPLC METHOD
Vijaya U. Barge *, Fainaz M. Chaudhari, Riya B. Gaikwad, Tejaswini R. Kande
Pune District Education Association’s, Shankarrao Ursal College of Pharmaceutical Sciences and Research Centre,
Kharadi, Pune, India
*Corresponding Author Email: [email protected]
Article Received on: 29/05/18 Approved for publication: 29/06/18
DOI: 10.7897/2230-8407.096106
ABSTRACT
A simple, rapid and selective HPLC method has been developed for quantitation of Saxagliptin and Metformin HCl from bulk drug and pharmaceutical formulations using a mobile phase consisting mixture of methanol and phosphate buffer pH-5.0 (70:30 v/v) at the flow rate of 1 ml/min. Waters C-8 (25 cm x 4.6 mm, 5 µm.) column was used as stationary phase. The retention time of Metformin HCl and Saxagliptin were 2.8 min. and 4.9 min. respectively. Linearity was observed in the concentration range of 2.5-12.5 µg/mL for Saxagliptin and 250-1250 µg/ml for Metformin HCl. Percent recoveries obtained for Saxagliptin and Metformin HCl were 102 and 101 respectively. The proposed method is precise, accurate, selective and rapid for the simultaneous determination of Saxagliptin and Metformin HCl.
Keywords: Saxagliptin, Metformin HCl, RP-HPLC Method, Validation
INTRODUCTION
Saxagliptin is chemically designated as (1S, 3S, 5S)-2-[(2S)-2-amino-2-(3-hydroxyadamantan-1-yl)acetyl]-2- azabicyclo [3.1.0] hexane-3-carbonitrile. It is an anti-diabetic drug. Metformin HCl
is 1-carbamimidamido-N,N-dimethylmethanimidamide and used
as anti-diabetic drug. Detailed survey of literature for Saxagliptin
and Metformin HCl revealed several methods based on techniques viz. HPLC spectrophotometric for its determination in pharmaceutical dosage form. However, very few methods has been developed for estimation of these drugs in combined dosage form. This paper presents simple, rapid, reproducible and economical method for RP-HPLC simultaneous estimation of Saxagliptin and Metformin HCl in bulk and pharmaceutical dosage form. 1-3
MATERIALS & METHOD
Reagents and Chemicals
The solvents used were of HPLC grade. Double distilled water was used in preparation of mobile phase. Pure drug sample of Saxagliptin was produce from Swapnroop Drugs and Pharmaceuticals and Metformin HCl from Lupin Ltd.
Apparatus and Chromatographic Conditions
Chromatographic separation was performed on a Thermo U.S.A HPLC system consisting of P1000 pump, UV 200 detector, Hamilton syringe with 20 µl loop volume and windows based ChromQuest 4.1 software. An C18 RP-Column (Waters 4.6 mm x 25 cm, 5 µm) was used for separation. The elution was carried out isocratically at flow rate of 1 ml/min using methanol:phosphate buffer pH-5.0 (70:30 v/v) mobile phase.
Preparation of standard stock solution
Standard stock solutions were prepared by dissolving 5.0 mg of Saxagliptin and 500.0 mg of Metformin HCl in 10 ml Methanol that give concentration 500 and 50000 µg/ml for Saxagliptin and Metformin HCl respectively. From the standard stock solutions, mixed standard solutions of Saxagliptin and Metformin HCl was prepared.
Preparation of sample solution
Four tablets were weighed, and the average weight was determined. Accurately weighed tablet powder equivalent to 5 mg Saxagliptin and 500 mg of Metformin HCl (i.e. 1197 mg) was transferred in a 10 ml volumetric flask and methanol was added. It was sonicated for 10 to 15 minutes. Later the volume was made up to mark with methanol. The solution was filtered through 0-0.45 µm filter paper.
VALIDATION 4-12
Linearity
The linearity of an analytical procedure is its ability (within a given range) to obtain test results which are directly proportional to the concentration (amount) of analyte in the sample.
Precision
Accuracy
The accuracy of an analytical method was determined by applying the method to analyzed samples, to which known amounts of analyte have been added. The accuracy was calculated from the test results as the percentage of analyte recovered by the assay. The results of recovery studies and statistical data are recorded.
Limit of Detection and Limit of Quantitation
The LOD can be defined as the smallest level of analyte that gives a measurable response and LOQ was determined as the lowest amount of the analyte that was reproducibly quantified. These two parameters were calculated using formula based on standard deviation of the response and slope. LOD and LOQ were calculated by the equation, LOD=3.3 x ϭ/s and LOQ= 10 x ϭ/s, where s = standard deviation, S = slope of calibration curve.
Robustness
It is measure of capacity of the method to remain unaffected by small but deliberate variation in method parameter and provide an indication of its reliability under normal usage.
Robustness of method was studied by deliberately changing the chromatographic parameters such as flow rate, mobile phase composition & wavelengths.
Assay
20 µl of standard and sample solutions were injected into an injector of liquid chromatograph, from the peak area of Saxagliptin and Metformin HCl amount of drug in samples were computed.
Table 1: Chromatographic Condition
Chromatographic mode Chromatographic condition
HPLC system Thermo (USA)
Pump P1000
Detector UV200
Data processor ChromQuest 4.1
Stationary phase RP C8 (Waters)
Mobile phase Methanol:Phosphate buffer pH-5.0 (70:30 v/v)
Wavelength 228 nm
Flow rate 1 ml/min
Sample size 20 µl
Column temperature Ambient
Table 2: System suitability parameter
Sr. No. Peak Area Tailing Factor Theoretical Plate
Saxa Met Saxa Met Saxa Met
1 585.23 8583.68 1.6865 1.1091 4634 2967 2 586.23 8580.60 1.6476 1.1466 4600 2956 3 583.98 8581.68 1.7199 1.1400 4675 2919
Mean - 585.1467 8581.987 1.6846 1.1319 4636.333 2947.333
±SD - 1.12 1.56 0.04 0.02 37.55 25.14
%RSD - 0.19 0.01 2.37 1.76 0.80 0.85
Table 3. Linearity
Saxagliptin Metformin HCl
Conc. (µg/ml) Peak area Conc. (µg/ml) Peak area
2.5 191.45 250 2843.40
5.0 384.60565 500 5696.725
7.5 585.77195 750 8673.685
10.0 755.0683 1000 11115.25
12.5 954.69 1250 13751.20
Figure 2. Calibration curve of Saxagliptin Figure 3. Calibration curve of Metformin HCl
Table 4.1. Precision studies for Saxagliptin
Sr. No. Conc. µg/ml
Measured area ± S.D, RSD (%)
Repeatability (n=2) Intermediate Precision (n=2)
1 2.5 187.33 ± 0.46, 0.25 189.67 ± 0.96, 0.51
⁴ 7.5 585.80 ± 0.80, 0.14 582.33 ± 2.46, 0.42
3 12.5 954.98 ± 0.36, 0.04 952.61 ± 1.94, 0.20
Table 4.2. Precision studies for Metformin HCl
Sr. No. Conc. µg/ml
Measured area ± S.D, RSD (%)
Repeatability (n=2) Intermediate Precision (n=2)
1 250 2894.27 ± 2.14, 0.07 2894.78 ± 6.46, 0.22
⁴ 750 8582.67 ± 1.42, 0.02 8574.22 ± 1.26, 0.01
3 1250 13762.5 ± 6.48, 0.05 13753.26± 3.82, 0.03 The % RSD in two replicates was not more than 2.0%, hence the method was found to be precise.
Table 5. Recovery data for Saxagliptin and Metformin HCl
Drugs Spiked level % % Recovery % R.S.D.
Saxagliptin 80 101.50 0.91
100 99.62 0.60
120 97.38 1.02
Metformin HCl 80 101.55 0.13
100 97.46 0.69
120 96.23 0.18
Table 6. Results of LOD and LOQ
Drugs LOD (µg/ml) LOQ (µg/ml)
Saxagliptin 0.14 9.33
Metformin HCl 0.44 28.30
Robustness results
Table 7.1. Effect of variation in Flow rate of mobile phase by ±1%
Sr. No. Flow rate Conc. (µg/ml) Mean S.D. % R.S.D.
Saxa Met Saxa Met Saxa Met Saxa Met
1 0.9 5 500 463.72 6884.14 0.33 28.47 0.07 0.41
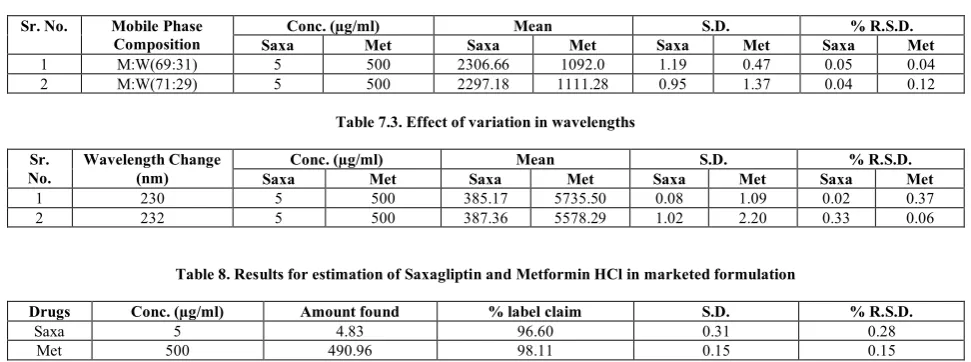
Table 7.2. Effect of variation in mobile phase composition by±1 % v/v
Sr. No. Mobile Phase Composition
Conc. (µg/ml) Mean S.D. % R.S.D.
Saxa Met Saxa Met Saxa Met Saxa Met
1 M:W(69:31) 5 500 2306.66 1092.0 1.19 0.47 0.05 0.04
2 M:W(71:29) 5 500 2297.18 1111.28 0.95 1.37 0.04 0.12
Table 7.3. Effect of variation in wavelengths
Sr. No.
Wavelength Change (nm)
Conc. (µg/ml) Mean S.D. % R.S.D.
Saxa Met Saxa Met Saxa Met Saxa Met
1 230 5 500 385.17 5735.50 0.08 1.09 0.02 0.37
2 232 5 500 387.36 5578.29 1.02 2.20 0.33 0.06
Table 8. Results for estimation of Saxagliptin and Metformin HCl in marketed formulation
Drugs Conc. (µg/ml) Amount found % label claim S.D. % R.S.D.
Saxa 5 4.83 96.60 0.31 0.28
Met 500 490.96 98.11 0.15 0.15
RESULTS AND DISCUSSION
The HPLC procedure was optimized with a view to develop accurate and stable assay method. Waters C8 column with a mobile phase of mixture of methanol and phosphate buffer pH-5.0 (70:30 v/v), delivered at a flow rate of 1.0 ml/min with detection at 228 nm gave sharp and symmetrical peak with retention time 2.8 and 4.9 min for Metformin HCl and Saxagliptin respectively. The typical chromatogram of the sample is shown in Fig. 1.
Linearity response for both Saxagliptin and Metformin HCl were found to be linear in concentration range of 2.5-12.5 µg/ml and 250-1250µg/ml respectively. The slope and intercept value for calibration curve was y = 75.87x + 5.234 (R2 = 0.999) for
Saxagliptin and y = 10.89x + 245.8 (R2 = 0.998) for Metformin
HCl. The results show that an excellent correlation exists between peak area and concentration of drugs within the concentration range indicated above.
The % RSD in two replicates for precision studies was not more than 2.0 % hence the method was found to be precise. Percentage recovery for both drugs Saxagliptin and Metformin HCl was found in range of 97.38-101.50 % and 96.23-101.55 % indicating accuracy of the proposed work. The LOD value of Saxagliptin and Metformin HCl was found to be 0.14 µg/ml and 9.33 µg/ml respectively. The LOQ value of Saxagliptin and Metformin HCl was found to be 0.44 µg/ml and 28.30 µg/ml respectively. The results of the robustness study also indicated that the method is robust and is unaffected by deliberate variation in the chromatographic conditions. The % label claim of Saxagliptin and Metformin HCl was found to be 98.57 % and 98.05 % respectively with % RSD not more than 2.
Hence, it can be concluded that the developed RP-HPLC method is accurate, precise, & selective and can be employed successfully for the estimation of Saxagliptin and Metformin HCl in bulk and pharmaceutical dosage formulation.
CONCLUSION
The developed UV and RP-HPLC methods are precise, specific, accurate. Statistical analysis proves that these methods are suitable for the analysis of Saxagliptin and Metformin HCl in bulk and pharmaceutical formulation without any interference from the excipients. These methods have been found to be better than
compared to acetronitrile and no use of tedious and time consuming procedures. All these factors using these methods make easy quantification of drugs in bulk and pharmaceutical dosage form. It can therefore be concluded that use of these methods can save much time and money and hence can be used in small laboratories with very high accuracy over a wide linear range.
ACKNOWLEDGEMENT
The authors are thankful to Pune District Education Association’s, Shankarrao Ursal College of Pharmaceutical Sciences & Research Center, Kharadi, Pune, for providing all the necessary facilities, and to Swapnroop Drugs and Pharmaceuticals and Lupin Ltd., Pune for the gift samples of Saxagliptn and Metformin HCl are required for the research work. The authors are also thankful to all the teaching and non-teaching staff and the colleagues for their constant support. Hearty thanks to our parents.
REFERENCES
1. Saxagliptin: A clinical review in the treatment of type 2 diabetes mellitus. Clin There. 2011, 1005-1022.
2. Roy B, Dubey S, Roy K, Kiran B. Development and validation of a reverse phase HPLC method for the determination of Metformin HCl in pharmaceutical dosage forms. Asian Journal of Chemistry 2012;24(12): 5460-5462. 3. Sarat M, Murali Krishna P, Rambabu C. RP-HPLC method for simultaneous estimation of saxagliptin and pioglitazone in tablets. International Research Journal of Pharmacy 2012; 399-402.
4. International conference on harmonization. Validation of analytical procedures Methodology 14, Federal Register Nov.1996; 1-8.
5. Deshpande S, Roy M, Daswadkar S, Development and validation of UV spectrophotometric method for estimation of Saxagliptin in bulk and pharmaceutical dosage form. International journal of pharmaceutics & drug analysis 2016; 4(1): 30–34.
Saxagliptin in tablets. Rasayan journal of chemistry 2012; 5(2): 137-141.
8. Prasanna A, Priyanka K. Method development and validation of simultaneous determination of Metformin and Saxagliptin in pharmaceutical dosage form by RP-HPLC. International journal of pharmaceutical, chemical and biological sciences 2015; 5(1): 381-387.
9. Thangabalan B, Srisowmya P, Manohar Babu S. Method development and validation for simultaneous estimation of Saxagiptin and Metformin in tablet dosage form by RP-HPLC method. International journal of pharmacy and analytical research 2014; 3(4): 363–369.
10.Caglar S, Rahmi Alp A. A validated High Performance Liquid Chromatography method for the determination of Saxagliptin and Metformin in bulk, a stability indicating study. Analytical & Bioanalytical Techniques 2014; 812. 11.Chhabda P, Balaji M, Srinivasarao V, Ramakrishna K,
Apparao K. Devolpment and validation of simple stability
indicating RP-HPLC method for analysis of Saxagliptin and its forced degradation impurities in bulk drug and pharmaceutical dosage form. International Journal of Research and Development in Pharmacy and Life Sciences 2014; 993-1003.
12.Prasad P, Satyanaryana K, Krishnamohan G. Development and validation of a method for simultaneous determination of Metformin and Saxagliptin in a formulation by RP-HPLC. American Journal of Analytical Chemistry 2015; 841-850. Cite this article as:
Vijaya U. Barge et al. Development and validation of analytical method for simultaneous estimation of Saxagliptin and Metformin HCl by using RP-HPLC method. Int. Res. J. Pharm. 2018;9(6):142-146 http://dx.doi.org/10.7897/2230-8407.096106
Source of support: Nil, Conflict of interest: None Declared