Randomized Trial of Nutrient-Enriched Formula Versus Standard Formula
for Postdischarge Preterm Infants
Alan Lucas, MD, FRCP, FRCPCH*; Mary S. Fewtrell, MD, FRCPCH*; Ruth Morley‡; Atul Singhal, MD, FRCPCH*; Rebecca A. Abbott§; Elizabeth Isaacs*; Terence Stephenson储;
Una M. MacFadyen¶; and Helena Clements储
ABSTRACT. Objectives. Preterm infants are fre-quently discharged from the hospital growth retarded and show reduced growth throughout childhood. In a large efficacy and safety trial, we tested the hypothesis that nutritional intervention in the first 9 months post-term would reverse postdischarge growth deficits and improve neurodevelopment without adverse safety out-comes.
Participants and intervention. Two hundred eighty-four infants (mean gestation: 30.9 weeks) were studied; 229 were randomly assigned a protein, energy, mineral, and micronutrient-enriched postdischarge formula (PDF;
Nⴝ113) or standard term formula (TF;Nⴝ 116) from discharge (mean 36.5 weeks’ postmenstrual age). A refer-ence group (Nⴝ65) was breastfed until at least 6 weeks’ postterm.
Outcome measures. Anthropometry was performed at
6 weeks and 3, 6, 9, and 18 months. Development was measured at 9 months (Knobloch, Passamanick, and Sherrard’s developmental screening inventory) and 18 months (Bayley Scales of Infant Development II; primary outcome) postterm.
Results. At 9 months, compared with the TF group, those fed PDF were heavier (difference 370 g; 95% con-fidence interval [CI]: 84 – 660) and longer (difference 1.1 cm; 95% CI: 0.3–1.9); the difference in length persisted at 18 months (difference 0.82 cm; 95% CI:ⴚ0.04 –1.7). There was no effect on head circumference. The effect of diet was greatest in males; at 9 months length deficit with TF was 1.5cm (95% CI: 0.3–2.7), and this remained at 18 months (1.5cm [95% CI: 0.3–2.7]). There was no signifi-cant difference in developmental scores at 9 or 18 months, although PDF infants had a 2.8 (ⴚ1.3– 6.8) point advantage in Bayley motor score scales. At 6 weeks’ post-term, exclusively breastfed infants were already 513 g (95% CI: 310 –715) lighter and 1.6cm (95% CI: 0.8 –2.3) shorter than the PDF group, and they remained smaller up to 9 months’ postterm.
Conclusions. 1) Improving postdischarge nutrition in the first 9 months may “reset” subsequent growth—at least until 18 months for body length. We intend to
follow-up the children at older ages. The observed effi-cacy of PDF was not associated with adverse safety out-comes. 2) We cannot reject the hypothesis that postdis-charge nutrition benefits motor development and this requires additional study. 3) Our data raise the possi-bility that breastfed postdischarge preterm infants may require nutritional supplementation, currently under investigation.Pediatrics2001;108:703–711;preterm infant, growth, neurodevelopment, randomized trial, diet.
ABBREVIATIONS. PDF, postdischarge formula; TF, term formula; MUAC, mid-upper arm circumference; SD, standard deviation; CI, confidence interval.
C
onsiderable attention has been directed to-ward improving the nutrition of preterm fants while they are in hospital. This has in-cluded the development of special nutrient-enriched formulas designed to meet the projected increased nutritional needs of preterm infants, and multinutri-ent fortifiers, which can be added to human milk. Long-term outcome data now show the neonatal period to be a critical one in terms of the effects of nutrition on later health and developmental out-comes.1–3However, until recently relatively littleat-tention had been paid to the postnatal nutrition of these infants after discharge from hospital. At this rather arbitrary time point, breast milk fortifiers are usually stopped, or the infant commonly changed onto a formula designed for healthy term infants. Our previous studies suggest that preterm infants are commonly discharged weighing little more than half the appropriate weight for a term infant at the equivalent postmenstrual age. Of more concern, ⬎30% of these infants remained below the tenth percentile for weight at 18 months, and⬎20% at 7 to 8 year follow-up.4 A key question is whether such
infants have special nutritional requirements in the postdischarge period and, in more biological terms, whether this period of nutrition is also a critical one for later health and development.
The observed small size of preterm infants at hos-pital discharge is associated with reduced body stores of a variety of specific nutrients. The trend toward earlier discharge of preterm infants means that the opportunity to provide mineral supplements is reduced and many are discharged with undermin-eralized bones because of a poor intake of calcium and phosphorus.5–7 Although some studies suggest From the *MRC Childhood Nutrition Research Centre, Institute of Child
Health, London, England; ‡University of Melbourne Department of Paedi-atrics and Murdoch Children’s Research Institute, Melbourne, §School of Human Movement Studies, Queensland Institute of Technology, Brisbane;
储Academic Division of Child Health, University Hospital, Nottingham, ¶Paediatric Department, Stirling Royal Infirmary NHS Trust, Stirling, Aus-tralia.
Received for publication Jul 8, 2000; accepted Feb 12, 2001.
that there is catch-up in bone mass during infancy,8,9
the effect of early mineral deficiency on final height and peak bone mass is unknown, and we recently demonstrated an association between biochemical evidence of early metabolic bone disease and re-duced stature up to 12 years later.10Calculations of
accretion rates of iron, zinc, and copper in hypothet-ical well, very low birth weight infants fed to current standards show that they have suboptimal status compared with term infants of equivalent postmen-strual age.11Zinc status is of particular concern given
evidence for its role in growth and brain develop-ment.12
Over a decade ago, we designed a nutrient-en-riched formula for use in preterm infants after hos-pital discharge (postdischarge formula [PDF]). This formula, which is intermediate in composition be-tween preterm and term formulas, contains predom-inantly an increase in protein, with sufficient extra energy to permit utilization. It also contains extra calcium and phosphorus and zinc, deficits of which might limit linear growth, together with additional vitamins and trace elements to support the projected increased growth performance. In a pilot study on 32 preterm infants,13 those randomized to receive the
PDF up to 9 months’ postterm showed significantly greater weight and length gains while on the diet, and had higher bone mineral content in the distal radius than infants who received a standard term infant formula.14These findings raised the
hypothe-sis that improved nutrition in preterm infants during the first few months after hospital discharge might ameliorate the growth deficits seen in these infants. However, this small pilot study did not address the question of whether the growth benefit would persist beyond the neonatal period, nor whether it would have any long-term consequences for neurodevelop-ment.
We therefore tested these hypotheses in a large, randomized trial in postdischarge preterm infants comparing the nutrient-enriched formula with stan-dard term formula up to 9 months’ postterm.
METHODS Protocol
Preterm infants (⬍37 weeks’ gestation) were recruited from 5 neonatal units in Cambridge, Leicester, and Nottingham between 1993 and 1995, with 18-month follow-up completed in 1997. All had a birth weight below 1750 g and were free from congenital malformations or conditions known to affect growth or develop-ment. Infants were eligible if their mother did not intend to provide breast milk or to breastfeed after hospital discharge, if one of their main caretakers spoke English, and if they intended to stay in the United Kingdom for the next 18 months. Infants were excluded from the study if they weighed⬎3 kg or were⬎100 days old at discharge (to exclude infants with bronchopulmonary dys-plasia who would be expected to have atypical postdischarge growth), or if they had severe brain disease (Grade III or IV intraventricular hemorrhage, meningitis, or hydrocephalus). They were randomized onto the trial formulas (PDF or standard term formula [TF]) in the week before planned hospital discharge and remained on it until 9 months’ postterm. Solids were introduced at a time determined by the parents with advice from their health care professionals (current United Kingdom recommendations for term infants are to introduce solids between 4 and 6 months of age; no specific guidelines exist for preterm infants); research staff were not involved in this decision.
Research nurses collected data from the hospital records, in-cluding obstetric data, clinical progress, feed intake data, and growth during the immediate postnatal period. Infants were stud-ied at home at 6 weeks’, 12 weeks’, and 26 weeks’ postterm, when anthropometry was performed. Weight was measured using dig-ital electronic scales, length using a horizontal infant stadiometer (with the infant’s head held by one observer, and both legs ex-tended and held by a second observer) and occipito-frontal head circumference and mid-upper arm circumference (MUAC) using a nonstretchable encircling tape. Triceps and sub-scapular skinfold thicknesses were measured using Harpenden calipers (Holtain, Dyfed, Wales, UK).
At 9 and 18 months’ postterm, infants were invited to attend a follow-up clinic at their local hospital where anthropometry was performed and the neurodevelopmental tests were administered by a trained doctor.
A reference group of preterm infants whose mothers had de-cided to breastfeed after discharge were recruited over the same period as the formula-fed infants and followed up to 9 months’ postterm; all were breastfed for at least 6 weeks after discharge, but they were allowed up to 2 oz of formula milk per day in addition to breast milk. A standard term infant formula was used to supplement or replace breast milk where required. Anthropom-etry was performed at each follow-up visit.
Assignment
The randomization schedule was generated by permuted blocks of randomized length, with the assignments in sealed opaque envelopes, and was stratified by birth weight (⬍or⬎1200 g), whether or not infants required supplemental oxygen for⬎28 days, and by the number of fetuses (twins or triplets were ran-domized as one onto the same diet). A member of the team who was not involved in subsequent aspects of the trial prepared randomization assignments.
Blinding
The formulas were color-coded; the codes were held by the formula manufacturers and were not revealed to the investigators until after the principal data analyses were performed. Both for-mulas were identical in color and smell.
Trial Formulas
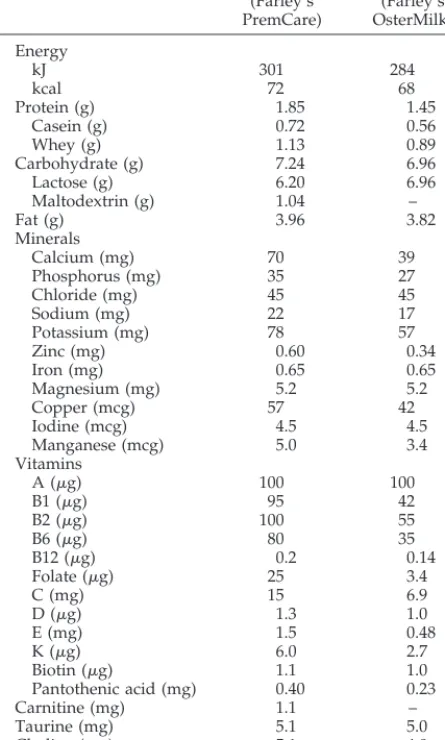
The composition of formulas is shown in Table 1. Both were supplied by Farley Health Products (a division of H. J. Heinz Co Ltd). The PDF (Farley’s PremCare) contained nearly 20% more protein in relation to energy than the standard TF (Farley’s Oster-Milk, Uxbridge, UK), together with increased calcium, phospho-rus, trace elements, and vitamins. Both formulas comply with the European Community Directive for the composition of formulas for healthy term infants.
Outcome Measures
Principal efficacy outcome measures were 1) growth (weight, length, and occipito-frontal head circumference) at 9 and 18 months’ postterm; 2) neurodevelopment at 18 months’ postterm, measured by the mental and motor scales of the Bayley Scales of Infant Development II,15from which were derived the Mental and
Psychomotor Development Indices. Secondary efficacy outcome was neurodevelopment at 9 months’ postterm measured using Knobloch, Passamanick, and Sherrards’ Developmental Screening Inventory,16comprising 5 subscales (adaptive, gross motor, fine
motor, language, and personal–social). An overall developmental score was calculated as the mean of the 5 subscale scores. At 9 and 18 months’ postterm, the research doctor was asked to rate the infant’s neurologic status as “normal,” “equivocal,” or “abnor-mal.” Developmental assessments were performed by 3 doctors; 1 in each center. All were trained by a single experienced investi-gator (R.M.) with regular monitoring of performance throughout the study.
deter-mined by maternal recall with, where appropriate, information from child health records. Tolerance outcomes were maternal reports of vomiting, colic, and stool characteristics (usual fre-quency and consistency of stools while receiving the trial milk and maternal reports of constipation). Milk volume intake was not measured because our previous trial using these formulas had shown that milk consumption at any age up to 9 months was unaffected by formula composition.
Statistics
The target sample size per randomized group (113 infants) was calculated to permit detection of a 300-g difference in weight between groups at 9 months and a 400-g difference at 18 months (in each case the difference between the 10th and 25th centiles) at 5% significance and 70% to 80% power, based on our previous growth data from preterm infants. This sample size would also permit detection of a 4-point (approximately 0.3 standard devia-tion [SD]) difference in Bayley developmental indices.
Analyses were performed on an intention-to-treat basis. Differ-ences between randomized groups were compared by Student’st test, Mann-Whitney test, or2test. Differences between the
breast-fed reference group and formula groups were compared using analysis of variance, with posthoc analysis using Dunnett’s test.
RESULTS Randomized Trial
The trial profile is shown in Fig 1. Two hundred twenty-nine infants were randomized, 116 to the standard TF (55 [47%] boys) and 113 (58 [51%] boys)
to the postdischarge formula. One hundred three infants from each group completed 9 months on the trial diet. Eight PDF and 13 TF infants were with-drawn from the study. The numbers withwith-drawn be-cause of adverse events were similar in both groups; 6 PDF infants (2 withdrawn by clinicians) and 7 TF infants (4 withdrawn by clinicians). Two PDF infants died during the study, both as a result of sudden infant death syndrome. Two infants who did not complete 9 months on the trial diet (both random-ized to TF) were seen for follow-up at 9 months’ postterm, and 4 (3 randomized to TF and 1 to PDF) at 18 months’ postterm.
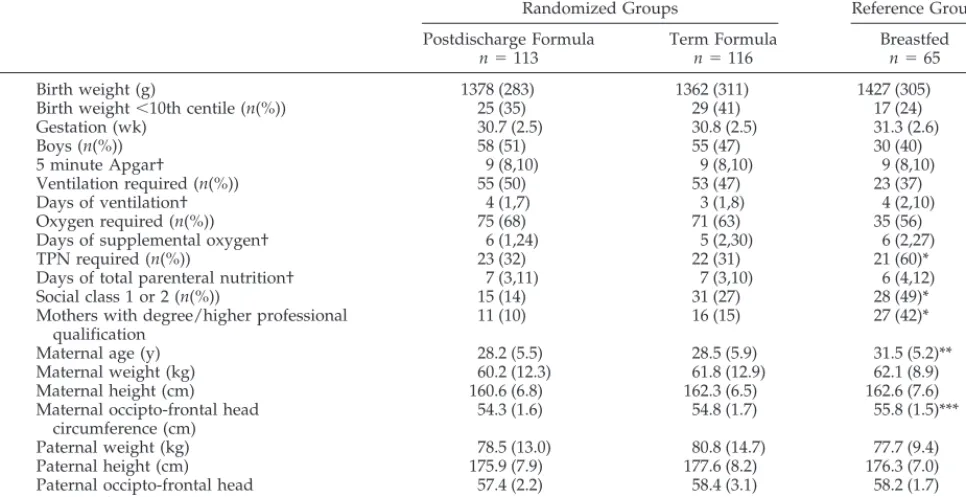
There were no significant differences between groups in demographic characteristics or in parental size (Table 2). The clinical course during the neonatal period was also similar in both groups and, at ran-domization, there were no significant differences in age, weight, length, or head circumference. Both groups were randomized at a similar postconcep-tional age (36.3 [SD 1.9] versus 36.6 [SD 2.1] weeks for PDF and TF groups, respectively).
Principal Efficacy Measures Growth
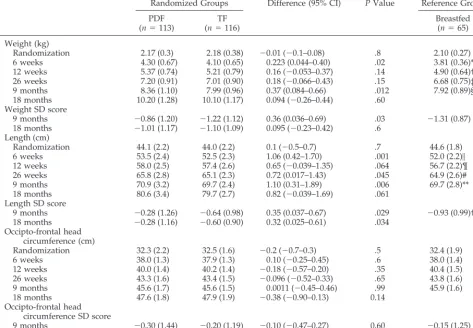
At 9 months’ postterm, infants receiving PDF were 370-g heavier (95% confidence interval [CI]: 84 – 660 g), and 1.1-cm longer (95% CI: 0.3–1.9) than those on TF (Table 3). The advantage in length was still present, although reduced, at 18 months’ postterm (advantage 0.8 cm (95% CI: ⫺0.04 –1.7). When weight, length and head circumference were ex-pressed as SD scores to correct for minor imbalances between groups in gender and in the exact age at follow-up, PDF infants had a significant advantage in both weight and length at 9 months’ postterm (Table 3), and the advantage in length persisted at 18 months’ postterm (advantage for PDF group 0.32 SD [95% CI: 0.025– 0.61],P⫽.03). Mean SD scores for the cohort at recruitment were ⫺1.49 (SD 0.87) for weight and ⫺1.97 (1.16) for length, with no signifi-cant difference between groups. There were no sig-nificant differences in head circumference at any time point. Inspection of the interim growth data showed that infants fed PDF were already 220 (44 – 400) g heavier and 1.1 (0.4 –1.7) cm longer at 6 weeks’ postterm.
We found no evidence that infants who received PDF had become fat; there were no significant dif-ferences between groups in skinfold thicknesses (at 9 months; triceps 9.5 [SD 2.5] vs 9.6 [SD 2.5] cm and subscapular 6.7 [1.6] vs 6.4 cm for PDF and TF groups, respectively: at 18 months; triceps 8.0 [2.3] vs 8.1 [2.1] cm and subscapular 5.7 [1.2] vs 5.7 [1.5] cm) or MUAC (at 9 months 14.9 [SD 1.1] vs 14.7 [1.3] cm and 18 months 14.8 [1.2] vs 14.9 [1.2] cm) and at 9 months’ postterm, the mean body weight of PDF infants was still below the 50th centile, with an even greater deficit for infants fed TF.
A planned subgroup analysis according to gender (Table 4) showed that the advantage for infants fed the PDF was greater in boys than girls; by 9 months, boys fed the PDF were 575 (150 –1000)-g heavier and
TABLE 1. Composition of Trial Diets (Values per 100 mL) PDF
(Farley’s PremCare)
Standard TF (Farley’s OsterMilk)
Energy
kJ 301 284
kcal 72 68
Protein (g) 1.85 1.45
Casein (g) 0.72 0.56
Whey (g) 1.13 0.89
Carbohydrate (g) 7.24 6.96
Lactose (g) 6.20 6.96
Maltodextrin (g) 1.04 –
Fat (g) 3.96 3.82
Minerals
Calcium (mg) 70 39
Phosphorus (mg) 35 27
Chloride (mg) 45 45
Sodium (mg) 22 17
Potassium (mg) 78 57
Zinc (mg) 0.60 0.34
Iron (mg) 0.65 0.65
Magnesium (mg) 5.2 5.2
Copper (mcg) 57 42
Iodine (mcg) 4.5 4.5
Manganese (mcg) 5.0 3.4
Vitamins
A (g) 100 100
B1 (g) 95 42
B2 (g) 100 55
B6 (g) 80 35
B12 (g) 0.2 0.14
Folate (g) 25 3.4
C (mg) 15 6.9
D (g) 1.3 1.0
E (mg) 1.5 0.48
K (g) 6.0 2.7
Biotin (g) 1.1 1.0
Pantothenic acid (mg) 0.40 0.23
Carnitine (mg) 1.1 –
Taurine (mg) 5.1 5.0
Choline (mg) 5.1 4.8
1.5 (0.3–2.7)-cm longer than those fed TF. The advan-tage in length was maintained to 18 months (advan-tage for PDF boys 1.5 [0.3–2.7] cm). The difference in weight and length between girls fed TF and PDF was not significant at either time point. Interaction terms for the effects of gender and diet on weight or length were not significant (weight at 9 months, P ⫽ .1; length at 9 months,P⫽.2; length at 18 months,P⫽ .1). Thus, subsequent analyses were performed with both sexes combined.
Neurodevelopment
At 18 months’ postterm, Bayley developmental scores did not differ significantly between the 2 ran-domized groups, although infants previously fed PDF had a 2.7-point advantage in Bayley PDI (0.25 SD). There was no evidence that the effect of diet differed in boys and girls, and no interaction be-tween diet and gender on Bayley developmental scores. The number of infants considered to have either a possible or definite neurologic deficit at 18-month follow-up was the same in both groups.
There was no significant interaction between ran-domized diet and either gestation or birth weight on later growth and neurodevelopmental outcomes.
Secondary Efficacy Measures
At 9 months’ postterm, Knobloch, Passamanick, and Sherrards’ Developmental Screening Inventory quotient was not significantly different between groups, although there was a nonsignificant trend toward higher scores in the PDF group, particularly for gross motor and fine motor subscales (Table 5). The proportion of infants considered to have a pos-sible or definite neurologic abnormality at 9-month follow-up was the same in the 2 groups.
Safety
There were no significant differences between ran-domized groups; 85% of PDF infants versus 86% of TF infants had had at least 1 upper respiratory tract infection by 18 months’ postterm, 56% versus 49% had had a chest infection, and 43% versus 33% had gastroenteritis. There was no difference in antibiotic usage or atopic disease between groups, and the proportions seeking medical advice were also simi-lar.
Tolerance
Similar proportions from both formula groups were reported to have vomiting or colic. Infants fed
PDF had harder stools at 12 weeks (58% infants reported to have hard or formed stools compared with 36% in TF group,P⫽.04). However, a similar proportion (10%) of infants from both groups were perceived by parents as having constipation. PDF infants passed more stools per week at 12 weeks (median 14 (25th, 75th centiles7,20) versus 7,7,12P ⬍
.001). By 26 weeks, however, stool characteristics were similar in the 2 groups. The proportions of infants receiving solids were not significantly differ-ent at 12 weeks (85% PDF vs 78% TF) or 26 weeks (97% vs 99%).
Exclusion of infants who failed to complete 9 months on the trial diet but who were seen at 9 and 18 months postterm did not alter the findings. Comparison of Formula-Fed Infants With Breastfed Reference Group
Sixty-five infants formed the breastfed reference group. As expected, these infants had older mothers with higher educational qualifications, and their par-ents were more likely to come from social class 1 or 2 (Table 2). Breastfed infants were significantly less likely than both formula groups to be receiving sol-ids at 12 weeks (67%,P ⫽ .04) and 26 weeks (91%, P⫽ .03).
There were no significant differences in weight, length, or head circumference between breastfed and formula-fed infants at the time of enrollment in the study (Table 3), although breastfed infants had sig-nificantly lower weight SD scores (⫺2.03 [SD 1.84] vs ⫺1.49 [0.87],P⫽.03). By 6 weeks’ postterm (a period during which the reference group were almost ex-clusively breastfed) breastfed infants were
signifi-cantly lighter and shorter than both formula groups. Compared with PDF infants, the disadvantage in weight for breastfed infants was 513 g (95% CI: 310 – 715) or 0.82 (95% CI: 0.41–1.22) SD, and in length, 1.6 (95% CI: 0.8 –2.3) cm or 0.63 (95% CI: 0.24 –1.03) SD. This disadvantage was still present at 26 weeks (weight 512 [95% CI: 225–798] g or 0.68 [95% CI: 0.27–1.10] SD, and length 0.9 [95% CI: 0.01–1.8] cm or 0.42 [95% CI: 0.02– 0.82] SD) and was maintained up to 9 months’ postterm (the end of the study for breastfed infants), beyond the period when most breastfed infants had started to receive standard TF (disadvantage in weight 439 [95% CI: 105–773] g or 0.45 [95% CI:⫺0.06 – 0.95] SD, and in length 1.1 [95% CI: 0.2–2.1] cm) or 0.65 [95% CI: 0.15–1.15] SD. Breast-fed infants also had lower MUAC and triceps and subscapular skinfold thicknesses at enrollment than both formula-fed groups. Significantly lower MUAC and triceps skinfold thickness persisted at follow-up to 9 months (complete data available from authors).
DISCUSSION Randomized Trial
We previously reported, in a small pilot study, that preterm infants randomized to receive a nutrient-enriched PDF rather than a TF after hospital dis-charge showed greater gains in weight and length by 9 months’ postterm.13Our current large clinical trial
confirms and extends these findings, showing that the advantage in length for infants fed the PDF per-sisted for at least 9 months after the milk was dis-continued. This suggests, for the first time, that the postdischarge period in preterm infants may be
crit-TABLE 2. Prerandomization Data for Infants According to Trial Diet
Randomized Groups Reference Group
Postdischarge Formula n⫽113
Term Formula n⫽116
Breastfed n⫽65
Birth weight (g) 1378 (283) 1362 (311) 1427 (305)
Birth weight⬍10th centile (n(%)) 25 (35) 29 (41) 17 (24)
Gestation (wk) 30.7 (2.5) 30.8 (2.5) 31.3 (2.6)
Boys (n(%)) 58 (51) 55 (47) 30 (40)
5 minute Apgar† 9 (8,10) 9 (8,10) 9 (8,10)
Ventilation required (n(%)) 55 (50) 53 (47) 23 (37)
Days of ventilation† 4 (1,7) 3 (1,8) 4 (2,10)
Oxygen required (n(%)) 75 (68) 71 (63) 35 (56)
Days of supplemental oxygen† 6 (1,24) 5 (2,30) 6 (2,27)
TPN required (n(%)) 23 (32) 22 (31) 21 (60)*
Days of total parenteral nutrition† 7 (3,11) 7 (3,10) 6 (4,12)
Social class 1 or 2 (n(%)) 15 (14) 31 (27) 28 (49)*
Mothers with degree/higher professional qualification
11 (10) 16 (15) 27 (42)*
Maternal age (y) 28.2 (5.5) 28.5 (5.9) 31.5 (5.2)**
Maternal weight (kg) 60.2 (12.3) 61.8 (12.9) 62.1 (8.9)
Maternal height (cm) 160.6 (6.8) 162.3 (6.5) 162.6 (7.6)
Maternal occipto-frontal head circumference (cm)
54.3 (1.6) 54.8 (1.7) 55.8 (1.5)***
Paternal weight (kg) 78.5 (13.0) 80.8 (14.7) 77.7 (9.4)
Paternal height (cm) 175.9 (7.9) 177.6 (8.2) 176.3 (7.0)
Paternal occipto-frontal head circumference (cm)
57.4 (2.2) 58.4 (3.1) 58.2 (1.7)
Data are mean (SD) unless otherwise stated.
*P⬍.01 breastfed compared with formula fed groups.
**P⫽.002 breastfed compared with formula groups;P⫽.001 versus PDF,P⫽.005 versus TF. ***P⬍.001 breastfed compared with formula groups;P⬍.001 versus PDF and TF.
ical for the programming of the subsequent growth trajectory (although clearly, additional follow-up is required to test this). In contrast, it is interesting that we have shown recently that nutrition during the early neonatal period before hospital discharge in preterm infants has no long-term effect on later
growth despite producing major differences in growth rates at the time.10
The growth differences between the diet groups seemed greater in boys than in girls; boys fed the PDF had an advantage in length of 1.5cm (around 0.5 SD) at 18 months of age (although the statistical
TABLE 3. Postdischarge Growth According to Diet
Randomized Groups Difference (95% CI) PValue Reference Group
PDF (n⫽113)
TF (n⫽116)
Breastfed (n⫽65)
Weight (kg)
Randomization 2.17 (0.3) 2.18 (0.38) ⫺0.01 (⫺0.1–0.08) .8 2.10 (0.27)
6 weeks 4.30 (0.67) 4.10 (0.65) 0.223 (0.044–0.40) .02 3.81 (0.36)*
12 weeks 5.37 (0.74) 5.21 (0.79) 0.16 (⫺0.053–0.37) .14 4.90 (0.64)†
26 weeks 7.20 (0.91) 7.01 (0.90) 0.18 (⫺0.066–0.43) .15 6.68 (0.75)‡
9 months 8.36 (1.10) 7.99 (0.96) 0.37 (0.084–0.66) .012 7.92 (0.89)§
18 months 10.20 (1.28) 10.10 (1.17) 0.094 (⫺0.26–0.44) .60
Weight SD score
9 months ⫺0.86 (1.20) ⫺1.22 (1.12) 0.36 (0.036–0.69) .03 ⫺1.31 (0.87)
18 months ⫺1.01 (1.17) ⫺1.10 (1.09) 0.095 (⫺0.23–0.42) .6
Length (cm)
Randomization 44.1 (2.2) 44.0 (2.2) 0.1 (⫺0.5–0.7) .7 44.6 (1.8)
6 weeks 53.5 (2.4) 52.5 (2.3) 1.06 (0.42–1.70) .001 52.0 (2.2)㛳
12 weeks 58.0 (2.5) 57.4 (2.6) 0.65 (⫺0.039–1.35) .064 56.7 (2.2)¶
26 weeks 65.8 (2.8) 65.1 (2.3) 0.72 (0.017–1.43) .045 64.9 (2.6)#
9 months 70.9 (3.2) 69.7 (2.4) 1.10 (0.31–1.89) .006 69.7 (2.8)**
18 months 80.6 (3.4) 79.7 (2.7) 0.82 (⫺0.039–1.69) .061
Length SD score
9 months ⫺0.28 (1.26) ⫺0.64 (0.98) 0.35 (0.037–0.67) .029 ⫺0.93 (0.99)††
18 months ⫺0.28 (1.16) ⫺0.60 (0.90) 0.32 (0.025–0.61) .034
Occipto-frontal head circumference (cm)
Randomization 32.3 (2.2) 32.5 (1.6) ⫺0.2 (⫺0.7–0.3) .5 32.4 (1.9)
6 weeks 38.0 (1.3) 37.9 (1.3) 0.10 (⫺0.25–0.45) .6 38.0 (1.4)
12 weeks 40.0 (1.4) 40.2 (1.4) ⫺0.18 (⫺0.57–0.20) .35 40.4 (1.5)
26 weeks 43.3 (1.6) 43.4 (1.5) ⫺0.096 (⫺0.52–0.33) .65 43.8 (1.6)
9 months 45.6 (1.7) 45.6 (1.5) 0.0011 (⫺0.45–0.46) .99 45.9 (1.6)
18 months 47.6 (1.8) 47.9 (1.9) ⫺0.38 (⫺0.90–0.13) 0.14
Occipto-frontal head circumference SD score
9 months ⫺0.30 (1.44) ⫺0.20 (1.19) ⫺0.10 (⫺0.47–0.27) 0.60 ⫺0.15 (1.25)
18 months ⫺0.88 (1.35) ⫺0.58 (1.38) ⫺0.30 (⫺0.69–0.091) 0.13
Results are mean (SD).
*P⬍.001 ANOVA breast versus formula groups: BF versus PDFP⬍.001, BF versus TFP⫽.01 †P⫽.001 ANOVA breast versus formula groups: BF versus PDFP⫽.001, BF versus TFP⫽.03 ‡P⫽.003 ANOVA breast versus formula groups: BF versus PDFP⫽.001, BF versus TFP⫽.05 §P⫽.008 ANOVA breast versus formula groups: BF versus PDFP⫽.02, BF versus TFP⫽.9
㛳P⬍.001 ANOVA breast versus formula groups: BF versus PDFP⬍.001, BF versus TFP⫽.3 ¶P⫽.006 ANOVA breast versus formula groups: BF versus PDFP⫽.003, BF versus TFP⫽.2 #P⫽.05 ANOVA breast versus formula groups: BF versus PDFP⫽.06, BF versus TFP⫽.9 **P⫽.009 ANOVA breast versus formula groups: BF versus PDFP⫽.02, BF versus TFP⫽.9 ††P⫽.008 ANOVA breast versus formula groups: BF versus PDFP⫽.009, BF versus TFP⫽.3
TABLE 4. Postdischarge Growth in Boys and Girls According to Randomized Diet
Boys Girls
PDF n⫽58
TF n⫽55
PDF n⫽55
TF n⫽61
9 months
Weight (kg) 8.83 (1.13) 8.26 (0.95)* 7.89 (0.85) 7.75 (0.91)
Length (cm) 71.9 (3.3) 70.4 (2.5)* 69.8 (2.7) 69.2 (2.2)
Occipto-frontal head circumference (cm)
46.1 (1.9) 46.2 (1.3) 45.1 (1.4) 45.1 (1.4)
18 months
Weight (kg) 10.77 (1.34) 10.51 (0.97) 9.64 (0.95) 9.72 (1.23)
Length (cm) 81.7 (3.4) 80.2 (2.6)* 79.5 (2.9) 79.3 (2.6)
Occipto-frontal head circumference (cm)
48.2 (1.8) 48.8 (1.6) 46.9 (1.5) 47.2 (1.8)
interaction between the effect of diet and gender on this outcome was significant only at the 10% level). This finding is, however, consistent with previous work demonstrating that preterm boys randomized to receive a preterm formula up to 6 months’ post-term showed greater weight and length gain than those fed a standard TF, whereas the same interven-tion had no significant effect in girls.17 In addition,
nutritional interventions have been shown to have a greater effect on neurodevelopmental outcome in preterm boys than in preterm girls.2
Postdischarge nutrition in preterm infants has re-ceived relatively little attention, yet preterm infants are frequently discharged from the hospital with a body weight well below that of a healthy term infant at birth. Follow-up of preterm infants suggests that growth deficits persist; in our own study, twice as many children than expected were under the 10th centile at 7.5 to 8 years.4 Similar findings have
emerged from follow-up studies in the United States.18In-hospital, preterm infants receive specially
designed preterm infant formulas designed to meet their increased nutritional requirements, or human milk supplemented with additional nutrients, it is likely that they would continue to benefit from in-creased nutritional support after the rather arbitrary time point of hospital discharge. One possibility would be to continue the use of preterm infant for-mula after discharge, an approach adopted in at least 2 randomized trials.17,19 However, this approach
risks exposing larger ad libitum fed infants in the community to potentially toxic intakes of certain nu-trients,20for example, vitamin D.
For this reason, a special nutrient-enriched PDF was designed, with nutrient levels intermediate be-tween those of a standard term infant formula and a preterm formula. This formula fulfills the European Community Directive requirements for the composi-tion of a term infant formula. It contains predomi-nantly an increase in protein, but with only a modest increase in energy to permit utilization. It also con-tains an increase in minerals, particularly calcium, phosphorus, and zinc, deficits of which might limit
linear growth, and vitamins to support the projected increased growth performance. Our results suggest that, as anticipated, use of this formula resulted pre-dominantly in an increase in lean tissue rather than increasing fat deposition; infants fed the PDF had a mean weight below the 50th centile at 9 months’ postterm, and there was no significant increase in skinfold thicknesses compared with infants fed the standard formula. This is consistent with the study by Cooke et al21in which preterm boys who received
a preterm formula until 6 months’ postterm showed greater gain in lean body mass, measured by dual radiograph absorptiometry, than those fed a stan-dard TF.
Two other smaller studies have examined the ef-fect of feeding a nutrient-enriched postdischarge for-mula to preterm infants to 12 months’ postterm. Carver et al22 reported greater head circumference
up to 12 months postterm in postdischarge formula-fed infants with birth weight below 1250 g, while Atkinson et al23found higher weights in infants fed
postdischarge formula but no differences in length or head circumference.
A potential concern in any attempt to improve nutrition in vulnerable infants such as these is that the infants will simply down-regulate their intake of formula, thus negating any potential effect on out-come. This did not occur in our pilot study using the same formulas,13 presumably because the
nutrient-enriched formula contained primarily an increase in protein, with only a modest increase in energy. For this reason, formula intake measurements were not repeated in the current study. Two previous stud-ies22,23comparing a postdischarge formula with term
formula during the first year of life in preterm infants found lower formula intakes in infants receiving the postdischarge formula, resulting in similar energy intakes but higher protein intakes in these infants compared with those receiving term formula. The differences in energy contents between the 2 formu-las used in these studies were greater than in our study (75 vs 67 kcal/100 mL compared with 72 vs 68
TABLE 5. Developmental Scores at 9 and 18 Months’ Postterm According to Randomized Diet Group (Mean [SD]) Postdischarge Formula
n⫽98
Term Formula n⫽98
Difference (95% CI)
PValue
9 months
Knobloch, Passamanick and Sherrards’ Developmental Screening Inventory
Overall score (wk) 40.6 (3.8) 39.7 (4.5) 0.9 (⫺0.3 to 2.1) .1
Adaptive 41.1 (4.1) 40.2 (5.2) 0.1 (⫺0.4 to 2.3) .2
Gross motor 41.6 (6.3) 40.4 (7.3) 1.2 (⫺0.8 to 3.1) .2
Fine motor 40.2 (4.9) 39.1 (5.2) 1.1 (⫺0.4 to 2.5) .1
Language 38.3 (4.9) 37.6 (4.2) 0.7 (⫺0.6 to 2.0) .3
Personal-social 41.6 (4.7) 41.0 (5.3) 0.6 (⫺0.8 to 2.0) .4
Neurological status (n(%))
Normal 88 (90) 89 (91)
Equivocal 8 (8) 5 (5)
Abnormal 2 (2) 4 (4)
18 months n⫽91 n⫽93
Mental Development Index 92.3 (14.7) 91.4 (13.9) 0.9 (⫺3.3 to 5.0)
Psychomotor Development Index 91.7 (12.7) 89.0 (14.8) 2.8 (⫺1.3 to 6.8) Neurological status (n(%))
Normal 87 (91) 82 (86)
Equivocal 3 (3) 2 (2)
kcal/100 mL), which may explain the discrepancy between their results and ours.
Infants fed the PDF in our study had similar Bay-ley Mental Development Indices to infants fed TF. However, Bayley Psychomotor Developmental Indi-ces were almost 3 points higher in the PDF group, representing approximately 0.25 SD. Our study was powered to detect a 0.3 SD difference between groups and a larger study or a meta-analysis of sev-eral studies would be required to detect a difference of this magnitude as significant. Developmental scores on the Knobloch, Passamanick, and Sherrards’ Developmental Screening Inventory at 9 months’ postterm similarly showed a trend toward higher scores in the PDF group who were approximately 1 week in advance of infants fed TF, but these differ-ences were too small to be detected as significant in a study of this size. Additional follow-up of this cohort is planned to examine whether advantages emerge at an age when more specific tests of cogni-tive function can be undertaken. Our previous stud-ies have indicated that the early postnatal period, before hospital discharge, is a critical window for programming of subsequent developmental out-come.2 An important hypothesis, which cannot be
rejected on the basis of the current study findings to date, is that this window of sensitivity may extend into the postdischarge period.
Safety and Tolerance
Both formulas were well tolerated, and there were no differences in safety outcomes (the occurrence of infections, atopy, number of courses of antibiotics, and requirement for medical attention) between groups. Infants who received the PDF were reported to have harder (although more frequent) stools at 12 weeks of age than those fed TF. This was also noted in our pilot study,13 and in a study using the same
formulas in term growth retarded infants.24 The
higher overall fat content of the PDF and its higher calcium content could well have accounted for this difference, resulting in greater formation of insoluble calcium soap formation in the stools. This could po-tentially be addressed by altering the fat blend and reducing the palmitic acid content. However, the difference seemed to not be problematic in practice, because the reported incidence of constipation was the same in both formula groups and the difference between groups resolved with time.
Comparison of Breastfed and Formula-Fed Infants Breast-milk may confer important short and longer term benefits for preterm infants, including protec-tion against necrotizing enterocolitis25 and
infec-tion26 and promotion of mental development at
fol-low-up.27 Yet human milk does not meet the
nutritional needs of these infants and requires sup-plementation. Because of modern counseling on the benefits of breast milk, an increasing number of mothers of preterm infants take their infants home breastfed. However, it is not clear whether unsupple-mented breast milk meets the nutrient requirements of preterm infants after hospital discharge. We there-fore compared growth in a group of preterm infants
who were predominantly breastfed for at least 6 weeks after discharge with that of the formula-fed infants in the randomized trial. Our results show that breastfed infants had significantly lower weight SD at enrollment than formula-fed infants and that, by 6 weeks’ postdischarge, they had a significant disad-vantage in both weight and length, and in weight and length SD scores, compared with both formula groups, and particularly compared with infants fed the PDF. This disadvantage persisted at 9 months’ postterm, a time by which most of the breastfed group were receiving partly or exclusively formula milk, and despite the fact that the parents of breast-fed infants were larger than those of formula-breast-fed infants, indicating a potentially greater genetic growth potential. Breastfed infants also had signifi-cantly lower MUAC and skinfold thickness, both at discharge from hospital and up to 9 months postterm compared with formula-fed groups. Breastfed in-fants were not seen at 18 months’ postterm in this study, and it is possible that some or all of the deficit in weight and length would have disappeared by this time point. However, even if the growth deficits are eventually abolished, it is possible that the poor early growth will have had long-term effects on other aspects of health or development. Follow-up is planned to examine these issues.
CONCLUSION
The use of a nutrient-enriched PDF in preterm infants was associated with improved short-term growth, and, potentially, with improved linear growth beyond the period of dietary randomization. The possibility that improved postdischarge nutri-tion has beneficial effects on neurodevelopment re-quires additional investigation. In this context, the use of standard term infant formulas for formula-fed postdischarge preterm infants seems difficult to de-fend. Indeed, the American Academy of Pediatrics has recently recognized the importance of PDF in the first 9 months in these infants.28Given that there was
a “population shift” in growth performance toward the growth pattern of healthy term infants in the PDF group, we would suggest the use of this formula could be justified as a population policy. As a corol-lary, if an individual preterm infant fed the PDF were to show catch-up to the 50th centile by, say 3 months, it would be illogical to switch to a standard TF at this point because the growth potential of that infant is unknown and the infant might have had the biological potential to grow on the 90th centile given optimal nutrition. It is also illogical for those man-aging preterm infants who are growing poorly after discharge to continue using ad hoc, untested meth-ods of supplementing these infants’ diets (for exam-ple, the common use of energy supplements), when tested and specifically designed products are avail-able.
their infant to partial or exclusive formula feeding during the first year, it would make sense for this formula to be a postdischarge rather than a standard TF. This policy is defendable in the light of our findings of a continued growth deficit in breastfed infants up to 9 months’ postterm, by which time most were receiving TF.
As our knowledge of nutrition becomes more so-phisticated, we are likely to identify an increasing number of population subgroups with special nutri-ent needs. It would seem that postdischarge preterm infants constitute such a group.
ACKNOWLEDGMENTS
This study was supported by Farley Health Products (a divi-sion of H. J. Heinz Company Ltd, Stockley Park, Uxbridge, United Kingdom) which also supplied the infant formulas.
We thank the research staff who collected data in the study (Helen Clough, Corina Adams, Ann Humphries, Sharon Collier, Penny Lucas, Julie Owen, Geraldine McHugh, Mary Quinn, Dawn Rodd, Emma Sutton, Julie Stammers, and Catherine Leeson-Payne) and the parents who allowed their infants to participate. We also thank Farley Health Products for their collaboration, contributory funding, and supply of the trial formulas.
REFERENCES
1. Lucas A, Brooke OG, Morley R, Cole TJ, Bamford MF. Early diet of preterm infants and development of allergic or atopic disease: random-ized prospective study.Br Med J. 1990;300:837– 840
2. Lucas A, Morley R, Cole TJ. Randomised trial of early diet in preterm babies and later intelligence quotient.BMJ. 1998;317:1481–1487 3. Fewtrell MS, Prentice A, Jones SC, et al. Bone mineralisation and
turn-over in preterm infants at 8 –12 years of age: the effect of early diet. J Bone Min Res. 1999;14:810 – 820
4. Lucas A. Nutrition, Growth and Development of Postdischarge Preterm Infants. In:Post-hospital Nutrition of the Preterm Infant.Report of the 106th Ross Conference on Pediatric Research, Colorado Springs, Colorado, August 18 –20, 1995. Columbus, OH: Ross Products Div, Abbott Labs; 1996: 81– 89
5. James JR, Congdon PJ, Truscott J, Horsman A, Arthur R. Osteopenia of prematurity.Arch Dis Child. 1986;61:871– 876
6. Greer FR, McCormick A. Bone growth with low bone mineral content in very low birth weight premature infants.Pediatr Res. 1986;20:925–928 7. Tsukahara H, Sudo M, Umezaki M, et al. Measurement of lumbar spinal
bone mineral density in preterm infants by dual-energy X-ray absorp-tiometry.Biol Neonate. 1993;64:96 –103
8. Chan GM, Mileur LJ. Posthospitalization growth and bone mineral status of normal preterm infants. Feeding with mother’s milk or stan-dard formula.Am J Dis Child. 1985;139:896 – 898
9. Congdon PJ, Horsman A, Ryan SW, Truscott JG, Durward H. Sponta-neous resolution of bone mineral depletion in preterm infants.Arch Dis Child. 1990;65:1038 –1042
10. Fewtrell MS, Cole TJ, Bishop NJ, Lucas A. Neonatal factors predicting childhood height in preterm infants: evidence for a persisting effect of early metabolic bone disease?J Pediatr. 2000;137:668 – 673
11. Ehrenkranz RA. Response: Micronutrients–Zinc, Copper and Iron In: Post-hospital Nutrition of the Preterm Infant. Report of the 106th Ross Conference on Pediatric Research, Colorado Springs, Colorado, August 18 –20, 1995.Columbus, OH: Ross Products Div, Abbott Labs; 1996:38 – 42 12. Reifen RM, Zlotkin S. Microminerals. In: Tsang R, Lucas A, Uauy R,
Zlotkin S, eds.Nutritional Needs of the Preterm Infant. Pawling, NY: Caduceus Medical Publishers; 1993:195–207
13. Lucas A, Bishop NJ, King FJ, Cole TJ. Randomised trial of nutrition for preterm infants after discharge.Arch Dis Child. 1992;67:1413–1414 14. Bishop NJ, King FJ, Lucas A. Increased bone mineral content of preterm
infants fed with a nutrient enriched formula after discharge from hos-pital.Arch Dis Child. 1993;68:573–578
15. Bayley N.Manual for the Bayley Scales of Infant Development. 2nd ed. San Antonio, TX: Psychological Corporation; 1993
16. Knobloch H, Passamanick B, Sherard S. A developmental screening inventory for infants.Pediatrics. 1966;38:1095–1108
17. Cooke RJ, Griffin IJ, McCormick K, et al. Feeding preterm infants after hospital discharge: effect of dietary manipulation on nutrient intake and growth.Pediatr Res. 1998;43:355–360
18. Hack MD, Borawski-Clark E. Postdischarge Growth of Very-Low-Birth-Weight Children. In:Post-hospital Nutrition of the Preterm Infant. Report of the 106th Ross Conference on Pediatric Research, Colorado Springs, Colorado, August 18 –20, 1995. Columbus, OH: Ross Products Division, Abbott Labs; 1996:58 – 63
19. Wheeler RE, Hall RT. Feeding of premature infant formula after hospi-tal discharge of infants weighing less than 1800 g at birth.J Perinatol. 1996;16:111–116
20. Lucas A, King FJ, Bishop NJ. Postdischarge formula consumption in infants born preterm.Arch Dis Child. 1992;67:691– 692
21. Cooke RJ, McCormick K, Griffin IJ, et al. Feeding preterm infants after hospital discharge: effect of diet on body composition. Pediatr Res. 1999;46:461– 464
22. Carver JD, Wu PY, Hall RT, et al. Growth of preterm infants fed nutrient enriched or term formula after hospital discharge.Pediatr Res. 2000;47: 284A
23. Atkinson SA, Randall-Simpson J, Chang M, Bosco P. Randomized trial of feeding nutrient-enriched vs standard formula to premature infants during the first year of life.Pediatr Res. 1999;45:276A
24. MS Fewtrell, R Morley, RA Abbott, A Singhal, T Stephenson, UM MacFadyen, H Clements, A Lucas. Catch-up growth in small for ges-tational age term infants: a randomized trial.Am J Clin Nutr; in press 25. Lucas A, Cole TJ. Breast milk and neonatal necrotising enterocolitis.
Lancet. 1990;336:1519 –1523
26. Narayanan I, Prakash K, Gujral VV. The value of human milk in the prevention of infection in the high-risk low birth weight infant.J Pediatr. 1982;99:496 – 498
27. Lucas A, Morley R, Cole TJ, Lister G, Leeson-Payne C. Breast milk and subsequent intelligence quotient in children born preterm.Lancet. 1992; 339:261–264
28. American Academy of Pediatrics, Committee on Nutrition. Nutritional needs of preterm infants. In:Pediatric Nutrition Handbook. 4th ed. Elk Grove Village, IL: American Academy of Pediatrics; 1998:72–73
After the age of 30, it is unseemly to blame one’s parents for one’s life—make that 25.
Rosenblatt R.Rules for Aging: Resist Normal Impulses, Live Longer, Attain Perfection.New York, NY: Harcourt, Inc; 2000
DOI: 10.1542/peds.108.3.703
2001;108;703
Pediatrics
Elizabeth Isaacs, Terence Stephenson, Una M. MacFadyen and Helena Clements
Alan Lucas, Mary S. Fewtrell, Ruth Morley, Atul Singhal, Rebecca A. Abbott,
Postdischarge Preterm Infants
Randomized Trial of Nutrient-Enriched Formula Versus Standard Formula for
Services
Updated Information &
http://pediatrics.aappublications.org/content/108/3/703
including high resolution figures, can be found at:
References
http://pediatrics.aappublications.org/content/108/3/703#BIBL
This article cites 21 articles, 7 of which you can access for free at:
Subspecialty Collections
http://www.aappublications.org/cgi/collection/nutrition_sub
Nutrition
http://www.aappublications.org/cgi/collection/chapters_views_news
Chapters Views & News following collection(s):
This article, along with others on similar topics, appears in the
Permissions & Licensing
http://www.aappublications.org/site/misc/Permissions.xhtml
in its entirety can be found online at:
Information about reproducing this article in parts (figures, tables) or
Reprints
http://www.aappublications.org/site/misc/reprints.xhtml
DOI: 10.1542/peds.108.3.703
2001;108;703
Pediatrics
Elizabeth Isaacs, Terence Stephenson, Una M. MacFadyen and Helena Clements
Alan Lucas, Mary S. Fewtrell, Ruth Morley, Atul Singhal, Rebecca A. Abbott,
Postdischarge Preterm Infants
Randomized Trial of Nutrient-Enriched Formula Versus Standard Formula for
http://pediatrics.aappublications.org/content/108/3/703
located on the World Wide Web at:
The online version of this article, along with updated information and services, is
by the American Academy of Pediatrics. All rights reserved. Print ISSN: 1073-0397.
![TABLE 5.Developmental Scores at 9 and 18 Months’ Postterm According to Randomized Diet Group (Mean [SD])](https://thumb-us.123doks.com/thumbv2/123dok_us/9511133.1480152/7.612.72.540.39.239/table-developmental-scores-months-postterm-according-randomized-group.webp)
