ECG Biometric Verification by using PCA
Asst. Prof. Dr. Jameel Kadhim Abed#1,Nahrain N. Abd *2 #
Department of Medical Instrumentation Techniques Engineering, Electrical Engineering Technical College, Middle Technical University, AL Doura 10022, Baghdad-Iraq)
Abstract
Identity verification faces several challenges,
mainly in extracting unique features of individual biometric methods and classifications. For example, the forms of electric waves of the heart characterized by unique characteristics of human recognition and its reference are not periodic at ready, in order to generate a distinct set of ECG methods, which are used autocorrelation (AC) development in conjunction with dimension reduction methods. This writing paper suggests a new non-fiducial frame for an ECG biometric recognition using (PCA) to the reduction both of the dimensions high- vector autocorrelation vector and the verification system after noise removal of 8 individuals use Discrete Wavelet Transform (DWT).
Keywords — Electro Cardio Gram (ECG) biometric recognition, Discrete Wavelet Transform (DWT), non-fiducial feature extraction, Auto Correlation (AC) and Principal Component Analysis (PCA).
I. INTRODUCTION
Recognition based on Biometrics is an accurate safety by identifying an individual with its characteristic human features. The human imprint, sound, face, and iris are mere some features that are being used presently in biometric recognition systems. Different methods use these sources of information to identify individuals [14-15]. However, these features are still fraudulent some examples of fraud are 3D imprint and face models, audio recorders for sound running, and contact lenses with copied iris features printed on. Lately, some proposals [1-2] suggested the potential of a novel type of biometric that can be using and cannot be copying readily: the human heartbeat. The characteristic vectors, which are measured from various parts of the ECG signal, used in former methods are listing in table 1.
The validity of using ECG as a biometric recognition planner is support by the reality that physiological and geometrical variations of the heart in various individuals display certain distinction in their ECG signals [8]. too in other recent studies by PTB [6], the permanence specifications of ECG pulses of an individual was studied by noticing that similarities of healthy subjects' pulses of various time periods, from 0 to 118 days, can see it when they are drawn above on each other at. These promising results indicate the excellence and long-term constancy of the ECG as a biometric
Formerly proposed ECG recognition techniques [1-2] depend heavily on one main step to extract advantages vectors: use of a fiducial detector. A fiducial detector is a spontaneous machine that marks the various components of an ECG signal. The trouble is that these machines are building just for the medical domain in which only the approximate locations of fiducial are required for diagnostic purposes. Until if these detectors are precise in identifying exact fiducial locations legitimized by cardiologists, there is no universally recognized rule to determine exactly where the boundary of the wave lies [9].
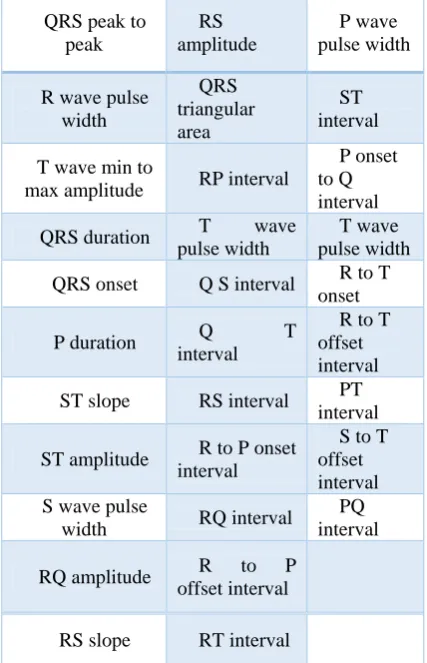
Table 1: Features from our former experiment
An example of Figure (1) is giving, where two pulses' P waves from the same individual are drawing above on each other with their P beginning fiducial positions (provided by ECG PUWAVE [3-4]) marked. As seen, the two pulses' P beginnings are marked very differently. Both the dashed pulse and the lining pulse have two basins at around
P wave pulse width RS
amplitude QRS peak to
peak ST interval QRS triangular area R wave pulse
width
P onset to Q interval RP interval
T wave min to max amplitude
T wave pulse width
T wave
pulse width QRS duration
R to T onset Q S interval QRS onset
R to T offset interval
Q T
interval P duration PT interval RS interval ST slope
S to T offset interval R to P onset
interval ST amplitude
PQ interval RQ interval
S wave pulse width
R to P
offset interval RQ amplitude
1OOms to 125ms and 140ms to 160ms. It is not clear, if these small domestic minimums before the P wave are causing by noise or if it is a portion of the
P wave. There is no specific answer to be
determined from the two regions as the beginning of waves P.
Figure 1: (upper) two pulses from object of the PTB database [3] drew above on each other, stratifying at the R peak, which happens to be as well the P wave peak in this situation due to the same heart rates. (Lower) Zoomed in width at time 100ms to 250ms, appear the P wave beginning markers from ECG P U WAVE [3- 4].
In contrast to most current methods, the solution suggested in this paper does not need a fiducial detector. Principal Component Analysis (PCA) is Appling on feature extraction that depends on a collection of Autocorrelation (AC) data to reduce then the dimension [9]. It ignores the insignificant factors and therefore reduces the dimension. In addition, it displays better identification performance as shown by computer simulations.
II. NEW PATH AND METHODOLOGY
His part will pass in the manner used in signal processing and be gathering the features for each signal. There are several steps of a job completed in every one of these two steps. In general, the steps are:
1 Pre-processing
A) Taken the initial 30 seconds of the signal. B) The ECG signal is normalize
C) The recorded ECG signals are be filtered, from the noise.
2 Feature Extractions (AC/PCA)
A) Extraction of the normalized autocorrelation coefficient
measured from the filtered signal
B) The PCA contrast matrix is creating for the classification
phase.
The same steps are recurrent on eight individuals. The process current illustration of the complete procedure is in the figure (2).
Figure (2): Process current drawing of the steps complicated in Biometric system.
A. Data Acquisition
The PTB Diagnostic Database [6], A Normal Sinus Rhythm Database [5], and QT Database [7] are applying in this writing paper. To check the robustness and capacity of the suggested algorithm, we apply three recognized DBs the three DBs are illustrating below
1. PTB Diagnostic Database (PTB DB)
The PTB DB includes 549 records from 290 individuals (older 17 to 87, 209 males, and 81 females; ages were not registered for one woman and 14 men individuals). It is providing that via the National Metrology Institute in Germany. The signals sampling were be taken at1000 Hz together with a 16-bit resolution with 0.5 µV, 16 input canal, and 0–1 kHz bandwidth. Collected from Benjamin Franklin University infirmary, Department of heart diseases, in Berlin, and the ECG data includes many healthy and sick patients.
2. QT Database (QT DB)
The QT DB includes a set of ECG signals to describe as various QRS and ST-T shapes. This register was be selected primarily from the existing ECG databases, consisting the European Heart Association ST-T DB, the MIT-BIH arrhythmia DB, and many other ECG databases. Which collected at Boston’s Beth Israel Deaconess infirmary, The QT DB contains a collection of 105 extracts for 15 minutes of two ECG channels, were be taken samples of which at 250 Hz, and a cardiologist diagnosed a collection of 3622 heartbeats.
3.Normal Sinus Rhythm Database (NSR DB) Was gathered The NSR DB at an arrhythmia laboratory at Beth Israel infirmary, in Boston. It includes 18 ECG records; were be taken samples of which at128 Hz and covers five men aged (26 – 45) years and 13 women aged (20 – 50) years.
Figure (3): Noisy ECG Signal of Two Subjects
B.
Normalized signal
The signal is normalized within (-1 to 1) display in figure (4).
Figure (4): Normalized Noisy ECG Signal of Two Subject
C. Filtering
Filtering the ECG signals is taken from the database to eliminate the noise. The signals are not just having high- and low- frequency parts of noise. It as well as muscle noise which interferes with the true signal. Conventional methods such a bandpass filter can lead to signal degradation. Wavelet can
remove signal noise without perceivable
deterioration [10]. This is a reason a Daubechies wavelet „DB.‟ that is Discrete Wavelet Transform (DWT) job at scale 12 is used. Such removes the noise of power line overlap and baseline stroll, Daubechies look like ECG signals and can be removed efficiently [11]. All signals are unifying to a sampling frequency for 256Hz.
The signals of ECG provide more pure and sharp signal after filter as shown in figure (5).
Figure (5): Filtered normalized ECG Signal of Two Subject
D. Feature Extraction
After filtering, a pre-processed signal should be to
division into non-overlapping frames. The
normalized autocorrelation (AC) is obtaining for each window. (AC) coefficients are more reduced using Principle Component Analysis (PCA) process.
Thus, the process can be to named (AC/PCA). When the set signal is auto correlated, it will not be necessary to find the actual default location. An (AC) is transfer fixed so it will collect the similar features across multiple heart beat cycles [12]. Since ECG is very frequent, it becomes easy to extract the autocorrelation feature. A cause for selecting this is non-fiducial detection (AC/PCA) because it is very spontaneous. The major function of autocorrelation is to extract a set of important data from a particular set of data. The objective of this is that it will represent the data given in the least dimension.
Based on our experiments, The QRS complex
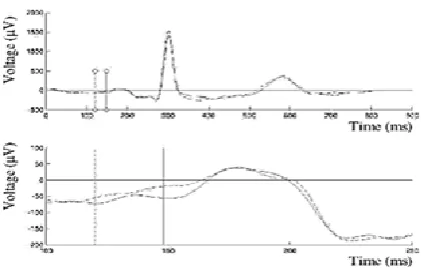
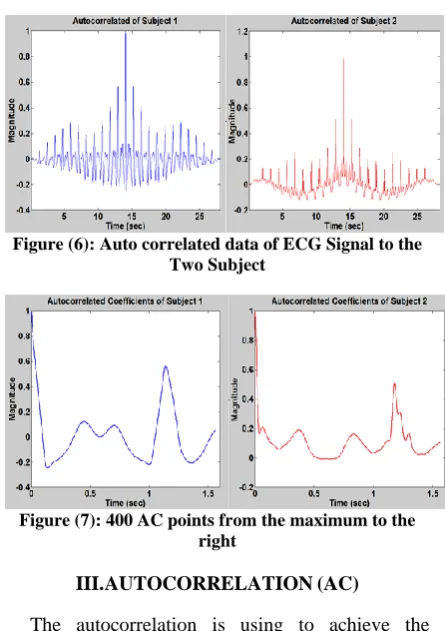
provides fewer fluctuations under different
conditions [12]. Therefore 400 is taken from the maximum point of the data auto correlated which equal length of the QRS complex. The figure (6) shows the auto correlated data of the windowed signal and the figure (7) zooms 400 AC from the maximum point of data auto correlated.
If the window length is 5 seconds, then the auto-correlated data will be present over 25 seconds.
Figure (6): Auto correlated data of ECG Signal to the Two Subject
Figure (7): 400 AC points from the maximum to the right
III. AUTOCORRELATION (AC)
Alt-hough the reference is non-periodic, this will remain successful because the signal is too frequent. His powers separation is per-forming to disconnect a specific part of the signal. The AC is implementing on the encased ECG. The data window must be of length N longer than the heartbeat rate. The comparatively distances and the ECG cycle lengths vary over time according to a physical or mental state study or other cases people. The measured normalized AC formula is calculating as follows:
Where x[i] is the windowed ECG for i=0,1… N-|m| - 1), x[i+m] is the time shifted form of the windowed ECG with a time lag of m = 0, 1, ...(M − 1); M<<N, where N is the length of the windowed signal.
IV. PRINCIPAL COMPONENT ANALYSIS (PCA)
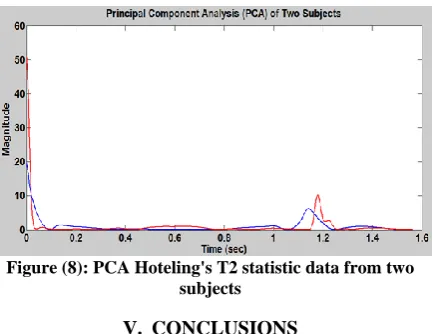
PCA is applying to data that is auto-correlated to minimize dimensions. [13]. Ignores the insignificant factors, therefore minimizes the dimension. It does this using a linear transformation. The PCA generates the Hoteling's T2 statistic, which gives a multivariate distance per observation from the dataset center. Figure (8) displays the action of the T2 statistic of two personals. You can clearly see each one different from the other.
These T2 statistics are using as features vector for the classification phase. The process flowchart of the whole order appears in the figure.
Figure (8): PCA Hoteling's T2 statistic data from two subjects
V. CONCLUSIONS
The method of utilization fiducial detection in identification is not a dependable option. The non-fiducial appears good result and dependable and permanent performance. It has arithmetic advantages compared to the fiducial detection. This is faster than the fiducial detection algorithm. The methods utilized in this search are
In this paper, the ECG is acquired utilize Lead 1 which leads to the creation of an Einthoven's triangle from the database location [5] [6] [7]. This is various from many other concepts where ECG is taken in various forms.
Demonstrate the methodology followed. In the pre-processing part, a wavelet filter (Daubechies) used as an alternative from the band pass filter. The wavelet filter is used which is a little harm to the signal. In addition, the way is done in the time domain because of the ECG signal a variable signal with time.
The third part. The non-fiducial (AC/PCA), features extraction was depended on extracting the autocorrelation data (AC) and using (PCA) to the dimension reduction of the autocorrelation data. The ECG features are every time varied in the signals even for the self-same individual. At times, some features do not produce fine results. This is why the choice of Fiducial is not a fine idea. Therefore, in the end, the method chosen to extract the feature is autocorrelation. The autocorrelation feature extracts a big number of features. Indeed, we focus on 400 points of data taken from the greatest point to a right. This is the QRS complex area, which is found do not change much same over time for the same individual. The data resulting from autocorrelation is still too many, thus, PCA used to in addition, decreasing the dimension. The Hoteling T2 statistics acquired here obtained. Statistical data extracted from the autocorrelation data of every signal taken as the final properties for use in the classification phase.
The results acquired for a range of the 8-person she gave a result of 100%.
REFERENCES
[1] Gawande PS & Ladhake. SA, "An Impact of Different Feature Extraction Methods on Classification of Electrocardiogram" International Journal of Advanced Research in Computer Science and Software Engineering 5(7), July- 2015, vol. 5, pp. 667-970.
[2] K.N. Plataniotis, D. Hatzinakos and J.K.M. Lee., ECG biometric recognition without fiducial detection. In Proceedings of the 2006 Biometrics Symposium: Special Session on Research at the Biometric Consortium Conference, Baltimore, MD, USA, 21 August–19 September 2006, pp 1–6.
[3] O. Muñoz-Ramos, O. Starostenko, V,.Alarcon-Aquino and C. Cruz-Perez, Chapter 28 Real-Time System for Monitoring and Analyzing Electrocardiogram on Cell Phone. In: Elleithy, K.; Sobh, T. (eds) Innovations and Advances in Computer, Information, Systems Sciences, and Engineering. Lecture Notes in Electrical Engineering Springer, New York, (2013), vol. 152, pp. 327-338.
[4] P. Laguna, R. Jan6, E Bogatell and D.V. Anglada, (2008, Jun 12). QRS detection and waveform boundary recognition using ecgpuwave. Retrieved June 2010, from Physio Toolkit: http://www.physionet.org/physiotools/ecgpuwave/. [5] The MIT-BIH Normal Sinus Rhythm Database. Available
online:
https://www.physionet.org/physiobank/database/nsrdb/ (accessed on 10 October 2017).
[7] The QT Database. Available online: https:// physionet.org /physiobank/database/qtdb/ (accessed on 10 October 2017). [8] N. Kamal, AH. Mohammad, I. Ramin & BM. Thomas,
Chapter 13 Contact-Free Heartbeat Signal for Human Identification and Forensics". Handbook of Biometrics for Forensic Science Advances in Computer Vision and Pattern Recognition, Springer AG 2017, pp. 289-301.
[9] C. Matteo, M. Jesper, M. Anne-Birgitte & BDS. Helge, "A New Wavelet-Based ECG Delineator for the Evaluation of the Ventricular Innervation". IEEE Journal of Translational Engineering in Health and Medicine, 4 July 2017, vol. 5, pp. 1-15.
[10] J. Yao & Y. Wan, (2008). A Wavelet Method for Biometric Identification Using Wearable ECG Sensors. Proceedings of the 2008 5th International Workshop on Wearable and Implantable Body Sensor Networks, in conjunction with The 5th International Summer School and Symposium on Medical Devices and Biosensors, pp. 297-300 , Hong Kong, P.R.China, June 1-3, 2008, Retrieved (July 27th 2011) from
Available from: http ://www.intechopen.com/
books/recentapplication-in-biometrics/biometrics-on-mobile-phone/, pp. 1-21,No. 65.
[11] MA. Mohamed & MA. Deriche, An Approach for ECG Feature Extraction using Daubechies4 (DB4) Wavelet. Int. J. Compute. Appl. 2014, vol. 96, pp. 36–41.
[12] J. Woo-Hyuk & L. Sang-Goog, "ECG Identification Based on Non-Fiducial Feature Extraction Using Window Removal Method". Appl. Sci, 22 November 2017, pp. 1-14. [13] O. Boumbarov, Y. Velchev & S. Sokolov,”ECG personal
identification in subspaces using radial basis neural networks,” IEEE Int. Workshop on Intelligent Data Acquisition and Advanced Computing Systems, 2009, pp. 446 –451.
[14] HF. Liau & D. Isa, Feature selection for support vector machine-based face-iris multimodal biometric system. Expert Syst. Appl. 2011, vol. 38, No. 9, pp. 11105–11111. [15] L. Yang, G. Yang, Y. Yin & X. Xi, Exploring soft biometric