http://www.sciencepublishinggroup.com/j/plant doi: 10.11648/j.plant.20170506.13
ISSN: 2331-0669 (Print); ISSN: 2331-0677 (Online)
Identification of Stability and Adaptability of Small Red
Bean Cultivars Using AMMI Analysis
Tadele Tadesse
*, Amanuel Tekalign, Behailu Mulugeta, Gashaw Sefera
Oromia Agriculture Research Institute, Sinana Agriculture Research Center, Bale-Robe, Ethiopia
Email address:
[email protected] (T. Tadesse), [email protected] (T. Tadesse)
*Corresponding author
To cite this article:
Tadele Tadesse, Amanuel Tekalign, Behailu Mulugeta, Gashaw Sefera. Identification of Stability and Adaptability of Small Red Bean Cultivars Using AMMI Analysis. Plant. Vol. 5, No. 6, 2017, pp. 99-103. doi: 10.11648/j.plant.20170506.13
Received: October 24, 2017; Accepted: November 3, 2017; Published: December 7, 2017
Abstract:
Genotype x location interaction effects are of special interest for breeding programs to identify adaptation targets, adaptive traits and test sites. In order to identify stability and adaptability of small red bean cultivars sixteen genotypes were evaluated at the mid altitude of bale zone southeastern Ethiopia during main season 2015 and 2016. The cultivars were arranged in a randomized complete block design with three replications at each site of Goro, Ginir and Dellomena. The combined analysis of variance for mean grain yield revealed significant variation for genotypes, environment and GE interaction. The analysis of variance for the AMMI (Additive Main effects and Multiplicative Interaction) revealed that significant variation for genotypes, environment and GE interaction. From this analysis 42.53% was explained by AMMI 1 followed by AMMI 2 (28.29%), AMMI 3 (19.76%) and AMMI 4 (7.10%) of the interaction sum of squares. Therefore, the first two AMMI components justified 70.82% of the GE interaction sum of squares. The stability parameters regression coefficient (bi), deviation from regression analysis and ASV identifies G7, G6, G11, G1 and G12 showed the least value for ASV indicating as these genotypes showed stable performance over the sites. However stable cultivar wouldn’t necessarily gave the highest seed yield. Therefore based on Genotype Selection Index (GSI) which considers both the ASV and the mean yield, G8, G3, G6 and G7 were the most stable genotypes identified over the tested environments. Therefore, out of the tested genotypes, G8 and G3 were identified as stable cultivar to be selected for possible release during the coming cropping seasons.Keywords:
Stability, Adaptability, AMMI, ASV, GSI1. Introduction
The common dry bean or Phaseolus vulgaris L., is the most important food legume for direct consumption in the world. Among major food crops, it has one of the highest levels of variation in growth habit, seed characteristics (size, shape, and color), maturity, and adaptation. It also has a tremendous variability (> 40,000 varieties). Germplasm collection in beans compares well with other important commodities on a worldwide basis. Phaseolusvulgaris is produced in a range of crop systems and environments in regions as diverse as Latin America, Africa, the Middle East, China, Europe, the United States, and Canada [20, 27]. Common bean is the most important crop for soil health due its excellent biological nitrogen fixation and food security crops for its source of starch, protein, dietary fiber, minerals and vitamins [4].
common bean varieties at production are more than 15 years old and low seed yielding at small holder’s farm. Therefore, advanced small red common bean lines reported for their higher seed yield potential were introduced and evaluated at multiple locations.
The wide occurrence of genotype x environment interaction (GEI) is the basic cause of difference between genotypes in their yield stability, or in other words: ranking of the genotype depends on the particular environmental conditions where it is grown. Numerous stability parameters have been developed to investigate GEI [14]. Among them Additive main effects and multiplicative interaction (AMMI) analysis [12] is particularly effective for depicting adaptive responses [1, 7]. Parametric stability statistics obtained by linear regression models [9, 11, 23] are mathematically simple and biologically interpretable; however, few researchers use statistical measures of yield stability in their breeding programs. To maintain improved agricultural productivity, the development of varieties with high yielding potential is the ultimate goal of plant breeders in a crop improvement program. In the recent years of haricot bean breeding in Ethiopia, special focuses have been paid to develop varieties with improved grain yield, good seed color and size as well as, resistant to major diseases. In addition to high yielding potential, a successfully developed new cultivar should have a stable performance and broad adaptation over a wide range of environments. However, frequent variation experienced both from season to season and from place to place within a shorter distance is among the most important features of the Ethiopian environmental conditions [10]. The objectives of this study were therefore to identify the most stable bean lines across the studied environments.
2. Materials and Methods
2.1. Testing Sites
In order to see the stability and adaptability of small red bean cultivars 16 genotypes including the checks (Table 1) were evaluated in the mid-altitude of bale zone, southeastern Ethiopia at three locations, Goro, Ginnir, and dellomena during bona 2015 and 2016 cropping season.
2.2. Experimental Design Statistical Analysis
The genotypes were arranged using randomized complete block design with four replications with plot size of 6.4m2 (4 rows at 0.4m spacing of 4m row length). Combined analysis of variance using balanced ANOVA (Analysis of Variance) was computed using Cropstat program. AMMI analysis was performed using the model suggested by [8].
The ASV is the distance from the coordinate point to the origin in a two dimensional of IPCA1 score against IPCA2 scores in the AMMI model [21]. This weight is calculated for each genotypes and environment according to the relative contribution of IPCA1 to IPCA2 to the interaction SS as follows,
ASV= 1 + 2
Where, is the weight given to the IPCA1 value by dividing the IPCA1 sum squares by the IPCA2 sum of squares. The larger the IPCA score, either negative or positive, the more specifically adapted a genotype is to certain environments. Smaller IPCA score indicate a more stable genotype across environment.
Genotype Selection Index (GSI): a selection index GSI was calculated for each genotype which incorporate both mean grain yield and stability index in a single criteria (GSIi) as
GSIi= RYi +RASVi
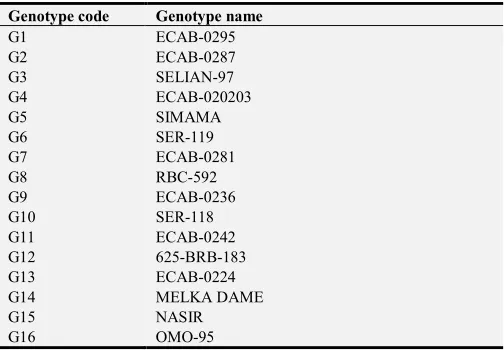
Table 1. Lists of genotypes used in the trial along with their genotypic code.
Genotype code Genotype name
G1 ECAB-0295
G2 ECAB-0287
G3 SELIAN-97
G4 ECAB-020203
G5 SIMAMA
G6 SER-119
G7 ECAB-0281
G8 RBC-592
G9 ECAB-0236
G10 SER-118
G11 ECAB-0242
G12 625-BRB-183
G13 ECAB-0224
G14 MELKA DAME
G15 NASIR
G16 OMO-95
3. Result and Discussions
The combined analysis for the mean grain yield showed that genotypes (G), locations (L), years (Y), genotype x location (GL), genotypes x year (GY), location by year (LY), and genotypes x location x year (GLY) effects were highly significant (p < 0.01) (Table 2). This indicated the diversity of locations and years and presence of substantial genetic differences among the lines for seed yield performance. Similar findings were reported by [2, 18, 24] for common bean varieties performance and their growing environments in Ethiopia. The significant GL, GY, LY, and GLY were also indicated that the relative performance of genotypes at different locations and years was not similar.
Table 2. Combined mean grain yield of Small red bean genotypes tested over three locations (Goro, Ginnir and Dellomena) during meher 2015 to 2016.
Source of variation DF Sum of squares Mean squares
Year (Y) 1 12.0496 12.0496**
Location (L) 2 31.9999 16.0**
Replication 3 0.844609 0.281536**
Genotype (G) 15 8.92123 0.594749**
Y X L 2 10.0307 5.01533**
Y X G 15 3.22062 0.214708**
L X G 30 8.1449 0.271497**
Y X LX G 30 8.34951 0.278317**
RESIDUAL 285 55.8643 0.196015
AMMI analysis: Genotype, location and genotype by environment interaction were assessed by the additive main effect and multiplicative interaction (AMMI) model (Table 3). The analysis of variance of AMMI model for grain yield showed significant effect for genotypes, environment, and GE interaction. These result showed that 65.05% of the total sum of square was attributed to environment effects, only 10.77 and 24.17% to genotype and GE interaction effects, respectively. The effect of environment was responsible for the largest part of the variation, tailed by genotype and genotype by environment interaction. The same result was
reported by [19, 22, 25] and. The GX E sum of squares was 2.24 times larger than for genotypes, which determined substantial differences in genotypic response across environment.
The GE interaction was partitioned into four parts of interaction principal component analysis (IPCA). AMMI 1 accounted for 42.53%, the second AMMI accounted for 28.29%, the third 19.76% and the fourth 7.10% respectively. The first two AMMI accounted for 70.82% of the GE sum of squares. This made as the construction of the biplot and genotype and environment effects [13, 16, 28].
Table 3. Analysis of Variance for the AMMI model for small red bean grain yield (t/ha) of the genotypes across environments.
Source of Variation D.F. S.S. M.S. %TSS
Genotypes (G) 15 2.23833 0.149222** 10.77
Locations (L) 5 13.5158 2.70316** 65.05
G X L 75 5.02163 0.066955** 24.17
AMMI COMPONENT 1 19 2.13592 0.112417** 42.53
AMMI COMPONENT 2 17 1.42043 0.083555** 28.29
AMMI COMPONENT 3 15 0.992167 0.066145** 19.76
AMMI COMPONENT 4 13 0.356746 0.027442** 7.10
GXE RESIDUAL 11 0.116365 2.32
TOTAL 95 20.7767
Stability performance
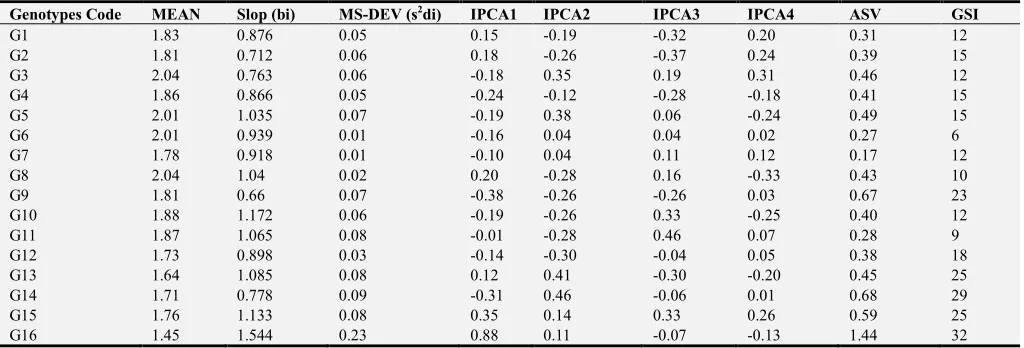
The stability parameters i.e. regression coefficient (bi), deviation from regression (S2di), IPCA scores, AMMI Stability Value (ASV) and Genotype Selection Index (GSI) for the grain yield of the genotypes are presented in Table 4.
According to the result for of the stability parameters, regression of coefficient (bi), G5 (1.035), G8 (1.04), G11 (1.065) and G13 (1.085) showed a value close to unity implying these genotypes are stable over the environments. Furthermore, the deviation from regression for G8 (0.02), G6
(0.01), and G7 (0.01) were the lowest compared to others. The ASV was also lower for G7, G6, G11, G1, G12 and G2. But when we see the mean performance of the genotypes for those which showed lowest ASV it is lower than the mea grain yield. When genotypes were seen against GSI, which explained both the mean grain yield and the ASV, G6, G8, G3, and G7 are the one with the lowest value with high grain yield. Therefore, based on the stability parameters and their higher grain yield G8, G3 and G6 were the most stable genotypes across the studied environments.
Table 4. Mean grain yield, regression coefficient, deviation from regression, IPCA scores ASV and GSI for small red bean genotypes across environments.
Genotypes Code MEAN Slop (bi) MS-DEV (s2di) IPCA1 IPCA2 IPCA3 IPCA4 ASV GSI
G1 1.83 0.876 0.05 0.15 -0.19 -0.32 0.20 0.31 12
G2 1.81 0.712 0.06 0.18 -0.26 -0.37 0.24 0.39 15
G3 2.04 0.763 0.06 -0.18 0.35 0.19 0.31 0.46 12
G4 1.86 0.866 0.05 -0.24 -0.12 -0.28 -0.18 0.41 15
G5 2.01 1.035 0.07 -0.19 0.38 0.06 -0.24 0.49 15
G6 2.01 0.939 0.01 -0.16 0.04 0.04 0.02 0.27 6
G7 1.78 0.918 0.01 -0.10 0.04 0.11 0.12 0.17 12
G8 2.04 1.04 0.02 0.20 -0.28 0.16 -0.33 0.43 10
G9 1.81 0.66 0.07 -0.38 -0.26 -0.26 0.03 0.67 23
G10 1.88 1.172 0.06 -0.19 -0.26 0.33 -0.25 0.40 12
G11 1.87 1.065 0.08 -0.01 -0.28 0.46 0.07 0.28 9
G12 1.73 0.898 0.03 -0.14 -0.30 -0.04 0.05 0.38 18
G13 1.64 1.085 0.08 0.12 0.41 -0.30 -0.20 0.45 25
G14 1.71 0.778 0.09 -0.31 0.46 -0.06 0.01 0.68 29
G15 1.76 1.133 0.08 0.35 0.14 0.33 0.26 0.59 25
G16 1.45 1.544 0.23 0.88 0.11 -0.07 -0.13 1.44 32
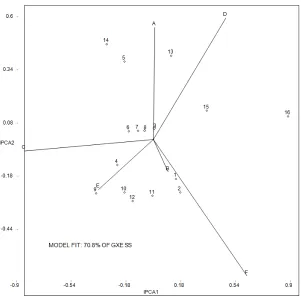
A graphic representation of grain yield showed in AMMI biplot it was generated using the genotypic and environmental score of the first two IPCA (Figure 1). Most of the genotypes showed negative interaction with environment B, E and F. on the other hand, G1, G2, G10, G11 and G12 showed positive interaction with environment B, E and F. Genotypes 5, G13 and G14 were more specifically adapted to
Figure 1. Biplot analysis of GE interaction based on AMM2 model for the first two interactions principal component scores.
4. Conclusion
Genotypes evaluation must be conducted in multiple locations for a number of years to fully sample the target environment [6]. Genotype in the presence of unpredictable GE interaction is a major problem in plant breeding [3]. To select for superior genotypes, it seems that there is no easier way other than to test widely [26] and select for both average yield and stability [15, 17]. According to the results based on mean of grain yield, coefficient of regression, deviation from regression, ASV and GSI genotype 8 and G3 are the genotype with well adaptability in all the studied environments and therefore selected for the possible release in the coming cropping season.
Acknowledgements
Oromia Agricultural Research Institute for the financial support, Sinana Agricultural Research Center for providing all necessary facilities and Pulse and Oil Crops Research Case team staffs for trial management and data collection well acknowledge.
References
[1] Annicchiarico P. 1997. Additive main effects and multiplicative interaction (AMMI) analysis of genotype x location interaction in variety trials repeated over years. Theor. Appl. Genet. 94: 1072-1077.
[2] Asfaw, A., T. Assefa, B. Amsalu, K. Negash, F. Alemayehu, and F. Grum, 2008. Adaptation and Yield Stability of small Red Bean Elite Lines in Ethiopia. International J. of Plant Breed. and Genet., 2(2): 51-63.
[3] Bramel-Cox PJ,. 1996. Breeding for reliability of performance across unpredictable environments. In: Genotyp by environment interaction, Kang MS, and Gauch HG (Eds.) CRC Oress, Boca Raton, FL., 309-339.
[4] Broughton W. J., G. Hernadez, W. W. Blair, S. E. Beebe, P. Gepts. J. Vanderleyden, (2003). Beans Phaseolus Spp.)Model food legumes, Plant Soil 252 (55-128).
[5] Central Statistical Agency (CSA), 2014. Agricultural sample survey. Report on area and production of crop (private peasant holdings, meher season). vol. 1, CSA, Addis Ababa.
[6] Cooper M, Stucker RE, Delacy IH and Harch BD. 1997. Wheat breeding nurseries, target environments and indirect selection for grain yield. Crop Sci., 37: 1168-1176.
[7] Crossa J. 1990. Statistical analysis of multi-location trials. Advance in Agronomy, 44: 55-85.
[8] Crossa J, Fox PN, Pfeiffer WH, Rajaram S and Gauch HG. 1991 AMMI adjustment for statistical analysis of an interactional wheat yield trial. Theor. App Gent, 81: 27-37 [9] Eberhart SA, Russel WA (1966). Stability parameters for
comparing varieties. Crop Sci. 6: 36-40.
[10] Ethiopian Mapping Authority (EMA), National Atlas of Ethiopia, Ethiopian Mapping Authority, Addis Ababa, (1988). [11] Finlay KW, Wilkinson GN (1963). The analysis of adaptation
[12] Gauch HG. 1992. Statistical anlyis of regional yield trials. AMMI analysis of factorial designs. 1st edn, Elsevier, New York, ISBN: 0-444-89240-0.
[13] Gauch HG and Zobel RW. 1996. AMMI analysis of yield trials. In: Kang MS, Gauch HG (eds) Genotype by environment interaction. CRC press Boca Raton FL.
[14] Huehn M (1990). Nonparametric measures of phenotypic stability. Part 1: theory. Euphytica 47: 189-194.
[15] Kang MS. 1997. Using genotype by environment interaction for crop genotype development. Adv. Agron., 62: 199-252. [16] Kaya Y, Palta C and Taner S. 2002. Additive main effects and
multiplicative interactions analysis of yield performance in bread wheat genotypes across environments. Turk J. Agric. For. 26: 275-279.
[17] Lin CS and Binns MR. 1994. Concepts and methods for analyzing regional trial data for cultivar and location selection. Plan breed Rev, 12: 271-297.
[18] Mekbib, F., 2003. Yield stability in common bean (Phaseolus vulgaris L.) genotypes. Euph. 130: 147-153.
[19] Noorul S, Mushaq A, Rakash V, Asifa B and Zahoor A. 2015. Stability analysis in Wheat: An application of additive mani effects and multiplicative interaction. AJAR 10(4): 295-300. [20] Peters, A. (1993). China. Michigan Dry Bean Digest, 17(4):
18-20.
[21] Purchase JL, Hatting H and Vandenventer CS. 2000. Genotype
x environment interaction of winter wheat in south Africa: II. Stability analysis of yield performance. South Afr J Plant Soil,
17: 101-107.
[22] Reza M, Mohammad A, Akbar S, and Amri D. 2007. Identification of Stability and Adaptability in Advance Durum genotypes using AMMI analysis. Asian J. pl. Sci6(8): 1261-1268.
[23] Shukla GK (1972). Some statistical aspects of partitioning genotype environmental components of variability. Heredity. 29: 237-245.
[24] Tamene T. T, S. G. Tadese. 2014. Sites Regression GGE Biplot Analysis of Haricot Bean (Phaseolus vulgaris L.)
Genotypes in three Contrasting Environments. World Journal of Agricultural Research, Vol. 2(5), 228-236.
[25] Tarakanovas P and Rusgas V. 2006. Additive main effect and multiplicative interaction analysis of grain yield of wheat varieties in Lithuania. Agron Res, 4: 91-98.
[26] Troyer AF. 1996. Breeding for widely adapted popular maize hybrids. Euphytica, 92: 163-174.
[27] Wortmann, C. S. and Allen, D. J. (1994). African bean production environments; their definition, characteristics, and constraints. Network on Bean Research in Africa, Occasional Publication Series no. 11. pp. 47. Dar es Salaam, Tanzania. [28] Yan W and Hunt LA. 2001. Interpretation of genotype x