DOI: 10.14738/abr.77.6741.
Kyengo, J. M., Muathe, S. M. A., & Kinyua, G. M. (2019). Empirical Analysis of the Effect of Information Technology Capability on Performance of Food Processing Firms in Nairobi City County, Kenya. Archives of Business Research, 7(7), 31-45.
Empirical Analysis of the Effect of Information Technology
Capability on Performance of Food Processing Firms in Nairobi
City County, Kenya
Justus M. Kyengo
School of Business,
Kenyatta University, Nairobi, Kenya
Stephen M.A. Muathe
School of Business,
Kenyatta University, Nairobi, Kenya
Godfrey M. Kinyua
School of Business,
Kenyatta University, Nairobi, Kenya
ABSTRACT
This study sought to investigate the effect of information technology capability on performance. The target population of the study was 102 registered Food Processing Firms. The study used positivism research philosophy and adopted both explanatory and descriptive research designs. Multistage probability sampling technique was used to selecting 31 firms and 155 respondents. The unit of analysis comprised of the food processing firms whereas the unit of observation consisted of the head of functional areas in these firms. Primary data was collected using semi-structured questionnaires. The researcher adopted positivism research philosophy and a mix of explanatory and descriptive research designs. Multistage probability sampling was used to select 155 respondents. Primary data was collected using self-administered structured questionnaires. Descriptive statistics were used to summarize the characteristics of the sample while simple linear regression analysis was used to test the research hypotheses. The study established that information technology capability has a positive effect on performance. Therefore, management should adopt practices such as technological flow, new ideas and new ways of doing things to shore up performance.
Keywords: Strategic Assets, Information Technology Capability and Organizational Performance
INTRODUCTION
Organizations play an important role in our daily lives and indeed their performance represents a key ingredient of economic development of nations globally (Gavrea, Ilieş & Stegerean, 2011). In view of this, many scholars and practitioners consider organizations as engine of economic, social and political progress. The centrality of performance in enhancing the ability of an organization to realize success in the various strategic objectives areas has made this construct to become one of the most domineering themes in management research. The dynamic nature of the environment and competition in the global economy has heightened the need to identify the drivers of organizational performance. The scope of scholarly activities in search of drivers of organizational performance has been broadened to integrate both tangible and intangibles organizational assets.
market. A central premise of the resource-based view of the firm is that competition in an industry is fundamentally linked to access, control and management of an assortment of strategic assets and capabilities (Barney, 2012). Indeed, the key concern of senior management relates to strategic assets that are fundamental for continued existence and success of firms, and for general economic prosperity in the highly competitive and dynamic global market (Mitrega, 2011). Extant literature is replete with evidence that suggests that corporate resources have potential to enhance the competitive posture of a firm (Gasik, 2011; Rao & Kumar, 2011; Kinyua, Muathe & Kilika, 2015).
According to Youndt et al.(2004), organizational resources that are strategic in nature and have hallmarks of innovativeness are capable of enhancing corporate performance. The resource based view (RBV) holds that the stock of assets held by a firm are an imperative for building competitive advantage and thus ensuring the strategic survival and success of a firm (Dess, Lumkin, Eisner, Lumpkin & McNamara, 2012). It emphasizes that the stock of resources held by a firm in the form of both tangible and intangible assets have a role in explaining performance heterogeneity in an industry. However, RBV proposes that intangible assets such as information technology capability are dominantly inelastic in supply and are thus not easily transferable across the industry making them a source of competitive advantage and superior performance in the long run.
Despite the fact that information technology capability may be easily replicated, specific capabilities that have been mustered by the firm are not easy to copy with the aim for sustained competitive advantage (Santhanam & Harton, 2003). Investment to attain several IT assets in the firm is steered by its strategic plans to ensure value commensurate with performance dimensions that are consistent with the strategic purpose (Arend & Levesque, 2010). Information Technology capability should be a means for attaining strategic integration through application of the capability of Information Technology in the business plan (Zee & Jong, 2009).
Porter and Millar (2005) posits that Information Technology affects competition in many ways such as seen in the industry structure changes and active competition. It can be used to support the creation of new business and taken on board by companies to outperform their competitors. Earl (2009) suggests that Information Technology is potentially a strategic tool of operation. Information Technology’s benefit is not only confined to making business processes and tasks more efficient but it facilitates the efficient production of products and services, clear distribution channels, stronger connection to/with customers, suppliers and all pertinent stakeholders of the business.
Information Technology, in its own right has no direct value but investment in it has the potential for derived value. The skill and commitment of the principal stakeholders involved with the information systems is a central factor that determines the negative or positive yield from the Information Technology and the investment capacity attached to it. Only when Information Technology is aligned to other resources in the firm, and especially with the principal stakeholders, can there be any benefits or value (Remenyi, 2009). The organization ultimately invests in Information Technology so as to create value for its stakeholders who include customers, employees and shareholders or everyone with a stake or interest in its accomplishments (Ward & Peppard, 2002).
and evaluation systems to help control and observe business performance, to guide managerial actions are some of the capabilities that result from adoption of Information Technology. Customer management capability is also enhanced. Nambisan (2002) explains that it the ability to develop meaningful rapport with customers and develop these relationships to create partners for innovative and new product development. Information Technology also facilitates Process management capability which is described by Sambamurthy, Bharadwaj and Grover (2003) as development of effective processes with full ability enrich, guide and guarantee efficiency in standard activities that include manufacturing, supply chain and finance.
The concept of measurement of organizational performance has always been a central concern and focus of scholars in the field of management particularly because organizational performance is considered the most fundamental criterion for evaluating actions and environments of a business enterprise (Short, McKelvie, Ketchen & Chandler, 2009; Gavrea, Ilieş & Stegerean, 2011; Kinyua, Muathe & Kilika, 2015). In this regard, the existing body of theoretical and empirical literature is replete with evidence of scholarly effort that has been expended in the pursuit to refine the definitions and measurement of organizational performance. Moreover, theoretical and empirical literature has presented different thoughts and arguments concerning the concept of organizational performance.
It has been noted that while some extant researchers have opted to use financial indicators or non-financial indicators, others have used an integration of both in their measurement of organizational performance. Each stream of researchers has presented a strong case for their choice of indicators for operationalizing and evaluating performance of organizations. On one hand, those using financial indicators have contended that finance is crucial organizational resource that primarily precedes other resources required for pursuing corporate goals and objectives and thus financial performance exists at all levels of an organization (Richard, 2009). On the other hand, the researchers using non-financial indicators are of the view that non-financial metrics are relevant for embracing the present and predicting future operating conditions of a business enterprise (Raymond & St-Pierre, 2005, Kinyua, Muathe & Kilika, 2015). However, in this empirical investigation, an integrated approach for evaluating performance which emphasizes financial and non-financial indicators was adopted where performance of food processing firms was measured using profitability, market share and customer retention. This position was considered by the researcher so as to leverage on the two distinct set of indicators for evaluating performance as advocated by Kaplan and Norton (2007).
As noted by the Kenya Association of Manufacturers (KAM), food processing firms are a key driver of economic growth in Kenya just as is the case in many economies globally (KAM, 2016). To this effect the Government has favourably responded to the call for implementation of key infrastructures and improvement of general logistics systems and regional market penetration protocols to support this important segment of the manufacturing sector. However, even with the substantial infrastructural support given to the industry, the Kenya National Bureau of Statistics (KNBS) indicates that food processing firms have been experiencing declining performance in the last three years (KNBS, 2016).
Complex Limited in July 2015, Pecha Food Limited in July 2016, Stawi Food and Fruits Limited in August 2016 and Maz International Limited in March 2017 (KAM, 017).
Existing body of empirical literature indicates that firms' strategic assets such as information technology capability have potential to improve organizational efficiency and effectiveness, hence becoming a source of superior performance (Penrose, 1959; Barney, 2007; Wang, 2011). Past researchers (Alharbi, 2015; Ren, Tsai & Eisingerich, 2015; Vicente, Antunes & Malva, 2016; Loice, Bonuke & Kibet ,2017) have identified marketing capability, IT capability, research and development capability and operational capability as key strategic assets that can improve firm performance.
Pebrianto and Djumhur (2013) in a study involving commercial banks in Southern Kalimantan Province of Indonesia concluded that information technology capability positively affects performance. However, purpose sampling technique was used in selecting the respondents implied resulting in a sample that was not representative of the study population. Turulja and Bojgoric (2016) concluded that information technology capability facilitates innovations which in turn influence firms’ performance positively. Nevertheless, key assumptions of empirical model adopted were not tested. Takahashi, Bulgacov and Giacomini (2016) found out that operational capability mediates the relationship between dynamic capabilities and performance. However, the reliability of the research instrument used was not statistically tested. In view of the research problem and research gap identified, this study sought to investigate the effect of information technology capability on performance of food processing firmsin Nairobi City County, Kenya.
The study was of cross-sectional nature and confined to food processing firms operating within the Nairobi City County, Kenya. The study involved information technology capability and performance as independent and dependent variables respectively. Empirical data was collected form five functional areas of the target firms comprising finance, information communication technology, human resource, marketing and operations in each of the food processing firms. These functional areas were considered to have the relevant information relating to this study. The study was anchored on dynamic capability theory and resource based view of the firm. The study used positivism research philosophy and adopted both explanatory and descriptive research designs. The research data was collected for a period of five year comprising of 2012 to 2016.
LITERATURE REVIEW
The dynamic capabilities theory was first advanced in 1994 by David Teece and Gary Pisano who pursued a resource-based strategy of accumulating valuable technological assets for the company that was often reserved by a defensive approach in light of the company’s intellectual property. Dynamic capability complements the resource based view by going further to explain the nature of sustainable competitive advantage while informing the managerial practices of successful companies (Teece & Pisano, 1994; Teece et al., 2007).
in the market place or to imitate competitors that they see as formidable (Clarke, Seng & Whiting, 2011).
Rivalry is inevitable in Schumpeterian terms and so the firm’s ability to improve or develop new types of capabilities is critical in developing competitive advantage that is long lasting. Arguments of this theory are that the organization capabilities approach builds upon the theoretical foundations presented in related literature such as innovation in architecture, competence in configuration and combinative capabilities (Bani-hani, 2009; Newbert, 2008). Bani-hani (2009) are of the view that dynamic capabilities are developed from previous work on core and distinctive competence (Brenes, Mena & Molina, 2008), core capability and rigidity (Crook et al., 2008). Ambrosini et al. (2009) state that the Capability Based Theory is drawn from RBV’s reasoning. Subsequently, Teece et al. (2007) conceptualized the idea of dynamic capabilities through these studies.
This theory was important as it proposes a theoretical link between firm’s dynamic capabilities, competitive advantage and performance. Dynamic capabilities enable a firm to arrange to arrange, develop and adapt it resources create new value. It emphasizes the ability of a firm to adapt adequately to changes that can have an impact on its functioning and performance in today’s competitive landscape. Firms can shore up their competitive advantage and performance through enhancing existing resource configuration, pursuing temporary advantage and utilizing flexibility in reconfiguring resources. Information technology as a dynamic capability is credited for improvement of business processes, practices and structures and is can therefore be used to drive competitive advantage and ultimately enhance corporate performance. This study is therefore grounded on dynamic capabilities theory.
EMPIRICAL LITERATURE REVIEW
Pebrianto and Djumhur (2013) carried out an empirical investigation on the influence of information technology capability, organizational learning, and knowledge management capability on organizational performance. This study was a census survey involving managers of all commercial banks in Southern Kalimantan Province of Indonesia. Pebrianto and Djumhur adopted explanatory research design and selected the seventy two managers purposely. Information technology capability was operationalized using knowledge, operation and infrastructure of information technology. The results of this investigation showed that information technology capability positively affects performance. The use of purpose sampling in selecting the respondents implied that the sample that was observed was not representative of the study population. The current study sought to bridge this methodological gap through the use of multi-stage random sampling technique in order to attain a representative sample for the purpose of making generalization to the population.
Chen,Wang and Nevo (2014) in an empirical study found out that information technology capability has a positive effect on firm performance. This study focused on the business value of information technology capability. The current study adopt an all-encompassing perspective of IT Capability that reflect the commonalities and potential synergies between firm various strategic assets, IT assets and resources. Since in theory, both RBV and CB theories insinuate that different capabilities of the firm may be complementary, their synergistic interaction is able to improve the effectiveness and efficiency of the firm in positioning resources (Kozlenkova et al., 2014). Helfat et al. (2007) attribute such capability synergies to consistency and linkage in assets and so deliver outputs that are difficult for competitors to replicate.
According to an empirical study conducted by Rai and Tang (2011), information technology capability affects organizational performance positively. The study employed panel data methodology but failed to incorporate random effect model. This study focus of the study in relation to information technology capability ignored operational aspects of this capability which enhances the knowledge of the processes through which such gains are achieved. This study also failed to interrogate the effect of environmental context within which information technology capability is deployed and exploited. The current study employed a more holistic perspective of IT capability in terms of management and operational aspects.
Frink (2011) found out that there was a considerable negative impact of IT capability on Firm performance. It was noted that this finding and conclusion was not consistent with those of other studies that were reviewed (Rai & Tang, 2011; Chen,Wang & Nevo, 2014). The context of this study was also different from that of the current study in terms of the sector as well as geographic scope. The current study enhanced the operationalization of information technology capability. In another study carried out by Krush et al. (2015), IT Capability was found to contribute positively to firm performance. The study employed panel data methodology. The finding of this study were consistent with RBV and DC theories since they suggest that different firm capabilities may be complement each other meaning that the action of one asset positively affects the output from another asset. Unlike this study that focused on only two capabilities, this study included IT, Marketing R&D and operational capabilities.
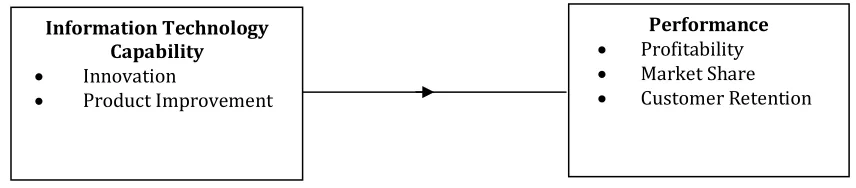
The extensive review of existing theoretical and empirical literature provided the necessary insight for the development of the conceptual framework presented in Figure 1.
Figure 1: Conceptual Framework Source: Author (2018)
Figure 1 show the researchers conceptualized relationship between the independent and dependent variables adopted in this study. The schematic illustration demonstrates the the researcher’s expectation that information technology capability has an effect on performance of food processing firms in Nairobi City County, Kenya. The research hypotheses for this study are;
Information Technology Capability
• Innovation
• Product Improvement
Performance
• Profitability
• Market Share
Ha: Information technology capability affect performance of food processing firms in Nairobi City
County, Kenya
Ho: Information technology capability does not affect performance of food processing firms in
Nairobi City County, Kenya
Information technology capability was measured using innovation and product improvement as the operational indicators. Nevertheless, the indicators of performances of food processing firms comprised profitability, market share and customer retention.
RESEARCH METHODOLOGY
This study adopted positivism research philosophy which as observed by Mertens (2005) and Creswell (2009), is appropriate for quantitative studies as it is directed at explaining causes which influence outcomes and provides a basis for prediction and generalization.
The study utilized both explanatory and descriptive research designs specifically cross-sectional survey as recommended by Saunders, Lewis and Thornhill (2009). Kerlinger and Lee (2000), Robson (2002), and Saunders et al. (2009) explained that the validity of study findings is increased by combining different research designs since they enable triangulation of results. The study used descriptive research design to collect data from the study subjects in their natural state. Moreover, descriptive research design was used to provide information on the characteristics and/or behavior of the sample with respect to statistical measures deriving from the research variables. The explanatory design established the cause and effect relationship between information technology and performance.
The target population of this study comprised of food processing firms registered by KAM and located in Nairobi City County as shown in Table I
Table I: Distribution of Target Population
Category Turnover (Ksh. per annum) Frequency Percentage
Large At least 750,000,001 36 35.2
Medium 500,000,000 to 750,000,000 33 32.4
Small At most 500,000,000 33 32.4
Total 102 100
Source: KRA (2017) and KAM (2017)
According to KAM (2017) there are 102 food processing firms in Nairobi City County in Kenya. This was made of 36 large firms, 33 medium and 33 Small firms making 35.2%, 32.4% and 32.4% respectively.
Table II: Distribution of Sample Size
Strata Size of strata Sampling
Ratio Sample Sampling Factor Frequency Sample Percentage
Large 36 0.3 11 5 55 35.6
Medium 33 0.3 10 5 50 32.2
Small 33 0.3 10 5 50 32.2
Total 31 155 100
Source: Author (2017)
The researcher randomly sampled 30% of the 102 firms; this translated to 31 food processing firms. However, the unit of observation was the key functional areas in each firm. The key function areas include, Finance, Human resource, marketing, ICT, Operations, internal audit, procurement and supplies, research and development, store. For triangulation purpose as argued by Saunders, Lewis and Thornhill (2009) the research randomly selected the five functional areas considered to have adequate and relevant information related to this study. The 31 firms and the five functional areas translated to 155 respondents that formed the unit of observation.
Primary data was collected for the purpose of this empirical study through a structured questionnaire. The closed-ended questions in the questionnaire were constructed on a 5-point Likert scale that facilitated quantitative analysis of data, testing of the research hypotheses and extracting facts and points for conclusion. The questionnaire was divided into two sections. Section A sought general information about the respondents and consisted of three questions. On the other hand, section B focused on specific information regarding IT capability and performance of food processing firms in Nairobi City County in Kenya. In addition, the researcher gathered secondary data through document review encompassing relevant published sources available from the Kenya Association of Manufacturers including KAM Annual Report.
The tests of validity encompassed face, content and construct validity of the research instrument. The researcher ensured face validity by soliciting opinions from the experts in the field of management. Similarly, content and construct validity were ensured through extensive review of existing body of both theoretical and empirical. This provided the basis for revision of the questionnaire and thus enhancing its validity.
A pilot study was carried out where data was collected from eighteen heads of departments in the food processing firms in Nairobi City County. The group of employees involved in the pilot study were excluded from the final research. The pilot study sought to determine the reliability of questionnaire. Cronbach’s Alpha index was computed using STATA software to assess whether the set of items different variables in the research instrument had a good level of internal consistency. The results of analysis of pilot data for internal consistency are displayed in Table III.
Table III: Results of Reliability Test
Research Variable Number of Items Cronbach Alpha Comment
Firm Performance 14 0.914 Reliable
IT Capability 6 0.892 Reliable
Aggregate Score 20 0.903 Reliable
Table III show the various Cronbach alpha statistics obtained from the analysis of reliability. Notably, the values of Cronbach alpha were 0.892 and 0.914 for performance and IT capability respectively. It can also be noted from the results of reliability that the aggregate score of Cronbach alpha associated with the twenty items relating to the two research variables was 0.903. Marczyk, DeMatteo and Festinger (2005) and Field (2009) propose a Cronbach's alpha index of not less than 0.70 as an appropriate measure for demonstrating the reliability of a research instrument. Consequently, the research variables had Cronbach’s alpha values that were greater than the recommended threshold of 0.70.
Data collection is an important process for obtaining useful data required for analysis and is subject to empirical research that is guided by theory (Groves et al., 2009). It is the set of information gathered from the targeted units of a study. A research permit was sought from NACOSTI before commencing the data collection exercise. At the food processing firm level, permission was official requested from the firm management to collect data from their managers. The respondents’ consent was requested and their readiness to be part of the study recorded formally as confirmation of their corporation and willingness to participate. The researcher used drop-and-pick method to administer or distribute the questionnaires to each respondent of the study. The investigator was careful to monitor and control this process by ensuring that all issued questionnaires are collected. A register of questionnaires was maintained for this purpose as it provided a clear account of the issued and the duly filled and returned questionnaires, together with the respective dates.
Before processing the responses, the collected data was prepared for a statistical analysis. Validation and checking was done after the questionnaires have been received from the field. The collected responses were checked to ascertain their clearness, relevance to the study objectives, legibility and suitability. Moreover, the questionnaires were edited for completeness and consistency. Coding was done on the basis of the locale of the respondents. Descriptive and inferential statistics were used to analyze collected data that was quantitative; to aid this STATA version 12 software was used. Under descriptive statistics -percentages, frequencies, means, and standard deviations was calculated and presented in figure and table formats. Analysis of inferential statistics involved the use of simple linear regression analysis. However, as pointed out by Verbeek (2008), it is necessary to test the data for conformity with the assumptions of linear regression before conducting inferential statistics. The researcher therefore conducted diagnostic tests such as - test for sample adequacy, outliers test, normality test, linearity test, homoscedasticity test, multi-collinearity test, and auto-correlation test.
The study was guided by the statistical model presented in model 1
Y = β0 +β1X1 + ε ... 1 Where;
Y = Performance X1= IT Capability
Β0 = Beta coefficient for the constant
β1 = Beta coefficient for the independent variable
ε = Error term
The results of regression analysis were tested for statistical significance using a threshold of 95% level of confidence.
research committee and prerequisite license from NACOSTI shall be obtained. In this study, confidentiality was critical since the information sought is strategic nature to the food processing firms. Hence, permission was obtained from the firms and informed consent of the study participants ensured. These measures enhanced the willingness and objectivity of the respondents. In addition, responses attributed to specific individuals or firm were maintained in strict confidence through use of codes. As recommended by Mugenda and Mugenda (2003) coding helps to uphold confidentiality of the information from individuals in the different food processing firms.
RESEARCH FINDINGS AND DISCUSSION
The results of analysis of response rate revealed that 110 dully filled-in questionnaires were received from the field confirming that response and non-response rate were approximately 73 and 37 percent respectively. The successful response rate of 73.3 per cent is well within the acceptable threshold recommended by Mugenda and Mugenda (2008) for facilitating further statistical analysis in order to make generalizations and conclusions. In the views of Mugenda and Mugenda, a response rate of 50.5% is adequate for analysis and reporting; a rate of 60% is good while a response rate of 70% and over is excellent.
Descriptive Statistics
Sample mean and sample standard deviation were utilized by the researcher to arrive at appropriate summary measures for describing the characteristics of the sample. Descriptive statistics was analyzed on the responses obtained from the respondents on the two variables that were at the center of this investigation. The results of this analysis formed the basis for statistical analysis and making of inferences.
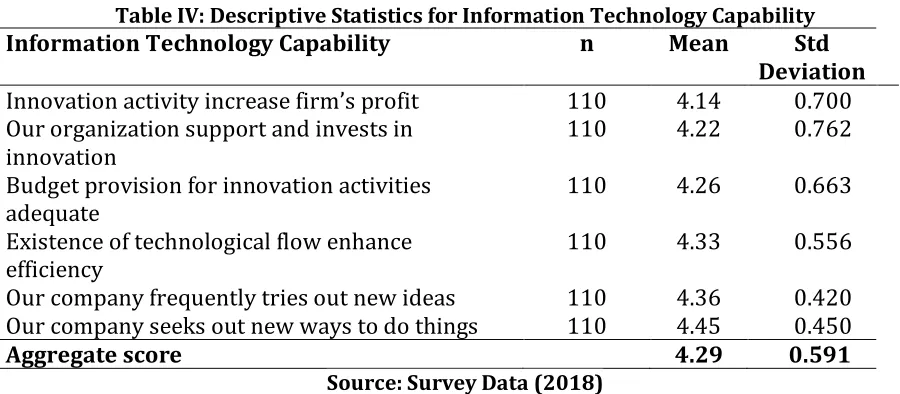
Descriptive statistics were computed to establish the typical behavior and spread of responses respect to the six statements used to measure information technology capability. The results of analysis of descriptive statistics for IT capability are displayed in Table IV.
Table IV: Descriptive Statistics for Information Technology Capability
Information Technology Capability n Mean Std
Deviation
Innovation activity increase firm’s profit 110 4.14 0.700
Our organization support and invests in innovation
110 4.22 0.762
Budget provision for innovation activities
adequate 110 4.26 0.663
Existence of technological flow enhance
efficiency 110 4.33 0.556
Our company frequently tries out new ideas 110 4.36 0.420
Our company seeks out new ways to do things 110 4.45 0.450
Aggregate score 4.29 0.591
Source: Survey Data (2018)
small standard deviation relative to the mean clearly illustrates that the responses from the participants were fairly close to the aggregate mean response.
The range of mean responses for individual items was also small with a high of 4.45 and a low of 4.22 generally indicating that there was consistency in the responses provided. The pattern of standard deviation reported for respective sample means demonstrated that there was low variability of responses and therefore the aggregate sample mean was a reliable statistic for estimating the population mean. The aggregate sample mean and standard deviation confirms that the activities construed to measure IT capability were considered crucial for performance of food processing firms in Nairobi City County.
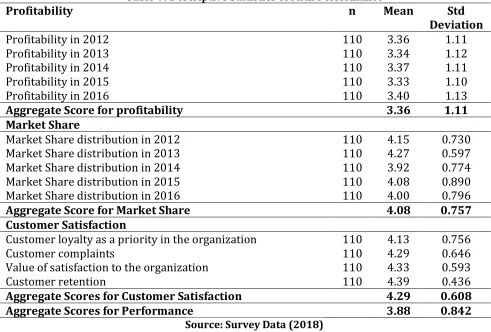
In addition, the researcher conducted analysis of sample measures using the data on responses to the statement regarding performance of food processing firms. This analysis yielded sample means and sample standard deviations for individual and aggregate responses as shown in Table V.
Table V: Descriptive Statistics of Firm Performance
Profitability n Mean Std
Deviation
Profitability in 2012 110 3.36 1.11
Profitability in 2013 110 3.34 1.12
Profitability in 2014 110 3.37 1.11
Profitability in 2015 110 3.33 1.10
Profitability in 2016 110 3.40 1.13
Aggregate Score for profitability 3.36 1.11
Market Share
Market Share distribution in 2012 110 4.15 0.730
Market Share distribution in 2013 110 4.27 0.597
Market Share distribution in 2014 110 3.92 0.774
Market Share distribution in 2015 110 4.08 0.890
Market Share distribution in 2016 110 4.00 0.796
Aggregate Score for Market Share 4.08 0.757
Customer Satisfaction
Customer loyalty as a priority in the organization 110 4.13 0.756
Customer complaints 110 4.29 0.646
Value of satisfaction to the organization 110 4.33 0.593
Customer retention 110 4.39 0.436
Aggregate Scores for Customer Satisfaction 4.29 0.608
Aggregate Scores for Performance 3.88 0.842
Source: Survey Data (2018)
Similarly, the results that the aggregate sample mean score for customer satisfaction was 4.29 with a corresponding aggregate sample standard deviation score of 0.608. This value of aggregate sample mean approximates to a score of 4.00 on the five point rating scale adopted by the researcher. This implies that on average the respondents concurred that prioritizing customer loyalty, customer complaints, value of customer satisfaction and the effect of customer retention on increased performance are important in their food processing firms. Moreover, the overall aggregate sample mean and sample standard deviation for responses on performance measured on the basis of profitability, market share and customer satisfaction were 3.88 and 0.842 respectively. Computation of the variability of responses regarding performance yielded a value of 21.7 percent as the coefficient of variability. This level of variability was low and therefore the sample mean for performance was a stable and reliable estimator of the true (population) mean. The aggregate scores also demonstrated that the activities that were used to indicate performance were practiced in food processing firms.
Test of Hypothesis
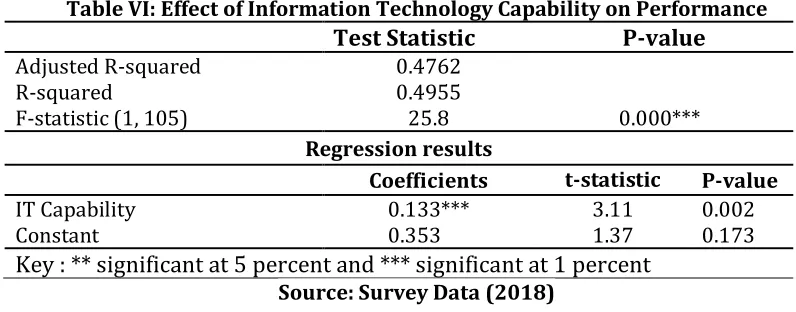
Simple linear regression analysis was performed using STATA in order to estimate a statistical model for determining the effect of IT capability on performance of food processing firms in Nairobi City County. To this end, IT capability was regressed on performance. The results of this statistical analysis are reported in Tables VI.
Table VI: Effect of Information Technology Capability on Performance
Test Statistic P-value
Adjusted R-squared 0.4762
R-squared 0.4955
F-statistic (1, 105) 25.8 0.000****
Regression results
Coefficients t-statistic P-value
IT Capability 0.133*** 3.11 0.002
Constant 0.353*** 1.37 0.173
Key : ** significant at 5 percent and *** significant at 1 percent Source: Survey Data (2018)
The output of the regression analysis in respect of the estimated model demonstrated that the value of R-squared was 0.4955 which corresponds to a product moment correlation coefficient of 0.703 implying that there was a strong positive linear relationship between IT capability and performance. Notably, the value of adjusted R-squared which essentially represents the coefficient of determination was 0.4762 percent. Thus, the estimated linear model accounted for 47.62 percent variation in performance of food processing firms in Nairobi City County, Kenya.
chance and therefore can be attributed to the four dimensions of independent variable chosen for this study.
The output of the regression coefficients that provide information on the parameters regarding the y-intercept and slopes of the regression line corresponding to the predictor variable. The parameters of the model signified by the beta coefficients are in essence a representation of the actual effect of IT capability on performance of food processing firms in Nairobi City County, Kenya. The results of regression coefficients displayed in Table VI were used to generate the statistical model below.
Performance = 0.353 + 0.133 Information Technology Capability ……Model 2
Generally, the calculated probability values for the parameters associated with the predicator variable is less than the 0.05 threshold adopted as criterion for testing corresponding hypotheses. However, it can be noted that the calculated probability value for the parameter associated with y-intercept is greater than the 0.05 threshold for level of significance. Therefore, it is apparent that incase the predictor variable is held at a constant zero, performance of food processing firms surveyed would be at 0.353, however, the calculated probability for this parameter is 0.173 comparatively greater than 0.05 and thus there is no sufficient statistical evidence to reject the null hypothesis that the y-intercept is equivalent to zero.
The study sought to determine the effect of information technology capability on performance of Food Processing Firms in Nairobi City County, Kenya. The null hypothesis that was associated with this objective postulated that information technology capability has no significant effect on performance of Food Processing firms in Nairobi City County, Kenya. The beta coefficient for information Technology capability was 0.133, with a t-statistic of 3.11 and a corresponding calculated probability value of 0.002. This calculated probability was less than the 0.05 level of significance chosen as the threshold for testing the null hypothesis. Therefore, the null hypothesis was rejected implying that at 95 percent level of confidence, information technology capability has a statistically significant effect on performance.
The results demonstrated that when information technology capability is increased by 1 unit, performance of food processing firms increases by 0.133 units and vice versa. The researcher thus concludes that information technology capability has an effect on performance of Food Processing Firms in Nairobi City County, Kenya. These findings agree with the reviewed empirical literature on information technology capability. For instance, the findings corroborate the conclusion made by extant researchers confirming that information technology capability has a positive contribution to firm performance (Rai & Tang, 2011; Pebrianto & Djumhur, 2013; Chen,Wang and Nevo, 2014; Turulja & Bojgoric, 2016).
CONCLUSION AND POLICY IMPLICATION
Further statistical analysis confirmed that the dimension of IT capability has a statistically significant effect on performance. Therefore, IT capability positively contributes to performance of food processing firms in Nairobi City County, Kenya. The researcher therefore concludes that information technology capability positively affects performance of performance of food processing firms in Nairobi City County, Kenya. Information technology capability was found to have a positive effect on performance of food processing firms. Therefore, it’s instructive for management to promote activities and practices associated information technology capability amongst of food processing firms in Nairobi City County, Kenya. Relevant policies should be formulated to inform practice regarding performance of activities encompassing innovation and product improvement.
SUGGESTIONS FOR FURTHER RESEARCH
The findings and inferences made from this study are delimited to the constructs of IT capability and performance in the context of food processing firms in Nairobi City County. It is therefore necessary for future researchers to undertake similar or replicative empirical studies in food processing firms in other Counties in Kenya as well as in other organizations and industries in order to validate the findings and conclusions of this study. In addition, future research work should focus on investigating the moderating and mediating role of variables such as firm size and firm strategy on the relationship between IT capability and performance. Similarly, other factors that may not have been accounted for in the direct relationship as implied by the coefficient of determination may also warrant the attention of future researchers.
References
Barney ,J., Wright, M. & Ketchen, D. J. (2001). The RBV of a firm; Ten years after 1991, Journal of Management 27 (6):.625 -641.
Clarke, M., Seng, D., & Whiting, R. H. (2011). Intellectual capital and firm performance in Australia. Journal of Intellectual Capital, 12(4): 505–530.
Frink (2011). An examination of Employee Reactions to perceived corporate citizenship, Journal Of Applied Psychology….
Gavrea, C., Ilieş, L. & Stegerean, R. (2011). Determinants of Organizational Performance: the Case of Romania.
Management and Marketing Challenges for the Knowledge Society, 6(2), 285-300.
Kanibir, H., (2014). 10th International strategic management conference 2014: A Research Article
Kenya Association Manufactures of Kenya, (2016). Quarterly sector Statistics Report 2017. Retrieved 2017, June 16 from www.kam.go.ke.
Krasnikov & Jarachandran (2008).Do market orientation and innovation improve organizational performance An international and comparative review of the effects page 19.
Nkatha, G. (2012). Competitive advantage and performance. Business Journal Africa, 30-50
Pebrianto, A. & Djumhur, S. K. (2013). Influence of Information Technology Capability, Organizational Learning, and Knowledge Management Capability on Organizational Performance: A Study of Banking Branches Company in Southern Kalimantan Province. Information and Knowledge Management, 3(11), 112-120.
Remenyi, D. (2009). Multi-tasking : The uncertain impact of technology on knowledge workers and managers: The
Electronic Journal Information Systems Evaluation, 12(1).
Sambomirthy V. , Bharadwaj A. & Grover V. (2003). Shaping agility through digital options : Re-conceptualing the role of information technology in contemporary firms…
Teece, D., & Pisano, G. (1994). The dynamic capabilities of firms: An introduction. IIASA Working Paper. IIASA, Laxenburg, Austria, WP-94-103 Retrieved from http://pure.iiasa.ac.at/4109/
Turulja, L. & Bojgoric, N. (2016). Innovation and Information Technology Capability as Antecedents of Firms’ Success. Interdisciplinary Description of Complex Systems, 14(2), 148-156.
Vicente, M., Antunes, M. J. & Malva, M. (2016). The Impact of Marketing Capabilities, Technological Capabilities and Organizational Innovation on Export Performance. Universidade Europeia. ICEMC 2016, 328-337.
Ward J. & Peppard J. (2002). Strategic planning for information systems ( 3rd Edition)