resources
management
–
understanding
and
balancing
inter
actions
betw
een
humankind
and
n
ature
An assessment of temporal effect on
extreme rainfall estimates
Samiran Das1, Dehua Zhu1, and Cheng Chi-Han2
1School of Hydrology and Water Resources, Nanjing University of Information Science and Technology,
Nanjing, China
2Taiwan Research Institute on Water Resources and Agriculture, Taiwan (R.O.C.)
Correspondence:Samiran Das ([email protected])
Received: 31 December 2017 – Accepted: 17 January 2018 – Published: 5 June 2018
Abstract. This study assesses the temporal behaviour in terms of inter-decadal variability of extreme daily
rainfall of stated return period relevant for hydrologic risk analysis using a novel regional parametric approach. The assessment is carried out based on annual maximum daily rainfall series of 180 meteorological stations of Yangtze River Basin over a 50-year period (1961–2010). The outcomes of the analysis reveal that while there were effects present indicating higher quantile values when estimated from data of the 1990s, it is found not to be noteworthy to exclude the data of any decade from the extreme rainfall estimation process for hydrologic risk analysis.
1 Introduction
The temporal assessment of rainfall extremes is necessary to understand its temporal behavior which will lead to bet-ter assess the frequency of extreme rainfall under climate change, and subsequently the flood risk. Since the climate change (e.g. IPCC, 1995) phenomena emerges, a large num-ber of studies appear to find its impact on rainfall. Among them, a substantial research was carried out on rainfall ex-tremes (Bülow et al., 2015; Das et al., 2013; Feng et al., 2007; Ntegeka and Willems, 2008; Su et al., 2008; Tabari et al., 2014; Zhang et al., 2008) as they impact the society most. The outcome is not one dimensional- a significant variability is observed in some regions whereas in some cases, a number of regions do not show much variation that prove to be sig-nificant (e.g. Alexander et al., 2006; Damberg and AghaK-ouchak, 2014; Feng et al., 2007). The data length and type of diagnostic tools can also influence the outcome (Ntegeka and Willems, 2008). A regional behavior is also recognized in those studies (Alexander et al., 2006).
The Mann Kendall and the Spearman rho tests are mostly used approaches to assess the temporal variability. In a more recent time, the quantile perturbation method (Ntegeka and Willems, 2008; Tabari et al., 2014) is used to assess the decadal variability in terms of identify the changes in the
ex-tremes for particular return periods. The peak-over-threshold (POT) data was used so that a longer data series can be gathered in a decade. All the above approaches are non-parametric.
This study introduces a new parametric approach to assess the temporal variability of rainfall extremes for the Yangtze River Basin, a major development area of China. A number of studies were carried out to investigate observed long-term trends and patterns in extreme precipitation events in china (e.g. Fu et al., 2013) including the Yangtze Basin (e.g. Su et al., 2008) in order to assess the regional response to climate change. A summary of the outcomes was reported, among others, by Chen et al. (2012) who also recognized that only a few studies were concentrated on to assess decadal variabil-ity of rainfall extremes. This study aims to investigate the issue further in terms of inter-decadal variability of extreme daily rainfall of stated return period relevant for hydrologic risk analysis. In particular, the study aims to address the fol-lowing research objectives:
– whether climate change has a significant role in decadal
57206
56144 58345
56167 58436
56374
57562 57584 57614
57606
57799 56671
120°0'0" E 110°0'0" E
100°0'0" E 90°0'0" E
30°0'0" N
20°0'0" N
±
Legend
Meteorological stations (upper) Meteorological stations (middle & lower)
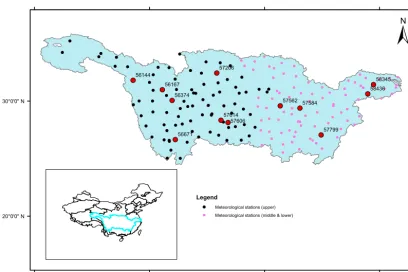
Figure 1.Locations of meteorological stations on the map of Yangtze River Basin.
Figure 2.L-moment ratio diagram indicating the average value of L-moment ratios of 1-day AM rainfall series fall on the theoretical line of the GEV distribution.
– whether recent datasets really provide more reliable
pre-dictions of design extreme rainfall to be used in engi-neering purposes
2 Methodology
The approach examines whether rainfall quantiles estimated for a decade as well as the most recent changes in extreme quantiles can be qualified as statistically significant in com-parison with the natural temporal variability. A major draw-back of performing decadal variability in a parametric setup
is that a limited number of data set is available in a decade to fit with the selected probability model. In this study, a regional approach in region-of-influence (ROI) form (Burn, 1990; Das and Cunnane, 2012; Institute of Hydrology, 1999) is used to study the decadal quantile behavior. The ROI method is an objective way of forming a homogeneous pool-ing group/region for a site with limited data aimpool-ing to per-form a frequency analysis. In this approach, annual maxi-mum rainfall series are pooled from other homogeneous sta-tions and perform frequency analysis based on index-flood
method (Dalrymple, 1960). The estimation ofPT,T-year
re-turn period rainfall depth, based on this approach involves
derivation of a growth curveXT which shows the relation
between XT and the return period T where XT =PT/PI
andPI is the index measurement (e.g. mean or median of
the at-site annual maximum rainfall series) at the site of in-terest (Das, 2017). A suitable probability distribution func-tion is required to estimate quantiles. A detailed explanafunc-tion of the method including the criteria that form homogeneous groups can be obtained from Das (2017). This study uses ge-ographical proximity to group stations which give promising results in many ROI based extreme rainfall study (Kyselý et
al., 2011; Reed et al., 1999). The 5T rule (Institute of
Hy-drology, 1999) (the total number of station years of data to
be included when estimating theT year event) is applied to
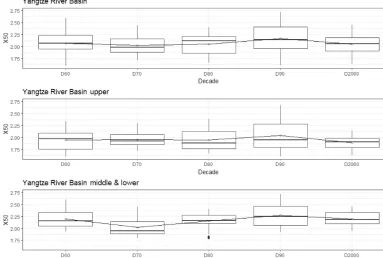
Figure 3.Variation of X50 with decades from each individual stations’ pooling group.
regional approach is appealing because it reduces the vari-ability of the estimates and reflects the changes in a best pos-sible manner.
With this approach, a homogeneous pooling/regional group for a particular decade is selected from gauged stations that are available in that particular decade and a frequency analysis is performed for a target site. A decade consists of 10 annual maximum (AM) data points but with this approach a large number of AM data is available for that particular decade which will lead to achieve a reliable estimate.
In order to test whether the variability is statistically sig-nificant, the study outlines confidence intervals based on a parametric Monte Carlo method. In this test, a baseline AM rainfall series is first fitted to a distribution after which ran-dom samples are generated from the distribution, and confi-dence intervals are estimated. In the present study, the base-line series is chosen as the long-term historical datasets from which the base quantile is estimated while the other one is from the group of series taken from a particular decade of in-terest. After assessing the decadal variability, the confidence intervals are also estimated and overlaid on the same chart. It is therefore graphically possible to identify periods that demonstrate significant departures under the hypothesis of no trend of rainfall extremes.
3 Study area and data
This study selects Yangtze River Basin to analyze decadal be-havior in annual maximum (AM) daily rainfall series of over
Table 1.Decadal datasets.
Decade Period of No. of Stations record available 1960 1961–1970 163 1970 1971–1980 165 1980 1981–1990 161 1990 1991–2000 157 2000 2001–2010 151
a 50-year period (1961–2010). The basin is analyzed with two major distinct climatic conditions: upper and middle-lower. A total number of 180 stations are available in the study area. They are displayed on the map in Fig. 1. The datasets were obtained from the National Meteorological In-formation Center of China Meteorological Administration (CMA). Data of these stations have different record length and have different starting and ending year.
Table 1 lists the number of stations that are available for each decade. Only stations which have a minimum of 9 years of data available are included for that particular decade. There are 144 stations for which AM data are available for 5 decades.
4 Result and discussion
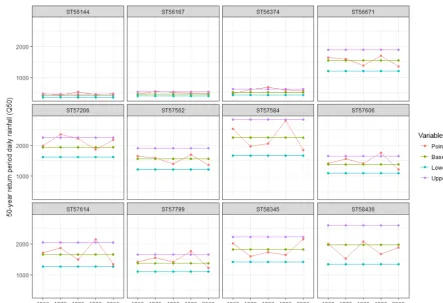
Figure 4.P50(mm) for selected decades together with 95 % confidence intervals to define statistically significant changes.
(Das, 2016; Hosking and Wallis, 1997) is used to identify an appropriate distribution. The LMRD diagram shown in Fig. 2 identifies the generalized extreme value (GEV) as the most suitable distribution for the Yangtze Basin. The formula for estimating growth factors and the associated quantiles based on the GEV can be obtained from Das and Cunnane (2011).
Growth factors, XT (e.g. standardized values) estimated
for each decade of 144 stations are analyzed first to show the general temporal behavior. The study analyzes extremes in
terms of 50 year return period values (X50). They are
esti-mated based on pooling groups of size 250 station-year (i.e.
25 stations) that satisfy the 5T rule. For each of these 144
stations, the pooling group for particular decade was selected from stations that are available in that particular group. The
values ofX50 for each decade for each station are displayed
in Box-Plot form in Fig. 3. The largest averageX50value
oc-curs in decade 90 for both the Upper and the Middle-Lower reaches. The average smallest value occurs in decade 70. The
upward trend of averageX50 in decade 90 is the main
con-tribution to the increase in extreme rainfall in the Yangtze Basin, which can partly explain the intensification of flood-ing in the 1990s which was also noticed by Su et al. (2008). But the trend decreased in the following decade indicating that it is not worthwhile to take only recent data for frequency analysis.
This method also permits to identify whether the decadal variability occurred in an individual station is significant or not. A number of stations shown bold in Fig. 1 are chosen to represent for that particular region. They can be classified as Upper (West stations 56144, 56167, 56374; South station 56671; North station 57206; Upper-East stations 57614, 57606), Middle (stations 57562, 57584, 57799) and Lower (stations 58345, 58436). The decadal
quantile,P50 of rainfall extremes are shown in Fig. 4. The
confidence intervals in Fig. 4 represent the 95 % bounds of random variation under the null hypothesis of no trends.
The different decade’s values (anomalies) came out sig-nificant for different location of Yangtze basin. In the
Upper-West basin, the 1980 decade value ofP50is larger than those
of the other decades with some cases significant values were also observed for that decade. However, the quantiles are sig-nificantly lower than those of the other parts of the Yangtze
Basin. The 1970 decade value ofP50came out significant for
Based on the dimensionless standardized growth factor of 50 year return period value, the average largest value oc-curred in the 1990s but a dip ococ-curred in the following decade. There are some case studies conducted to see the nature of the decadal variability in several stations of the Yangtze Basin with significant test. In general, the 1980s decadal quantile value came out as the largest in the far Upper, the 1990s value came out as the largest in the Mid-dle with some being proved significant, and the 2000s value came out as the largest for the lower basin. So far the out-come of the analysis reveal that while there were small ef-fects present indicating higher quantile values when esti-mated from data of decade 1990, it is found not to be worth-while to exclude the data of any decade from the extreme rainfall estimation process for hydrologic risk analysis.
Data availability. The observed daily rainfall data series of se-lected stations were obtained from the National Meteorological In-formation Center of China Meteorological Administration (CMA). CMA owns the datasets and a formal request is required to obtain the required datasets.
Competing interests. The authors declare that they have no con-flict of interest.
Special issue statement. This article is part of the special issue “Innovative water resources management – understanding and bal-ancing interactions between humankind and nature”. It is a result of the 8th International Water Resources Management Conference of ICWRS, Beijing, China, 13–15 June 2018.
Acknowledgements. The research is funded by Nanjing Univer-sity of Information Science and Technology in the form of a grant (Grant no. 2243141501015) of the first author.
Edited by: Dingzhi Peng
Reviewed by: Qinglan Li and one anonymous referee
References
Alexander, L. V., Zhang, X., Peterson, T. C., Caesar, J., Gleason, B., Klein Tank, A. M. G., Haylock, M., Collins, D., Trewin, B., Rahimzadeh, F., Tagipour, A., Rupa Kumar, K., Revadekar, J., Griffiths, G., Vincent, L., Stephenson, D. B., Burn, J., Aguilar, E., Brunet, M., Taylor, M., New, M., Zhai, P., Rusticucci, M., and Vazquez-Aguirre, J. L.: Global observed changes in daily climate extremes of temperature and precipitation, J. Geophys.
a region of influence approach, Water Resour. Res., 26, 2257– 2265, 1990.
Chen, H., Sun, J., and Fan, K.: Decadal features of heavy rain-fall events in eastern China, Acta Meteorol. Sin., 26, 289–303, https://doi.org/10.1007/s13351-012-0303-0, 2012.
Dalrymple, T.: Flood frequency methods, U.S. Geol. Surv. 1543-A, 11–51, 1960.
Damberg, L. and AghaKouchak, A.: Global trends and patterns of drought from space, Theor. Appl. Climatol., 117, 441–448, https://doi.org/10.1007/s00704-013-1019-5, 2014.
Das, S.: An assessment of using subsampling method in selection of a flood frequency distribution, Stoch. Env. Res. Risk A., 31, 1–13, https://doi.org/10.1007/s00477-016-1318-3, 2016. Das, S.: Performance of region-of-influence approach of frequency
analysis of extreme rainfall in monsoon climate conditions, Int. J. Climatol., 37, 612–623, https://doi.org/10.1002/joc.5025, 2017. Das, S. and Cunnane, C.: Examination of homogeneity of selected
Irish pooling groups, Hydrol. Earth Syst. Sci., 15, 819–830, https://doi.org/10.5194/hess-15-819-2011, 2011.
Das, S. and Cunnane, C.: Performance of flood frequency pooling analysis in a low CV context, Hydrolog. Sci. J., 57, 433–444, https://doi.org/10.1080/02626667.2012.666635, 2012.
Das, S., Millington, N., and Simonovic, S. P.: Distribution choice for the assessment of design rainfall for the city of London (On-tario, Canada) under climate change, Can. J. Civil. Eng., 40, 121– 129, https://doi.org/10.1139/cjce-2011-0548, 2013.
Feng, S., Nadarajah, S., and Hu, Q.: Modeling Annual Ex-treme Precipitation in China Using the Generalized ExEx-treme Value Distribution, J. Meteorol. Soc. Jpn., 85, 599–613, https://doi.org/10.2151/jmsj.85.599, 2007.
Fu, G., Yu, J., Yu, X., Ouyang, R., Zhang, Y., Wang, P., Liu, W., and Min, L.: Temporal variation of extreme rain-fall events in China, 1961–2009, J. Hydrol., 487, 48–59, https://doi.org/10.1016/j.jhydrol.2013.02.021, 2013.
Hosking, J. R. M. and Wallis, J. R.: Regional frequency analysis: an approach based on L-moments, Cambridge University Press, 1997.
Institute of Hydrology: Flood Estimation Handbook, Vol. 1–5, In-stitute of Hydrology, Wallingford, UK, 1999.
IPCC: Climate Changes 1995, Contribution of Working Group I to the Second Report of the Intergovernmental Panel on Climate Change, 141–193, 1995.
Kyselý, J., Gaál, L., and Picek, J.: Comparison of re-gional and at-site approaches to modelling probabilities of heavy precipitation, Int. J. Climatol., 31, 1457–1472, https://doi.org/10.1002/joc.2182, 2011.
Ntegeka, V. and Willems, P.: Trends and multidecadal oscillations in rainfall extremes, based on a more than 100-year time series of 10 min rainfall intensities at Uccle, Belgium, Water Resour. Res., 44, https://doi.org/10.1029/2007WR006471, 2008.
extreme precipitation over the Yangtze River Basin, Quaternary Int., 186, 22–31, https://doi.org/10.1016/j.quaint.2007.09.001, 2008.
Tabari, H., AghaKouchak, A., and Willems, P.: A per-turbation approach for assessing trends in precipita-tion extremes across Iran, J. Hydrol., 519, 1420–1427, https://doi.org/10.1016/j.jhydrol.2014.09.019, 2014.