Publication Date: June. 25, 2018
DOI: 10.14738/abr.66.4411.
Göl, B., & Demirel, G. (2018). A Relational Study on Individual Values: An Example from Turkey. Archives of Business Research, 6(6), 270-302.
A Relational Study on Individual Values: An Example from
Turkey
Buket Göl
MBA graduate,
Yeditepe University, Istanbul, Turkey
Gönül Demirel
Assoc.Prof.Dr., Department of Business Administration, Yeditepe University, Istanbul, Turkey,
ABSTRACT
A major concern for institutions especially over the past few decades has been the recognition of individual values as among the sources and determinants of intention to quit among employees. In this respect, Schwartz has come up with a general value system based on differences across cultures producing variations in personalities which in turn affect peoples’ behaviors through their actions. Thus, according to Schwartz, universal and culture-specific aspects of values show variation in personalities that in turn dictate the expected employee behavior permitting in this way to form a compatible work environment. In this study, the Schwartz value system is empirically tested to determine its effects on intention to quit for employees working in a software company in Istanbul, Turkey. Sources and determinants of intention to quit due other than to Schwartz individual values have been quite extensively studied in the literature. In the literature, affective commitment, perceived organizational support, and differences in wage expectations have been shown empirically significant as among the determinants of intention to quit. This study aims to determine and test empirically the effects of individual values and affective commitment only on intention to quit. In doing so, the study also aims to test empirically the effects, if any, of Schwartz individual values on affective commitment and affective commitment on intention to quit.
Key words: Schwartz individual values, affective commitment, intention to quit
INTRODUCTION
Cultures are shaped by ecologies and have effect on the development of personalities. Universal and culture-specific aspects of values show variation in personalities. Values and beliefs shape the culture of an organization which dictates the expected employee behavior that permits to form a compatible work environment.
Values are important in staying touch with and getting motivated in life. Values are intimately related to looking for purpose in life and are used as rules and guiding principles to make life easier. In this respect, questions like; what is important to you, what is important about your business, do your personal and business values align, become all the more relevant.
Cultural values represent the implicitly shared conceptual ideas about what is good, right, and desirable in a society (Williams, 1970). Thus, they form the basis for the specific norms that tell people what is appropriate in various situations. The ways that institutions function, their goals and their models of operation, express cultural value priorities.
In this study, a comprehensive value framework is adopted. It has received significant attention and application from scholars due to the fact that value types have been shown to be universal across organizations and cultures (Schwartz, 1997).
People are loyal to their organizations if their personal values match their organizations’ values. Intention to quit is an issue which results in lower employee performance.
Intention to quit reduces employee satisfaction, employee happiness and employee performance. That is why it is important for the organizations to explore the major contributors to intention to quit and organizational affective commitment.
This study attempts to explain if there are any significant relationships between individual values, affective commitment and intention to quit.
Organizations are made up of people who convey their own values and beliefs; the literature defines that values shape the level of affective commitment and intention to quit (Shore, Griffeth, 2003).
It must be emphasized though intention to quit or leave is already a complicated enough variable that may be influenced by a variety of factors other than individual value system. Perceived organizational support (POS) in this respect is best known and has been studied extensively in the literature.
Scope of this research, consists of three constructs, namely; the Schwartz individual values, affective commitment and intention to quit. Individual values as defined by Schwartz are the antecedent on the affective commitment and intention to quit separately, while at the same time affective commitment is the antecedent influencing intention to quit.
This study aims to answer the following research questions;
1) Is there an influence of individual values on intention to quit? 2) Is there an influence of individual values on affective commitment? 3) Is there an influence of affective commitment on intention to quit?
URL: http://dx.doi.org/10.14738/abr.66.4411. 272 LITERATURE REVIEW
Individual Values
The values of managers and employees in organizations are phenomena that have captured the interest of researchers, practitioners, social critics, and the public at large (Shore, Griffeth, 2003). Despite this attention, there is still lack of agreement on what values are and how they influence individuals (Struch, Schwartz and Van der Kloot, 2002).
There is extensive empirical research dealing with the typology and measurement of values, dynamics of value priorities and the relationship between values and attitudes, goals, norms and behavior (Elizur, Borg, Hunt and Beck 1991).
Most of these studies were unable to provide a consistent theory or structure for integration. As a result of these shortcomings, Schwartz proposed a theory related with the content and structure of values. His theory is a significant advancement because it organizes a multitude of separate values into a compact set of value types that are universally recognized across different cultures (Roccas, 1997).
Schwartz defined values as desirable states, objects, goals or behaviors. Values get turned into expressions of goals as central human requirements. Individuals interact with each other and learn how to articulate these requirements in value terms. They learn which goals or values are compatible and thus they build implicit network of associations (Schwartz, 1992).
According to Schwartz’s there are inherent ‘’incompatibilities between personal and social values’’ (Gouveiva, Albuquerque, Clemente and Espinosa, 2002).
Among the ten values, Schwartz found that conflicts or incompatibilities form an integrated structure.
Value concept describes beliefs of individuals and varies across cultures. Those that are related to; ethical and moral values, political and religious values, social values, and aesthetic values show considerable variations in this respect. It has-been questioned that some values are also innate (Boeree, 1997).
Personal values are conditioned by circumstances coming into contact with the others and change over time. Personal values also vary based on the choices that people make. Personal values acquired early in life are relatively difficult to change as they may have resulted from the values of specific groups or systems, religious or political (Boeree, 1997).
Personal values are also affected by differences in family backgrounds, national characteristics and historical environment. However, this should not be understood to mean that values do not posses universal characteristics (Boeree, 1997).
As Rue defines (2001);
Effective decision making requires a thorough understanding of one’s own set of values. Recognizing the corporate values helps improve employees’ job performance and loyalty (Rue, 2001).
Rue (2001) also suggested that creating employee empowerment is necessary for the employees to dedicate themselves to their work and this is only achieved by creating employee enthusiasm and commitment to work.
As Barrett (2005) explains;
“When a situation arises that we have to deal with, there are three different ways we can arrive at a decision on what to do: we can use our beliefs to formulate a response, we can use our values to formulate our response, or we can use our intuition to formulate a response”(Barrett, 2005).
Barrett (2005) further explains that decisions which are based solely on beliefs would be limited by the past experiences of the individuals and would not easily adapt to new situations. Values on the other hand provide means for flexible decision making. Collective action capacity is improved in the organization when the members share a set of values. The environment is less bureaucratic and more flexible. Thus values form ‘’ trust’’ among the members and also between the organization and the customers (Mowday, Steers, Porter, 1979).
Schwartz introduced two more dimensions which are identified in accordance with the conflicts between them (Schwartz, Rubel, 2005).
The first dimension; self enhancement versus self transcendence is related to the conflicts between power and achievement while universalism and benevolence involve showing concern for others’ interests and welfare (Rubel, 1989).
Schwartz’s Theory Of Values
In this study, Schwartz’s theory of human values is used to understand the personal values of people working in an organization.
Schwartz defines values as desirable states, objects, goals or behaviors which are used as normative standards to evaluate and choose among alternative modes of behavior.
As people interact they develop ways of respecting and understanding each other’s values (Struch, Schwartz and Van der Kloot, 2002).
In order to differentiate the values in a meaningful way one has to look for the type of motivational goals they express. Schwartz developed ten value types including different motivations universal to people across cultures. (Struch, Schwartzand Van der Kloot, 2002).
Schwartz then emphasizes each specific value’s central motivational goal. Schwartz (1992, 1994) used his 'Schwartz Value Inventory' with a wide survey of over 60,000 people to identify common values acting as guiding principles for individuals through their life spans.
Schwartz identified ten 'value types' that gather multiple values into a single category: Security, conformity, tradition, benevolence, universalism, self-direction, stimulation, hedonism, achievement and power (See Appendix 1) for description.
URL: http://dx.doi.org/10.14738/abr.66.4411. 274
values are related with various psychological, practical, and social consequences that may or may not be compatible with the pursuit of other value types. Conflicts and compatibilities derive from people pursuing these value types, implying immediate and potential universal set of relations among values (Schwartz, 1997).
For example, the values relating to pursuit of achievement often conflicts with the pursuit of benevolence values. Looking for personal success for oneself may hamper actions aimed at enhancing the welfare of others. Similarly, the pursuit of tradition conflicts with the pursuit of stimulation values. Accepting cultural and religious traditions and ideas handed down from the past is likely to hold back individuals seeking novelty, challenge and excitement (Schwartz, Bilsky, 1987).
The pursuit of benevolence and conformity, however, are compatible. Both involve behaving in a manner approved by one's immediate group. The pursuit of security and power is also compatible, avoiding uncertainty by controlling relationships and resources (Schwartz, 1977).
According to Schwartz (1994), the pattern of relations of conflict and compatibility among value priorities cut in different directions from the centre. Compatible types are in close proximity going around the circle. Traditional values outside of conformity imply that these two value types share a common motivational goal-subordination in favor of socially imposed expectations (Schwartz, 1994).
Schwartz proposes that the total value structure is organized under the two sets of separate, higher-order value types, arrayed on two opposite dimensions. The higher-order types are used to connect basic values to work values.
The first one is openness to change versus conservation values that emphasizes independent thought and action that emphasizes submissive self-restriction, preservation of traditional practices, and protection of stability.
The second one is self-transcendence versus self-enhancement values emphasizing acceptance of others as equals and concern for their welfare (universalism and benevolence) to values that emphasize the pursuit of one’s relative success and dominance over others (power and achievement). Hedonism covers essentials of both openness to change and self- enhancement (Schwartz, 1994).
Emotional attachment of the employees’ to organization is an important determinant of commitment and loyalty. Employees who are affectively committed would have a higher sense of belongingness and identification that increases their participation in the organization’s activities, their eagerness to pursue the organization’s goals, and their desire to stay with the organization (Schwartz, S., Bilsky, W, 1987).
Organizational commitment has a series of multiple levels, consisting of; affective commitment, continuance commitment and normative commitment (Meyer, Stanley, 2002).
Affective Commitment
down offers to quit, even if they face with alternative job offers that are more attractive financially.
The first dimension of organizational commitment in the model is affective commitment, which represents the emotional attachment of employees’ to the organization. According to Meyer and Allen (1997, p 11) affective commitment is ‘the employee’s emotional attachment to, identification with, and involvement in the organization’.
Members who are committed to an organization on affective basis continue working for the organization because they want to (Meyer and Allen, 1991). Members who are committed on affective considerations remain with the organization because they view their personal employment relationship is in accord with the goals and values of the organization.
Affective commitment relates to how people working in an organization feels and forms attitudes, either positive or negative towards the organization. Affective commitment signifies the degree of which an individual identifies and associates with organization (Morrow, 1993; Sheldon, 1971).
Values are long-term goals that act as basic guiding principles in people’s lives. Individuals with different values tend to underline different outcomes and are motivated to achieve different goals (Morrow, 1993; Sheldon, 1971).
Schwartz suggested that there is a significant relationship between his ten individual values and affective commitment. In this study the relationship between Schwartz’s values and affective commitment of the employees will be explored and tested.
Allen and Meyer (1990) distinguish between three different but correlated sub-components of organizational commitment, namely; affective, continuance and normative commitment (Meyer, Stanley, Herscovitch, Topolnytsky, 2002).
Affective commitment refers to ‘an affective or emotional attachment to the organization such that the strongly committed individual identify with, is involved in, and enjoys membership in, the organization’ (Allen & Meyer, 1990, p.2).
In the literature there are studies which demonstrate various constructs related with affective commitment. For instance, organizational justice is correlated more strongly with affective commitment than the other two components (Konovsky and Cropanzano, 1991; Meyer et al., 2002).
On the other hand, there are empirical studies that show that relationship between organizational commitment and procedural justice is positive (Cohen-Charash Spector, 2001; Colquitt et al., 2001).
Using a two-factor model, Sweeney and McFarlin (1993) showed that procedural justice explains organizational commitment better as compared with distributive justice. This was because fair corporate procedures make employees ‘feel they will and get a fair shake from the company and its representatives should they perform well in future, even if current rewards were unfair’ (Sweeney and McFarlin, 1993, p. 37).
URL: http://dx.doi.org/10.14738/abr.66.4411. 276
the organization’s commitment (Shore & Wayne, 1993). Procedural justice is assumed as one aspect of this type of treatment that shows the degree of organizational support (Moorman et al., 1998). Organization’s respect for employees’ rights, with the application of fair procedures, has a positive contribution to perceived organizational support (Moideenkutty, Blau, Kumar, Nalakath, 2001).
In terms of affective commitment, employees with higher level of perceived organizational support would show higher levels of obligation to the organization. In fact, the positive relationship of organizational commitment with perceived organizational support is confirmed in studies conducted in the US (Eisenberger, Armeli, Rexwinkel, Lynch, Rhoades, 2001; Masterson et al., 2000; Rhoades, Eisenberger, Armeli, 2001; Wayne et al., 2002), and the relationship is even stronger for studies conducted outside of the US (Meyer et al., 2002).
Next section describes the literature on intention to quit. Past research has demonstrated that intention to quit is one of the strongest predictors and an immediate precursor of employee turnover (Griffeth et al., 2000; Porter and Steers, 1973; Mobleyet al (1979).
Employees showing emotional bond to the organization are less likely to leave the organization. We propose that there is an inverse relationship between affective commitment and intention to quit. Employees with higher levels of affective commitment are less likely to quit, and vice versa.
Intention To Quit
Intention to quit consists of a series of steps through which employees go before considering alternative employment options (Moideenkutty, U., Blau, G., Kumar, R, Nalakath, A, 2001).
Intention to quit is affected, among others, by job dissatisfaction, lack of commitment to the organization and feelings of stress, which in turn are influenced by job stressors. Job stressors are the factors that set a chain of psychological steps leading to intention to quit (Moideenkutty, Blau, Kumar, Nalakath, 2001). In this respect, they propose that supervisor support acts as a significant intermediary. Supervisor support can help reduce the role of stressors on psychological situations and intentions to quit. Monitoring workloads and supervisor-subordinate relationships by management increase job satisfaction and commitment to the organization (Moideenkutty, Blau, Kumar, Nalakath, 2001).
According to Kottke and Sharafinski (1998) managers must observe both the extrinsic and intrinsic sources of job satisfaction available to employees. This in turn may reduce intention to quit, and subsequent turnover, leading thereby to reduced direct and indirect costs in the organization.. They also point out that other variables, which they call push- pull factors, need to be considered in longitudinal studies (Kottke, Sharafinski, C. E, 1988).
Decision to quit eventually results when job dissatisfaction reaches a point where the employee decides that there is no alternative left other than leaving the organization. (March & Simon, 1958).
search; from intention to search to intention to quit; and from intention to quit to turnover (Mowday, Koberg, McArthur, 1984).
Various empirical tests of the model have been carried out showing that a robust predictor of turnover was intention to quit (Mobley, Horner, Hollingsworth, 1978, Michaels, Spector, 1982, Spencer, Steers, Mowday, 1983, Mowday, Koberg, McArthur, 1984).
To understand the primary issues involved in employee turnover decisions, studies on employee turnover should include three key variables: affective commitment, job satisfaction, and intention to quit (Mobley, Horner, Hollingsworth, 1978, Michaels, Spector, 1982, Spencer, Steers, Mowday, 1983, Mowday, Koberg, McArthur, 1984).
For organizations, in general, employee turnover poses a practical issue in terms of loss of talent along with additional costs of recruitment and training. Literature suggests that organizational commitment and intention to quit are important predictors of employee turnover (Griffeth and Hom, 1995; Griffeth, Hom, Gaertner, 2000).
Intention to quit is a close antecedent since it captures employees’ perceptions and alternative job evaluations (Allen, Shore, Griffeth, 2003; Mobley, Griffeth, Hand, Meglino, 1979). An inverse relationship between affective commitment and intention to quit is also found in other studies (Lum, Kervin, Clark, Reid, Sirola, 1998; Wong, Hui, Law, 1995).
The role of employees’ perceptions of justice in the turnover process has not been sufficiently addressed in the current literature (Griffeth et al., 2000). Earlier studies have come up with two types of justice perceptions: distributive justice and procedural justice. Although, numerous researches have been carried out, only few of them have studied their effects on intention to quit (Dailey, Kirk, 1992).
Job satisfaction is defined as a factor which the work environment fulfills the individual’s needs (Locke, 1976). Any restrictions in this respect are seen as signs of low job satisfaction, poor management and lack of organizational support (Zurn et al., 2005). Shortages resulting in heavy workload are antecedent to job stress and burnout, which have been associated with low levels of job satisfaction (Cowin, 2002).
Reasons for employee dissatisfaction in the literature also take into account lack of participation in decision-making, insufficient relationship with management, low salaries and reduced benefits, lack of job security, poor recognition (Albaugh, 2003). Employee dissatisfaction has also been linked to emotional breakdown and burnout (Aiken et al., 1997).
Herzberg et al. (1959) suggested that an employee’s motivation towards work is better understood when the respective attitude of employee is taken into account (Herzberg et al., 1959). Herzberg (1959) showed the importance of the relationship between attitude and subsequent behavior of the employees by asking the following questions:
1. How can one specify the attitude of any individual toward his or her job? 2. What causes these attitudes?
3. What are the consequences of these attitudes?
URL: http://dx.doi.org/10.14738/abr.66.4411. 278
Intention to Quit
CONCEPTUAL MODEL
The general research model is drawn in Figure 1 below.
Schwartz’s Individual Affective
Values Commitment
Gender
Marital situation
Education Work Exp. Job Position Age
Figure 1 General Research Model
This model proposes to investigate the influence of individual values on 2 main constructs; affective commitment and intention to quit.
Hypotheses
The study has three major hypotheses;
Ha1: Individual values have an influence on affective commitment and explain the variance in it.
Ha2: Individual values have an influence on intention to quit and explain the variance in it.
Ha3: Affective commitment is inversely related with intention to quit and explain the variance in it.
In this research affective commitment enters into the model both as an independent variable and dependent variable. Meyer and Allen (1997) reported that there have been numereous studies where researchers analyzed the relationship between affective organizational commitment and variables that were expected to account for affective organizational commitment. These studies found that the predictions of affective organizational commitment generally occurred in three categories: a) organizational characteristics, b) personal characteristics, c) work experiences.
Organizational characteristics include organizational size, autonomy, and decentralization. Personal characteristics on the other hand are those such as gender, age and organizational tenure. Work experiences consist of factors such as organizational support and fairness. A large body of the organizational commitment research has been aimed at toward the detection of predictors for and outcomes of organizational commitment (Becker, 1990).
In this study, the sub-group differences for the following demographic variables: education, gender, age, tenure (work experience), marital status and job position, are measured for each main construct of the study based on the following supplementary research questions:
1.) Are there differences in demographic variables with respect to intention to quit? 2.) Are there differences in demographic variables with respect to individual values? 3.) Are there differences in demographic variables with respect to affective commitment?
METHODS Data Collection
The empirical research is tested on a conveniently chosen valid sample of 97 employees (out of a total of 113 employees) working in the software industry in Istanbul. Questionnaires are face to face administered.
Measurement Scales
Affective Commitment by Linda Rhodes, Robert Eisenberger and Stephan Arnelli; Affective Commitment to the Organization: Contribution of Perceived Organizational Support, Journal of Applied Psychology, 2001, vol. 86, no: 5 825-836 (see References).
For affective commitment questions a five point Likert scale is used ranging from ‘’strongly disagree’’ to ‘’strongly agree’’. Affective commitment is measured by using 5 questions.
Intention to Quit by Michigan Organizational Assessment Questionnaire (MOAQ)developed initially in 1975 as part of a larger survey instrument measuring employee perceptions; the three-item instrument has been used with many different occupational samples (Cammann et al., 1983) (see References).
Intention to quit is measured by using three questions.
For intention to quit questions a five point Likert scale is used ranging from ‘’definitely’’ yes, to‘’definitely no’’.
Schwartz’s Cultural Values by Schwartz, S.H. (1992), “Universals in the content and structure of values: theory and empirical tests in 20 countries”, in Zanna, M. (Ed.), Advances in Experimental Social Psychology, Vol. 25, Academic Press, New York, NY, pp. 1-65(see References).
For Schwartz’s individual values a five point Likert scale is used ranging from ‘’not important’’ to ‘’very important’’. Schwartz’s individual values are measured by using ten questions.
RESULTS Characteristics Of The Demographic Variables
In this section, the demographic variables; age, marital status, education level, gender, job position, tenure (work experience) is analyzed by using descriptive statistics.
Frequencies of respondents by gender show almost equal percentage distribution with among females 50.5 percent and males40.5 percent. This is similar also for the frequency distribution of respondents by marital status with singles 45.4 percent and married 54.6 percent.
URL: http://dx.doi.org/10.14738/abr.66.4411. 280
As for the distribution of respondents by education levels, 86.6 percent have completed high school and university, whereas only 5.2 percent primary school and 8.2 percent master degrees. Age distribution of the sample shows that 79.4 percent of the respondents are in the 20 - 39 age brackets and 20.6 percent are older than 40 years of age.
According to tenure in the company, majority of respondents have tenure between 1-3 years with 37.1 percent and 9-14 years with 38.1 percent.
Of the distribution of respondents by job position in the company; 70.1 percent are employees, 23.7 percent are in mid-management and 6.2 percent are in the top management categories. As an overall evaluation we can conclude that the respondents have high educational levels and young age distribution as to be expected for a software company.
Descriptive Characteristics Of The Interval Level Variables
Table 5.2.1 Central Tendencies, Dispersion of the Interval Level Variables Schwartz’s Individual Values
Label of Items N Mean Median Mode Std.Dev Min. Max.
SC1 (Power) 97 3,175 3,000 3,00 ,866 0 4
Social status, control
SC2 (Achievement) 97 2,876 3,000 3,00 1,033 0 4
Personal success, competence
SC3 (Hedonism) 97 2,979 3,000 4,00 ,968 0 4
Pleasure and sensuous
gratification for one self
SC4 (Stimulation) 97 2,691 3,000 2,00 ,983 0 4
Excitement, novelty
and challenge in life
SC5 (Self-Direction) 97 2,650 3,000 2,00 1,021 0 4
Independent thought
choosing
SC6 (Universalism) 97 2,443 2,000 2,00 1,154 0 4
Understanding, tolerance
appreciation
SC7 (Benevolence) 97 2,536 3,000 3,00 1,011 0 4
Reservation, enhancement
of welfare
SC8 (Tradition) 97 3,062 3,000 3,00 ,944 0 4
respect, commitment
acceptance of customs
SC9 (Conformity) 97 2,711 3,000 3,00 1,099 0 4
Restraint of actions
inclinations and impulses
SC10 (Security) 97 2,551 3,000 3,00 1,091 0 4
Table 5.2.2 Central Tendencies, Dispersion of the Interval Level Variables Affective Commitment
Label of Items N Mean Median Mode Std.Dev Min. Max.
AC1 Happy to work 97 2,165 3,000 3,00 1,296 0 4
until retirement
AC2 Problems faced by my 97 2,515 3,000 3,00 1,191 0 4
organization are also my
problems
AC3 Proud to tell others 97 2,680 3,000 3,00 1,169 0 4
I work at this
organization
AC4 Working here means 97 2,423 3,000 3,00 1,265 0 4
a lot to me
AC5 Strong sense of 97 2,144 3,000 3,00 1,407 0 4
belonging
Table 5.2.3 Central Tendencies, Dispersion of the Interval Level Variables Intention to Quit
Label of Items N Mean Median Mode Std.Dev Min. Max.
IQ1 Seriously considered 97 2,588 3,000 3,00 1,456 0 4
searching in past six month
IQ2 Now actively searching 97 2,794 3,000 3,00 1,399 0 4
for a new job
IQ3 Intent to leave 97 2,062 3,000 0,00 1,638 0 4
in the near future
Results Of The Exploratory Factor Analysis And The Reliability Analyses
In order to find out the factor structures of Schwartz’s individual values, factor analysis is used with principal components solution with varimax rotation. First, items with factor loading less than 0.50 were discarded. In the next step, items loading under more than one factor with a loading value higher than 0.50 were discarded. For the total variance explained, factors with Eigen values 1.00 or more are taken into consideration. To determine whether or not the sample is suitable for factor analysis, Kaiser-Meyer-Olkin (KMO) Measure of Sampling Adequacy and Bartlett’s test of sphericity tests were used. As explained below four factors found in this study, all suitable according to the KMO and Bartlett tests. For the reliability of the factor constructs, Cronbach’s Alpha is used.
Results of the Factor and Reliability Analysis of Schwartz’s Individual Values
There were originally ten(10)measures for the Schwartz’s individual values entered Into the factor analysis. Initial KMO and Bartlett tests showed that variables were Suitable for factor analysis. After three rotations, the best representation of the items were found by omitting two(2) variables (SC1=Power andSC10= Security) that did not have factor loadings more than 0,5 and did have
URL: http://dx.doi.org/10.14738/abr.66.4411. 282
Table 5.3.1 Factor and Reliability Analysis Results of Schwartz's Individual Values
FACTOR 1: SCA Schwartz’s Individual Values A Factor Loadings
SC2 (Achievement) 0,800
Personal success through
demonstrating competence
SC3 (Hedonism) 0,847
Pleasure and sensuous
gratification for one self
SC4 (Stimulation) 0,892
Excitement, novelty,
challenge in life
SC5 (Self-Direction) 0,826
Independent thought
choosing
SC6 (Universalism) 0,774
Understanding, tolerance
appreciation
SC7 (Benevolence) 0,772
Reservation, enhancement
of welfare
Variance Explained % For FACTOR 1 52,283%
Reliability Cronbach's Alpha For FACTOR 1 0,929
FACTOR 2: SCB Schwartz’s Individual Values B Factor Loadings
SC8 (Tradition) 0,899
respect, commitment
acceptance of customs
SC9 (Conformity) 0,777
Restraint of actions
inclinations and impulses
Variance Explained % For FACTOR 2 24,45%
Reliability Cronbach's Alpha For FACTOR 2 0,823
Kaiser-Meyer-Olkin Value: 0,879
d.f 28
Bartlett Significance Value 0,0000
Chi-Square Value 560,066
Results of the Reliability Analysis for Affective Commitment
Affective commitment scale is adapted from the following original organization commitment scale (Source: Linda Rhodes, Robert Eisenberger and Stephan Arnelli, Affective Commitment to the Organization: Contribution of Perceived Organizational Support, Journal of Applied Psychology, 2001, vol. 86, no: 5 825-836) (see Appendix 3). There are five items for affective commitment in our sample which are:
- I would be happy to work at my organization until I retire
- I really feel that problems faced by my organization are also my problems
- Working at my organization has a great deal of personal meaning to me
- I feel a strong sense belonging to my organization
The results show a high reliability with Cronbach alpha value =0.749 (See Table 5.3.2).
Table 5.3.2 Reliability analysis results for affective commitment
Reliability Statistics
Corrected Item-Total Correlation
Cronbach's Alpha if Item
Deleted
Cronbach's Alpha Items N of
AC1 ,394 ,748
,749 5 AC2 ,519 ,703
AC3 ,609 ,673
AC4 ,542 ,694
AC5 ,523 ,702
Results of the Reliability Analysis for Intention to Quit
Intention to quit scale is adapted from the original intention to quit scale of Cammann C. Fichman M. Jenkins D. Klesh J. “The Michigan Organizational Assessment Questionnaire”, Unpublished Manuscript, Ann Arbor, University of Michigan (see References).
Because there are only three items for the intention to quit and previous empirical research showed high reliabilities we only looked at the Cronbach alpha value for the intention to quit. The three items are:
- I did seriously considered looking for a job in the last six month - Presently I am actively searching for other job
- I intend to leave the organization in the near future.
The Cronbach alpha for the original three items showed an alpha value of 0.835. However, results showed that exclusion of the third item further improves the reliability. With the exclusion of the third item the result proved highly consistent with alpha=0.886 as shown in Table 5.3.3.
Table 5.3.3 Reliability analysis results for intention to quit
Reliability Statistics
Corrected Item-Total Correlation
Cronbach's Alpha if Item
Deleted
Cronbach's Alpha Items N of IQ1 ,797
,886 2 IQ2 ,797
Regression Analyses
Three regressions are run in order to test the effects of independent variables on the dependent variables.
As shown below, the first one is a multiple regression to determine the effects of individual values on affective commitment.
URL: http://dx.doi.org/10.14738/abr.66.4411. 284
The third one is a simple linear regression test to determine effects of affective commitment on intention to quit.
The results show that according to the first two regressions, Schwartz’s individual values have no significant effects on the intention to quit and on affective commitment.
On the other hand the results show that only the affective commitment explains the variances in the intention to quit.
Testing the hypothesis HA1: individual values have an influence on affective commitment and explain the variance in it
Since as the result of the exploratory factor analysis two factors are found out for the construct Schwartz’s individual values our modified hypothesis is:
HA1: At least one of the factors of the construct Schwartz’s values has an influence on affective commitment and explains the variance in it.
In order to test this hypothesis multiple regression analysis is run.
According to the results shown in Table 5.4.1 hypothesis HA1 is rejected because Schwartz’s individual values have no significant influence on affective commitment. The p values of the independent variables SC-A and SC-B are lower than or equal to 0.05.
Table 5.4.1 Regression results between individual values and affective commitment Dependent
Variable: Affective
Commitment
Independent
Variables: Beta t p
(Constant) 5,543 ,000
SC-A 1,801 1,357 ,152
SC-B ,178 0,172 ,864
F 1,922 R Square ,039
p 0,152 Adjusted R Square ,019
Testing the hypothesis HA 2: individual values have an influence on intention to quit and explain the variance in it
Since as the result of the exploratory factor analysis two factors are found out for the construct Schwartz’s individual values, our modified hypothesis is:
HA2: At least one of the factors of the construct Schwartz’s values has an influence on intention to quit and explain the variance in it.
According to the results shown in Table 5.4.2 hypothesis HA2 is rejected because none of the Schwartz’s individual values have influence on intention to quit. The p values of the independent variables SC-A and SC-B are higher than 0,000.
Table 5.4.2 Regression Results between Individual Values and Intention to Quit Dependent
Variable: Intention to
Quit
Independent
Variables: Beta t p
(Constant) 4,424 ,000
SC-A 0,108 0,734 ,465
SC-B -0,326 -2,068 ,041
F 2,285 R Square ,050
p ,089 Adjusted R Square ,030
Testing the hypothesis HA 3: affective commitment has a negative effect on intention to quit and explain the variance in it
In order to test the hypothesis simple linear regression analysis is run.
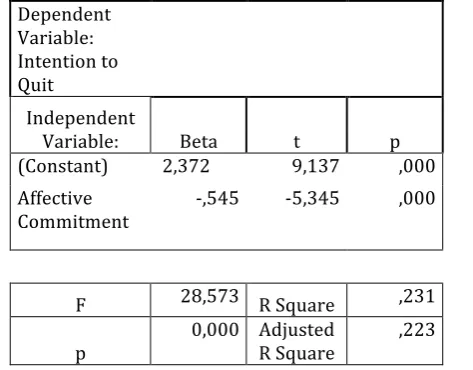
According to the results shown in Table 5.4.3 the model proved significant and the hypothesis HA3 is accepted. The p value of the independent variable, affective commitment, is equal to 0.000 which is lower than 0.05. Explanatory power of the regression model is given by the F value is 28,573 and R square is 0,231. The coefficient Beta is minus 0,545.This means that there is an inverse relationship between affective commitment and intention to quit. As affective commitment value increases (decreases) intention to quit value decreases (increases). For each 0,545level increase (decrease) in affective commitment value there is a 1.000 level decrease (increase) in intention to quit value.
Table 5.4.3 Regression Results between Affective Commitment and Intention to Quit Dependent
Variable: Intention to
Quit
Independent
Variable: Beta t p
(Constant) 2,372 9,137 ,000
Affective
Commitment -,545 -5,345 ,000
F 28,573 R Square ,231
p
0,000 Adjusted R Square
,223
Results Of The Subgroup Difference Tests For The Demographic Variables
URL: http://dx.doi.org/10.14738/abr.66.4411. 286
Respective t and anova tests results are presented and analyzed in the following sections.
Independent Group T Tests
T tests are done for each of the two demographic variables: gender and marital status. The main hypothesis to be tested is:
H0: The variance of intention to quit value is equal for female and male (single and married)
H1: The variance of intention to quit is not equal for female and male (single and married), and
HO b: The mean of intention to quit value is equal for female and male (single and married)
H1 b: The mean of intention to quit is not equal for female and male (single and married).
Independent Group T Tests between Intention to Quit and Gender
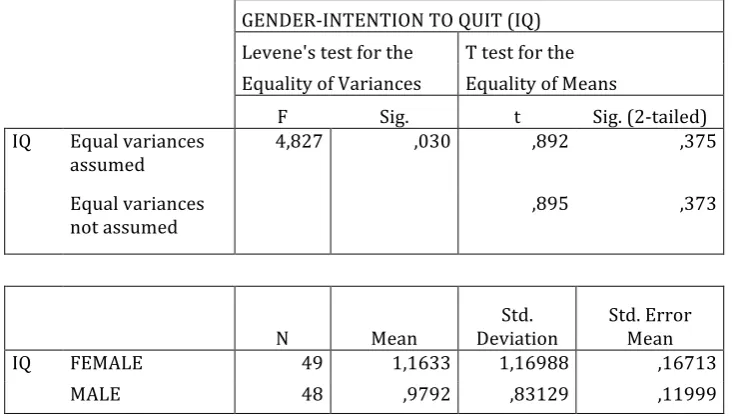
To test for the differences of the mean values for intention to quit for female and male respondents we see that the p value is 0,375 which mean that the difference between the mean values of female respondents’ intention to quit is not significant (mean value for females= 1.1633; mean value for males= 0.9792) which indicate that there is no significant difference between male and female respondents with respect to t intention to quit.
Table 5.5.1.1Independent Group T Tests between Intention to Quit and Gender GENDER-INTENTION TO QUIT (IQ)
Levene's test for the T test for the Equality of Variances Equality of Means
F Sig. t Sig. (2-tailed)
IQ Equal variances
assumed 4,827 ,030 ,892 ,375
Equal variances
not assumed
,895 ,373
N Mean
Std. Deviation
Std. Error Mean
IQ FEMALE 49 1,1633 1,16988 ,16713
MALE 48 ,9792 ,83129 ,11999
Independent Group T tests between Intention to Quit and Marital Status
Table 5.5.1.2Independent Group T Tests between Intention to Quit and Marital Status Levene's test for the T test for the
Equality of Variances Equality of Means
F Sig. t Sig. (2-tailed)
IQ Equal variances
assumed 3,211 ,076 -3,342 ,001
Equal variances
not assumed -3,282 ,002
N Mean Deviation Std. Std. Error Mean
IQ MARRIED 53 ,7736 ,87468 ,12015
SINGLE 44 1,4318 1,06526 ,16059
Independent Group T tests between Individual Values and Gender
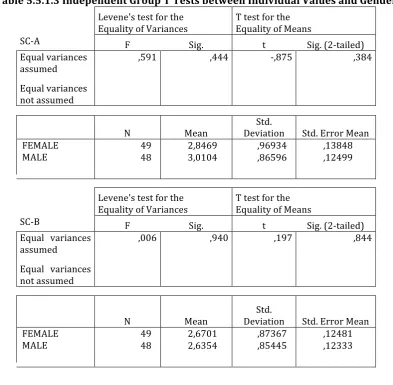
According to the independent group T test result, Levene significance value p = 0.444, which is greater than 0.05 for the individual values factor SC-A. To test for the differences in the mean values for individual values for female and male respondents we see that for the individual value factor SC-A the mean value of female respondents’ individual values is not significantly different than the mean value of male respondents. The same results also hold true for the individual value factor SA-B (see Table 5.51.3).
Table 5.5.1.3 Independent Group T Tests between Individual Values and Gender
Levene's test for the T test for the
Equality of Variances Equality of Means
SC-A F Sig. t Sig. (2-tailed)
Equal variances assumed
,591 ,444 -,875 ,384
Equal variances not assumed
N Mean
Std.
Deviation Std. Error Mean FEMALE
MALE
49 48
2,8469 3,0104
,96934 ,86596
,13848 ,12499
Levene's test for the T test for the
Equality of Variances Equality of Means
SC-B F Sig. t Sig. (2-tailed)
Equal variances
assumed ,006 ,940 ,197 ,844
Equal variances not assumed
N Mean
Std.
Deviation Std. Error Mean FEMALE
MALE
49 48
2,6701 2,6354
,87367 ,85445
URL: http://dx.doi.org/10.14738/abr.66.4411. 288 Independent Group T tests between Individual Values and Marital Status
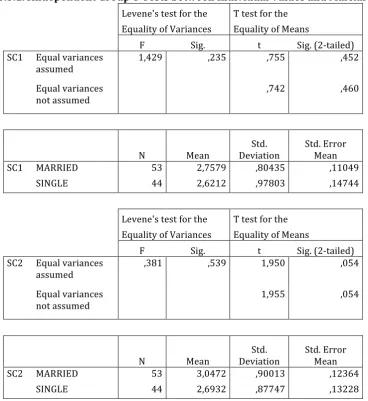
According to the independent group T test result, Levene significance value p = 0.235 which is greater than 0.05for the individual values factor SC-A. H0 is accepted so the variance of individual value factor SC-A is equal for married and single respondents. To test for the differences in the mean values for intention to quit for married and single respondents we see that for the individual value factor SC-A the mean value of single respondents’ intention to quit is not significantly different than the mean value of married respondents. The same results also hold true for the individual value factor SA-B (see Table 5.51.2).
Table 5.5.1.4Independent Group T Tests between Individual Values and Marital Status Levene's test for the T test for the
Equality of Variances Equality of Means
F Sig. t Sig. (2-tailed)
SC1 Equal variances assumed
1,429 ,235 ,755 ,452
Equal variances
not assumed ,742 ,460
N Mean
Std. Deviation
Std. Error Mean
SC1 MARRIED 53 2,7579 ,80435 ,11049
SINGLE 44 2,6212 ,97803 ,14744
Levene's test for the T test for the Equality of Variances Equality of Means
F Sig. t Sig. (2-tailed)
SC2 Equal variances assumed
,381 ,539 1,950 ,054
Equal variances
not assumed
1,955 ,054
N Mean
Std. Deviation
Std. Error Mean
SC2 MARRIED 53 3,0472 ,90013 ,12364
SINGLE 44 2,6932 ,87747 ,13228
Independent Group T tests between Affective Commitment and Gender
Table 5.5.1.5 Independent Group T Tests between Affective Commitment and Gender Levene’s test for the T test for the
Equality of Variances Equality of Means
F Sig. t Sig. (2-tailed)
AC Equal variances
assumed 2,909 ,091 ,180 ,857
Equal variances
not assumed ,181 ,857
N Mean Deviation Std. Std. Error Mean
AC FEMALE 49 2,5714 1,21192 ,17313
MALE 48 2,5313 ,96429 ,13918
Independent Group T tests between Affective Commitment and Marital Status
According to the independent group T test result, for the affective commitment, p = 0.423 is greater than 0.05. H0 is accepted so the variance of affective commitment value is equal for female and male respondents.
Table 5.5.1.6 Independent Group T Tests between Affective Commitment and Marital Status Levene's test for the T test for the
Equality of Variances Equality of Means
F Sig. t Sig. (2-tailed)
AC Equal variances assumed
,647 ,423 1,947 ,054
Equal variances
not assumed
1,943 ,055
N Mean
Std. Deviation
Std. Error Mean
AC MARRIED 53 2,7453 1,06348 ,14608
SINGLE 44 2,3182 1,08954 ,16425
Anova Tests
One way anova tests are done for each of the four demographic variables: education, age, job position in the company and tenure. We run the Anova tests to find out if there are any differences between the demographic variables with respect to intention to quit(IQ), Schwartz’s individual values(SC-A and SC-B) and affective commitment (AC).
Anova tests for education levels
URL: http://dx.doi.org/10.14738/abr.66.4411. 290
Anova test shows that the values of p for the factors: IQ, AC and SA-A are all greater than 0.05 which means that there are no significant differences between the education levels when measured against these factors.
Similarly, Welch and Brown-Forsythe tests shows for the factor SC-B that the p values for SC-B is greater than0.05 which means that there are no significant differences between the education levels when measured against SC-B.
Table 5.5.2.1 Anova tests for education levels
EDUCATION
Test of Homogeneity Test of Equality of
of Variances Means (p values)
Levene
Statistic Brown-
Factors Statistic p Welch Forsythe
IQ 0,497 0,685 0,326 0,217
AC 1,544 0,208 0,471 0,593
SC-A 1,921 0,132 0,674 0,782
SC-B 3,224 0,026 0,889 0,876
EDUCATION
Anova F p
IQ 1,392 0,250
AC 0,961 0,414
SC-A 0,572 0,635
SC-B 0,393 0,758
As a result we can conclude that education levels play no significant role in explaining differences among respondents as far as the intention to quit, individual values and affective commitment are considered.
Anova tests for age levels
The results of the tests are presented in Table 5.5.2.2. We run the anova test for the variable age to find out if there are any differences between the age levels when measured against the factors; intention to quit, affective commitment and individual values SC-A and SC-B.
Levene’s test of the homogeneity of variances show that the p values for all the factors are greater than 0.05 which means that we can continue with the anova test. The anova model proved significant for the factors intention to quit and affective commitment with p values 0,000, which are less than 0.05. This means that there are significant differences between the age levels when measured against the factors, intention to quit and affective commitment.
The anova model did not prove significant for individual values as the p values for the factors SC-A and SC-B are found to be greater than 0.050. To determine which age groups show significant differences when measured against intention to quit and affective commitment, we need to look at the TAMHANE T2 test results.
level has a higher tendency for the intention to quit than other age levels. Mean value of 20-29 age level is equal to 1.7368 and greater than mean values of all the other age levels. To determine which age groups show significant differences when measure against affective commitment we see that the age level 20-29 has a lower affective commitment value for the company (20-29 age group mean value=1.9632) than the other age groups. Within the other age groups there are no significant differences for affective commitment value. Therefore, for both intention to quit and affective commitment, the age group 20-29 has a higher intention to quit and lower affective commitment values as compared with the rest of the other age groups.
Table 5.5.2.2. Anova Tests for Age Levels
AGE
Test of Homogeneity Test of Equality of
of Variances Means ( p values)
Statistic Levene Brown-
Factors Statistic p Welch Forsythe
IQ 1,318 0,273 0,000 0,000
AC 0,805 0,494 0,000 0,000
SC-A 0,441 0,726 0,920 0,915
SC-B 0,837 0,477 0,649 0,662
AGE
Anova F p
IQ 12,393 0,000
AC 9,821 0,000
SC-A 0,156 0,926
SC-B 0,672 0,571
AGE N Mean Deviation Std.
IQ 20-29 38 1,7368 ,99822
30-39 39 ,6795 ,79046
40-49 16 ,6563 ,78991
50+ 4 ,2500 ,50000
Total 97 1,0722 1,01548
AGE N Mean Deviation Std.
AC 20-29 38 1,9632 ,87963
30-39 39 2,4256 ,71991
40-49 16 2,9875 ,80156
50+ 4 3,6000 ,43205
URL: http://dx.doi.org/10.14738/abr.66.4411. 292
TAMHANE T2
Mean
Difference
(I-J) Error Std. Sig.
AGE
IQ 20-29 30-39 1,05735* ,19877 ,000
40-49 1,08059* ,25988 ,001
50+ 1,48684* ,45839 ,018
30-39 20-29 -1,05735* ,19877 ,000
40-49 ,02324 ,25889 1,000
50+ ,42949 ,45783 ,830
40-49 20-29 -1,08059* ,25988 ,001
30-39 -,02324 ,25889 1,000
50+ ,40625 ,48748 ,874
50+ 20-29 -1,48684* ,45839 ,018
30-39 -,42949 ,45783 ,830
40-49 -,40625 ,48748 ,874
TAMJANE T2
Mean
Difference (I-J)
Std.
Error Sig.
AGE
AC 20-29 30-39 -,46248 ,18081 ,096
40-49 -1,02434* ,23641 ,001
50+ -1,63684* ,41698 ,002
30-39 20-29 ,46248 ,18081 ,096
40-49 -,56186 ,23551 ,135
50+ -1,17436 ,41647 ,053
40-49 20-29 1,02434* ,23641 ,001
30-39 ,56186 ,23551 ,135
50+ -,61250 ,44344 ,594
50+ 20-29 1,63684* ,41698 ,002
30-39 1,17436 ,41647 ,053
40-49 ,61250 ,44344 ,594
Anova tests for tenure levels
The results of the tests are presented in Table 5.5.2.3. We run the anova test for the find out if there are any differences between the tenure levels when measured against the factors; intention to quit, affective commitment and individual values SC-A and SC-B.
Levene’s test of the homogeneity of variances show that the p values for the factors other than intention to quit are greater than 0.05 which means that we can continue with the anova test for these factors. For intention to quit we look at the Welch and Brown-Forsythe tests.
significant with p value= 0,000 which means that there are significant differences of tenure levels when measured against affective commitment.
Welch and Brown-Forsythe test proved significant for intention to quit with p value greater than 0.05.This means that there are significant differences of tenure level when measured against intention to quit.
To determine which tenure levels show significant differences when measured against affective commitment and intention to quit we look at the TAMHANE T2 results.
For intention to quit, the mean value of respondents with a tenure level of 1 to 3 years are significantly greater than the mean values of respondents with tenure levels greater than 3 years. Differences between mean values among respondents with tenure levels greater than 3 years did not prove significant.
For affective commitment, the TAMHANE T2 results show that there are significant differences of tenure level of 1 to 3 years with those of higher tenure levels when measured against affective commitment. The mean value of respondents with 1 to 3 years of tenure is significantly lower than the mean values of respondents with greater tenure levels. However, among the tenure levels of 4-8 years and 5-14 years there are no significant differences. The mean value of respondents with tenure level greater than 15 years is significantly greater than the mean values than those with less than 15 years of tenure.
Table 5.5.2.3 Anova Tests for Tenure Levels
TENURE
Test of Homogeneity Test of Equality of
of Variances Means ( p values)
Statistic Levene Brown-
Factors Statistic p Welch Forsythe
IQ 3,947 0,011 0,000 0,000
AC 2,263 0,086 0,000 0,000
SC-A 1,353 0,262 0,842 0,877
SC-B 0,824 0,484 0,769 0,743
TENURE
Anova F p
IQ 10,311 0,000
AC 15,520 0,000
SC-A 0,187 0,905
SC-B 0,375 0,771
TENURE N Mean Deviation Std.
IQ 1-3 36 1,6389 1,01848
4-8 15 1,3000 1,20712
9-14 37 ,5676 ,65788
URL: http://dx.doi.org/10.14738/abr.66.4411. 294
Total 97 1,0722 1,01548
TENURE N Mean Deviation Std.
AC 1-3 36 1,8389 ,87742
4-8 15 2,3867 ,50408
9-14 37 2,6270 ,73054
15+ 9 3,5778 ,45216
Total 97 2,3856 ,89594
TAMHANE T2
Mean
Difference
(I-J) Std. Error Sig.
TENURE
AC 1-3 4-8 -,54778* ,19577 ,045
9-14 -,78814* ,18923 ,001
15+ -1,73889* ,21000 ,000
4-8 1-3 ,54778* ,19577 ,045
9-14 -,24036 ,17710 ,702
15+ -1,19111* ,19914 ,000
9-14 1-3 ,78814* ,18923 ,001
4-8 ,24036 ,17710 ,702
15+ -,95075* ,19272 ,001
15+ 1-3 1,73889* ,21000 ,000
4-8 1,19111* ,19914 ,000
9-14 ,95075* ,19272 ,001
TAMHANE T2
Mean
Difference
(I-J) Error Std. Sig.
TENURE
IQ 1-3 4-8 ,33889 ,35490 ,924
9-14 1,07132* ,20127 ,000
15+ 1,13889* ,23789 ,000
4-8 1-3 -,33889 ,35490 ,924
9-14 ,73243 ,32991 ,217
15+ ,80000 ,35344 ,191
9-14 1-3 -1,07132* ,20127 ,000
4-8 -,73243 ,32991 ,217
15+ ,06757 ,19868 1,000
15+ 1-3 -1,13889* ,23789 ,000
4-8 -,80000 ,35344 ,191
ANOVAs tests for job position levels
The results of the tests are presented in Table 5.5.2.4. Levene’s test of the homogeneity of variances show that the p values of intention to quit and individual values are greater than 0.05 which means that we can continue with the anova tests for these factors. Levene’s p value for affective commitment is smaller than 0.05. Therefore for affective commitment we look at the Welch and Brown-Forsythe tests.
We run the anova test for the variable job position in the company to find out if there are any differences between the job position levels when measured against intention to quit and individual values SC-A and SC-B.
The anova test did not proved significant for individual values SC-A and SC-B with p values 0.856 and 0.936, consecutively. This means that there are no significant differences in job position levels when measured against individual values.
For intention to quit anova results show that p value is equal to 0.015 which is less than 0.05. This means that there are significant differences of job position levels when measured against intention to quit.
Similarly for affective commitment, Welch and Brown-Forsythe tests show there are significant differences of job position levels when measured against affective commitment. To determine job position levels that show significant differences when measured against affective commitment and intention to quit we look at the TAMHANE T2 results.
TAMHANE T2 results show that for intention to quit there are significant differences between the employees and mid-management levels. Employees have a greater mean value for intention to quit (1.2647) than the mean value of mid-management level (0.6087).
For affective commitment, TAMHANE T2 results show there are significant differences among all the job position levels. The mean value of top management level is found to be 3.8333 which is significantly higher than the mean value of mid-management (2.7043) and the mean value of employees (2.1500). The mean value of the mid- management level is also significantly greater than employees’ mean value for affective commitment.
Table 5.5.2.4 Anova Tests for Position
POSITION IN COMPANY
Test of Homogeneity Test of Equality of
of Variances Means (p values)
Statistic Levene Brown-
Factors Statistic p Welch Forsythe
IQ 0,108 0,898 0,042 0,017
AC 5,503 0,005 0,000 0,000
SC-A 2,194 0,117 0,835 0,842
SC-B 2,100 0,128 0,953 0,938
POSITION IN COMPANY
Anova F p
IQ 4,385 0,015
AC 15,046 0,000
SC-A 0,156 0,856
URL: http://dx.doi.org/10.14738/abr.66.4411. 296
POSITION N Mean
Std. Deviation
IQ Top
Management 6 ,6667 ,8165
Mid
Management 23 ,6087 1,0762
Employee 68 1,2647 ,9599
Total 97 1,0722 1,0155
POSITION N Mean
Std. Deviation
AC Top
Management 6 3,8333 ,2338
Mid
Management 23 2,7043 ,5183
Employee 68 2,1500 ,8826
Total 97 2,3856 ,8959
TAMHANE T2
Mean
Difference
(I-J) Std. Error Sig.
POSITION
IQ Top
Management Mid Management ,05797 ,40183 ,9986
Employee -,59804 ,35307 ,3617
Mid
Management
Top
Management
-,05797 ,40183 ,9986
Employee -,65601* ,25279 ,0408
Employee Top
Management ,59804 ,35307 ,3617
Mid
Management
,65601* ,25279 ,0408
TAMHANE
T2
Mean
Difference
(I-J) Std. Error Sig.
POSITION
AC Top
Management Mid
Management
1,12899* ,14419 ,0000
Employee 1,68333* ,14341 ,0000
Mid
Management Top
Management
-1,12899* ,14419 ,0000
Employee ,55435* ,15210 ,0016
Employee Top
Management
-1,68333* ,14341 ,0000
Mid
Management
CONCLUSION AND DIRECTIONS FOR FURTHER RESEARCH Important Findings Of The Study
This research attempted to explain if there are any significant relationships between individual values, affective commitment and intention to quit. For this purpose the sample of 97 respondents (from a total of 113 people) working in a software company in Istanbul is used.
Within the scope of this study three constructs are used, namely; the Schwartz individual values, affective commitment within the framework of organizational commitment, and intention to quit. To that extend a model is constructed so that individual values as defined by Schwartz are the antecedent on the affective commitment and intention to quit separately, while at the same time affective commitment is the antecedent influencing intention to quit.
Regression analyses are performed to determine the extent to which and significance of directional effects of Schwartz’s individual values on intention to quit, and on affective commitment. Results of the regression analyses showed no such significant effects of individual values on either intention to quit or affective commitment. As for the effects of individual values on affective commitment, regression results again found no such significant effects. Respondents in our sample did not form their understanding of affective commitment within the organization on the basis of Schwartz’s individual values.
On the other hand, to determine the effects of affective commitment on intention to quit the regression results proved significant. The regression results showed in conformity with the model expectations that there is an inverse relationship between affective commitment and intention to quit. It is found that respondents with higher affective commitment tend to have a lower intention to quit, and vice versa.
On the findings of this study, we can conclude that respondents working in this specific software company under question, as to whether or not to staying the company formed their decisions not on the basis of Schwartz’s individual values but on the basis of their affective commitment in the organization.
To determine the effects of subgroup differences of demographic variables on each main construct in this study, t and one-way anova tests are done. The demographic variables used in this study are; gender, marital status, education, age, position in the company and tenure (work experience). T tests are done for gender and marital status levels, and one- way anova tests are done for the other demographic variables.
The t test results showed that there are no significant differences either between the female and male respondents or between the single and married respondents for the constructs individual values and affective commitment.
T test for the intention to quit results, however, showed significant differences both for female and male respondents and for single and married respondents. The results showed that females have a higher tendency to quit than males, and single respondents have a higher tendency to quit than married respondents.
URL: http://dx.doi.org/10.14738/abr.66.4411. 298
For affective commitment, one-way anova results did not prove significant against education levels. Against age level, anova result proved significant. Respondents with age levels between20-29 showed significantly lower affective commitment mean values than all the other age level. Among the other age levels results did not show significant differences. Differences on the basis of tenure levels when measured against affective commitment also proved significant. Tenure levels with 1-3 years in the company showed significantly lower mean values than all the others. Among the 4-8 and 5-14 tenure levels results showed no significant differences. 15+ tenure level mean values proved greater than the mean values of all the other tenure levels. This means that respondents with lower tenure level show a lower affective commitment and those with 15+ tenure levels show the greatest affective commitment. Differences on the basis of job position in the company differences proved significant. The results showed that top- managers’ mean value of affective commitment are higher than mid-managers and employees, and mid-mid-managers’ mean value are higher than the mean value of employees’.
One-way anova tests of subgroup demographic levels against intention to quit showed similar result as that of affective commitment. Education levels did not prove significant for intention to quit. Age levels did prove significant. The results showed that the mean value intention to quit of respondents with 20-29 age level is significantly greater than the mean value of all the other age levels. Among the age levels other than 20-29 the results did not prove significant. Against the tenure levels, results proved significant. The mean value of intention to quit for respondents with tenure level of 1-3 years proved to be significantly greater than all the other tenure levels. Among the other tenure levels results did not prove significant. Against the job position in the company results proved significant. Results showed that mean value of intention to quit of the employees is significantly greater than the mean value of mid-managers. The results did not prove significant among mid and top-mid-managers.
Limitations Of The Study
The study has certain limitations first of all as far as the sample size of 97 is considered and also covering only one company. This type of limitation may not have done justice to properly analyze the effects of Schwartz’s individual values on intention to quit and affective commitment.
Small sample sizes pose limitations for more meaningful demographic difference tests when sufficient proportionality is not attained.
Suggestions For Future Research
Schwartz value system is a well tested system on a wider and broader scale suitable across cultural differences. A better way would be to study the effects of Schwartz value system with larger sample sizes but more importantly incorporating into the sample more companies of sufficiently heterogeneous nature to take into account country wide differences among people and organizations. Small companies like the one used in this study are compact and fairly homogenous which pose limitations for proper way to analyze the effects of Schwartz’s value system.
References
Adkins, Ravlin & Melino, 1996; Cable&Edwards, 2004, The Influence of Learning Orientation and Innovativeness on Firm’s Performance: Moderating Effect of Network Relationship