METHODOLOGY
Measuring DNA content in live cells
by fluorescence microscopy
Cecil J. Gomes
1,5, Michael W. Harman
6,7, Sara M. Centuori
1, Charles W. Wolgemuth
3,4and Jesse D. Martinez
1,2*Abstract
Background: Live-cell fluorescence microscopy (LCFM) is a powerful tool used to investigate cellular dynamics in real time. However, the capacity to simultaneously measure DNA content in cells being tracked over time remains challenged by dye-associated toxicities. The ability to measure DNA content in single cells by means of LCFM would allow cellular stage and ploidy to be coupled with a variety of imaging directed analyses. Here we describe a widely applicable nontoxic approach for measuring DNA content in live cells by fluorescence microscopy. This method relies on introducing a live-cell membrane-permeant DNA fluorophore, such as Hoechst 33342, into the culture medium of cells at the end of any live-cell imaging experiment and measuring each cell’s integrated nuclear fluorescence to quantify DNA content. Importantly, our method overcomes the toxicity and induction of DNA damage typically caused by live-cell dyes through strategic timing of adding the dye to the cultures; allowing unperturbed cells to be imaged for any interval of time before quantifying their DNA content. We assess the performance of our method empirically and discuss adaptations that can be implemented using this technique.
Results: Presented in conjunction with cells expressing a histone 2B-GFP fusion protein (H2B-GFP), we demonstrated how this method enabled chromosomal segregation errors to be tracked in cells as they progressed through cellular division that were later identified as either diploid or polyploid. We also describe and provide an automated Matlab-derived algorithm that measures the integrated nuclear fluorescence in each cell and subsequently plots these meas-urements into a cell cycle histogram for each frame imaged. The algorithm’s accurate assessment of DNA content was validated by parallel flow cytometric studies.
Conclusions: This method allows the examination of single-cell dynamics to be correlated with cellular stage and ploidy in a high-throughput fashion. The approach is suitable for any standard epifluorescence microscope equipped with a stable illumination source and either a stage-top incubator or an enclosed live-cell incubation chamber. Col-lectively, we anticipate that this method will allow high-resolution microscopic analysis of cellular processes involving cell cycle progression, such as checkpoint activation, DNA replication, and cellular division.
Keywords: Live-cell microscopy, Hoechst 33342, Imaging, DNA content
© The Author(s) 2018. This article is distributed under the terms of the Creative Commons Attribution 4.0 International License (http://creat iveco mmons .org/licen ses/by/4.0/), which permits unrestricted use, distribution, and reproduction in any medium, provided you give appropriate credit to the original author(s) and the source, provide a link to the Creative Commons license, and indicate if changes were made. The Creative Commons Public Domain Dedication waiver (http://creat iveco mmons .org/ publi cdoma in/zero/1.0/) applies to the data made available in this article, unless otherwise stated.
Background
In biological sciences, the most universally measured genomic constituent is DNA content. Its quantifica-tion serves to assess several cellular parameters includ-ing DNA ploidy and a cell’s temporal location within the cell cycle [1]. DNA content is accurately assessed on a single cell basis by measuring the integrated nuclear
fluorescence of a fluorophore that binds to DNA stoi-chiometrically. Traditionally, reporting DNA content has been accomplished with a high degree of accuracy in large cell populations using flow cytometry, a tech-nique that allows the proportion of cells in each phase of the cell cycle to be calculated in a high-throughput fashion. However, the measurement of DNA content by flow cytometry provides little resolution to the biology of individual cells. To overcome this limitation, approaches incorporating laser scanning cytometry and fluorescence microscopy have been successful in quantifying DNA content in single cells [2, 3], providing the capacity to
Open Access
*Correspondence: [email protected]
1 University of Arizona Cancer Center, University of Arizona, 1515 N.
Campbell Ave, Tucson, AZ 85724, USA
combine this information with additional cellular param-eters that can be elucidated by imaging.
Many of the fluorophores that bind to DNA stoichio-metrically are incompatible with live cells; the difficulty lies in granting the DNA fluorophore—often not mem-brane-permeant as with DAPI, PI, and 7-AAD—access to the DNA [4, 5]. Therefore, traditional methods for examining DNA content by microscopy have relied on cellular fixation, which is incompatible with tracking cells over time. To overcome the limitations brought upon by cellular fixation, membrane-permeant DNA fluoro-phores were designed to stain DNA stoichiometrically in live-cells (supravital staining), enabling both the quanti-fication of DNA content and the ability to track the move-ment of chromosomes over time. However, it quickly became evident that exposure to membrane-permeant DNA fluorophores, such as Hoechst 33342 and DRAQ5, induce distinct DNA damage responses in cells, includ-ing activation of ATM, Chk2 and p53 [6]. Furthermore, repeated exposure to UV light is particularly damaging to cells as it causes photolysis of DNA [7]. Consequentially, the cytotoxicity and phototoxicity associated with the use of supravital dyes often result in cell cycle arrest and apoptosis [8, 9]. Therefore, these dyes have limited use in long-term LCFM applications and should be employed sensibly in acute studies examining cell cycle progression or apoptosis as their cytotoxic effects cannot be ignored. These limitations have made quantifying DNA content in LCFM applications challenging, yet this capacity would allow for cell cycle staging and DNA content to be cou-pled with any variety of cellular dynamics obtained by LCFM.
Here we attempt to bridge that void and present a widely applicable nontoxic procedure for measuring DNA content in live-cells at the end of a LCFM experi-ment, allowing individual cells to be imaged for any inter-val of time followed by the quantitation of their DNA contents. This capacity allows for high-resolution micro-scopic analysis of cellular processes involving cell cycle progression. This approach is compatible with LCFM applications because it avoids the toxicity typically asso-ciated with long-term exposure to live-cell DNA dyes. Furthermore, a variety of live-cell DNA fluorophores can be utilized; here we present this procedure using Hoe-chst 33342, a live-cell DNA dye that binds to AT-rich sequences in the minor groove of double-stranded DNA, allowing for a stoichiometric relationship between the amount of DNA present and Hoechst fluorescence [10].
We also demonstrate how this method, when used in combination with a histone 2B-GFP fusion protein, can be employed to monitor chromosomal dynamics in cells of varying ploidies (2n, 4n, 8n); an approach we recently used to examine the length of mitosis and the frequency
of mitotic errors in polyploid cells induced by the over-expression of YWHAG [11]. To that end, cells with poly-ploid DNA content have recently been demonstrated to facilitate rapid adaptation in human tumors through sig-nificantly elevated rates of genomic aberrations, ranging from single nucleotide changes to whole chromosome gains and losses [12]. These aberrations, collectively termed genetic instability, are characteristic to human cancers [13] and is the primary source for genetic vari-ability that selects for populations with increased malig-nancy and resistance to therapy [14]. These observations have fueled the notion that polyploid cells exist as unsta-ble intermediates en route to aneuploidy [15–17]. In addition to allowing for the characterization of cellular stage by LCFM, the procedure presented here enables the enumeration of chromosomal segregation errors in dip-loid and polypdip-loid cell populations in high-resolution.
Methods
Cell culture and transfections
The model systems for the cell culture are NCI-H322 (ATCC, Manassas, VA) human bronchioalveolar carci-noma cells, which were maintained in Dulbecco’s modi-fied Eagle’s medium (Corning Cellgrow, Manassas, VA, USA) supplemented with 10% fetal bovine serum (Peak Serum, Fort Collins, CO), 100 U penicillin and 100 mg streptomycin (ThermoFisher, Waltham, MA, USA) and maintained at 37 °C in a humidified atmosphere of 5% CO2. Cells were transfected using Lipofectamine LTX
with the addition of the manufacture’s PLUS reagent (Invitrogen, Carlsbad, CA, USA). Cells transfected with pBOS-H2B-GFP were selected with 3 μg/mL Blastici-din S HCl (Sigma-Aldrich, St. Louis, MO, USA), FACS sorted based on positive GFP expression, and maintained in 1 μg/mL Blasticidin S HCl (ThermoFisher, Waltham, MA, USA) within the culture medium. Cells transfected with pCMV-Tag2B-14-3-3γ were maintained in 400 μg/ mL G418 (ThermoFisher, Waltham, MA, USA).
Cell cycle profiling by flow cytometric analysis
Procedural setup
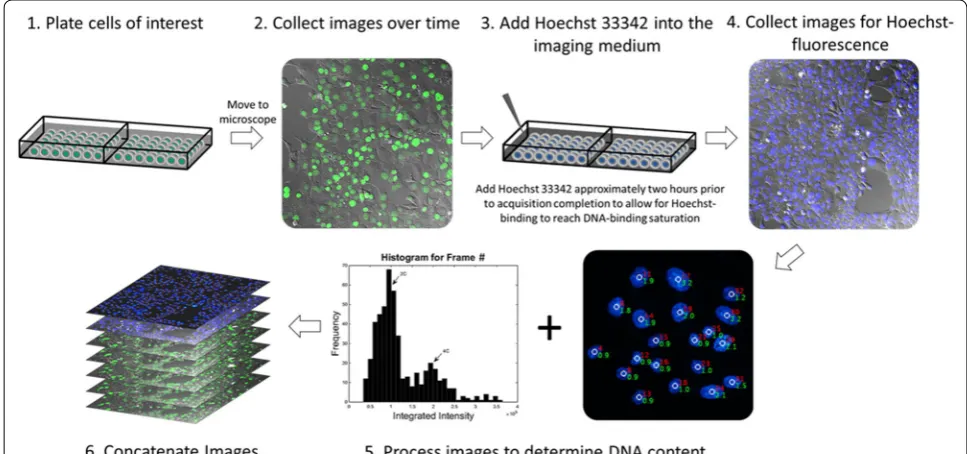
Live-cell fluorescence microscopy comes with several challenges that must be addressed before this technique can be utilized (as reviewed in [18]). A schematic of the procedure is shown in Fig. 1 and consists of six major steps. (1) Cells were plated into 2-well coverglass bottom chambered slides (Thermofisher Scientific, Waltham, MA, USA) at a concentration of 20,000 cells/well and allowed to adhere for a minimum of 24 h at 37 °C and 5% CO2. Prior to the imaging acquisition, cells were washed
with phosphate buffer saline (PBS) and the replen-ished with FluoroBrite DMEM imaging medium (Ther-moFisher) supplemented with 10% Fetal Bovine Serum (Peak Serum) and 1% Penicillin–Streptomycin (Gibco). Cell synchronization may be performed to maximize the mitotic fraction of cells for studies aimed at investigating cell division dynamics in a high-throughput fashion. The chambered slide was then transferred to a Pecon Heat-ing Insert (Carl Zeiss) attached to the microscope stage and maintained at 37 °C and 5% CO2. To ensure that
the cells remain in focus for the duration of the imag-ing acquisition, the slide must be tightly secured to the stage-top incubator. This is a critical step in guaranteeing that the slide will not move in the latter half of the experi-ment while the supravital dye is added. (2) Time-lapse images were acquired using a 20× air objective with a CMOS camera (Orca Flash V4.0, Hamamatsu Photonics,
Hamamatsu City, Japan) on a Zeiss AxioObserver.Z1 wide-field epifluorescence microscope equipped with an automated stage and focus (Carl Zeiss, Oberkochen, Germany). Differential interference contrast and fluores-cence images were collected at 3-min intervals for 18 h at several regions of interest. (3) Approximately 2 h prior to the completion of the time-lapse experiment, the imaging acquisition was paused and the lever arm of the micro-scope raised, and the lid to the Pecon heating insert care-fully removed. Hoechst 33342 (Thermo Fisher Scientific, Waltham, MA, USA) was then carefully added in a drop-wise fashion to the imaging medium without perturbing the slide position to a final concentration of 1 μg/mL. The lid to the heating insert and the lever arm were then re-positioned with similar care and image acquisition was resumed. Images were collected for an additional 2 h to allow for stoichiometric binding of Hoechst 33342. During this 2-h window, images were solely collected to ensure that single cells could be tracked throughout the duration of the time lapse experiment; these images were not assessed for cellular dynamics, as exposure to Hoe-chst 33342 has been demonstrated to cause cytotoxic effects [6, 8, 9]. (4) Upon reaching dye saturation, cells were then imaged for Hoechst 33342 fluorescence and all images collected were saved as uncompressed.avi files. This method is contingent on the precise measurement of DNA content emitted from Hoechst’s fluorescence, and
therefore it is essential that the images that are collected not be saturated. (5) The integrated nuclear fluorescence of Hoechst 33342 was then calculated for each cell within a given frame and plotted to a cell cycle histogram using a MATLAB (MathWorks, Natick, MA) algorithm that we developed. The algorithm generates an additional.avi file with the DNA contents overlaid to the original Hoe-chst 33342 images. (6) Using ImageJ (National Institutes of Health), individual.avi stacks collected from the time-lapse experiment were concatenated with their respec-tive images collected for Hoechst 33342 fluorescence and saved as contiguous.avi video files. Notably, Microscope setups furnished with an automated stage for imaging multiple fields of view, such as ours, requires that Ho342 is added to the imaging medium without moving the slide position, as even the slightest adjustment in its position can relinquish the existing focus strategy. This becomes less important when imaging a single field of view, as that location can be re-adjusted manually with ease.
Image processing
Images of Hoechst 33342 fluorescence were analyzed using the ProcessDNA algorithm constructed to meas-ure the integrated nuclear fluorescence of each cell. The algorithm computes the perimeter shape and the location of the center of mass of each nucleus from fluorescent images by combining a thresholded image and a moving least-squares algorithm, as previously described in Har-man et al. [19]. The threshold value is determined based on the sharpest gradients in the image intensity. The integrated fluorescence is then equated over the area of each nucleus, and that data is exported into a histogram distribution, with the integrated intensities reduced to a
two-digit read-out and binned accordingly based on the data distribution. This algorithm is simple in design and is constructed to rapidly assess 2D-images and allows users to determine where an individual cell resides within the cell cycle without having to use several software. Steps to use this pipeline and the code generated to run the ProcessDNA algorithm are provided (Additional files 1, 2).
Results
Hoechst 33342 binding saturation
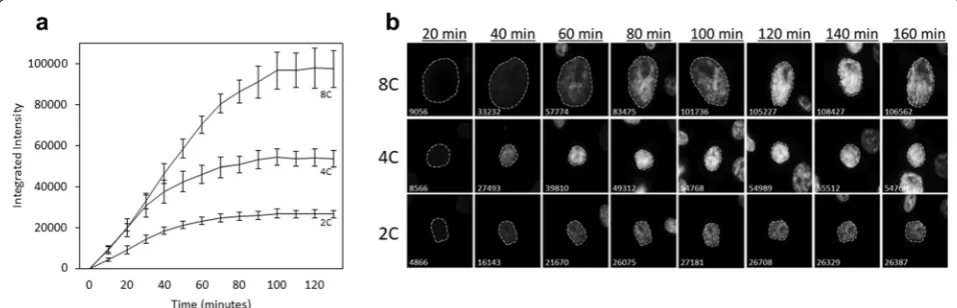
The time it takes for Hoechst-binding to reach satura-tion must be determined empirically as the rate of dye-uptake is cell-type and concentration-dependent [20, 21]. Figure 2 illustrates the temporal span for Hoechst 33342 to reach binding saturation in H322 cells harbor-ing different DNA contents at a concentration of 1 μg/ mL. Following the dye’s addition, the integrated nuclear fluorescence of Ho342 was manually tracked in 50 cells over the course of 3 h with 10-min acquisition intervals. The integrated intensities collected from cells with DNA contents ranging from 2C to 4C became stable within approximately 100 min after the dye’s addition, indicat-ing that Ho342 bindindicat-ing reached saturation (Fig. 2a). Cells with ~ 8C DNA content required an additional 20 min for the integrated intensities to stabilize. Markedly, diploid cells cycle between 2C (G1) and 4C (G2/M) DNA con-tent, while tetraploid cells cycle between 4C (G1) and 8C (G2/M), therefore, 8C cells were categorized as polyploid cells.
A closer look at the integrated intensities over time showed marginal changes in fluorescence following the dye’s saturation, with greater fluctuations occurring
in cells with inherently more DNA content (Fig. 2b). These slight fluctuations are characteristic to measur-ing Ho342-associated fluorescence in live cells, as they actively efflux Ho342 to varying degrees depending on the cell type [21]. The efflux of Ho342 in H322 cells appeared insignificant and did not require interven-tion; however, the co-incubation of Hoechst 33342 with efflux inhibitors such as Verapamil and trifluoperazine [22], or the membrane potential modifying fluoro-chrome DiOC5(3), is occasionally required to yield an accurate resolution of DNA content in cell-types with poor dye retention [22–24]. This data demonstrates that our approach is suitable for measuring DNA con-tents with a relatively good degree of accuracy, but that without efflux inhibitors, it should not be employed when attempting to measure minute numerical changes in chromosome complements in live cells.
Staging live cells
To demonstrate the high-throughput approach of this methodology, we assessed the number of cells required within a single field of view (FOV) to generate a cell cycle profile with distinct separation between cell cycle phases. We treated live cells with Ho342 until binding reached saturation and then captured profiles at den-sities of ~ 100–600 cells per FOV. Notably, similar cell counts are obtainable at lower cellular densities by imag-ing multiple fields of view and combinimag-ing that data into a single histogram. Cell cycle phases G1, S, and G2/M, were defined by applying manual gates to the cell cycle histogram. We observed distinct populations of all three phases when a minimum of 200 cells were assessed within a single field of view, but more discernable cell cycle profiles emerged as cell counts increased (Fig. 3). Next, we investigated whether cell cycle profiles collected from live cells stained with Ho342 could recapitulate
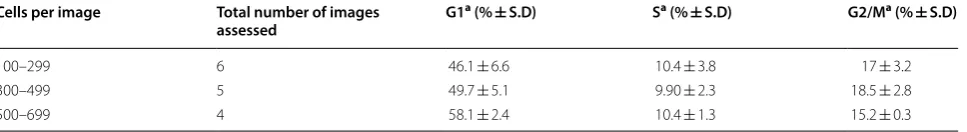
data collected from flow cytometry. Therefore, we per-formed a side-by-side experiment comparing asynchro-nous cell cycle distributions acquired in live cells by fluorescence microscopy to that of fixed cells acquired by flow cytometry. The analysis of 10,000 cells by flow cytometry yielded a distribution of 60.7% in G1, 17.0% in S, and 20.5% in G2/M (Additional file 3: Figure S1). Sev-eral fluorescent images were collected in live cells plated at different densities with a 20× 0.8-N.A. lens, and cell cycle profiles were assessed with manual gate placement (Table 1). When all three phases were examined together, images containing 500–699 cells within a field of view were most accurate at resolving cell cycle distributions similar to what was observed by flow cytometry. Notably, at all densities, the proportion of cells in each phase were lower than that acquired by flow cytometry, with notice-ably underrepresented proportions of cells in S phase. This is likely due, in part, to the conservative placement of each gate; which were positioned cautiously because of the wide-ranging profiles of G1 and G2/M generated by imaging as opposed to the narrower spread observed by flow cytometry (Additional file 3: Figure S1b). Fur-thermore, doublets were gated out of the cell cycle profile acquired by flow cytometry, whereas nuclei that are posi-tioned closely with one another that also lie within the accepted size threshold are occasionally characterized as a single nucleus with the ProcessDNA algorithm. This occurrence can be seen in cells profiled to the right of the G2/M population (Additional file 3: Figure S1b), and therefore reduce the proportion of cells that lie within the G1, S, and G2/M gates. Collectively, we conclude that our method can be used to stage individual cells in the cell cycle with a relatively good degree of accuracy when data for a minimum of 500 cells are collected.
Examining polyploid cell division
Studying the molecular mechanisms that affect cellular division is crucial to our understanding of genomic sta-bility. When this process fails to occur faithfully, daughter cells may inherit abnormal chromosome complements with structural and numerical aberrations—character-ized as aneuploidy. Because cells with abnormally ele-vated levels of DNA content have inherently increased rates of genomic instability and are widely considered
drivers of aneuploidy [15–17], we reasoned that our approach of measuring DNA content in live cells could be coupled with the constitutive expression of H2B-GFP to study mitotic aberrations in polyploid cells. Impor-tantly, the use of fluorescently labeled histones is com-patible with long-term live-cell imaging applications and has been used in several studies investigating chromo-somal segregation errors, such as lagging chromosomes, multipolar mitoses, and anaphase bridges [25–27].
To asses this, we first employed a cell line harboring diploid and polyploid populations established by overex-pression of the YWHAG oncogene [28]. We then intro-duced the constitutive expression of H2B-GFP into these cells to allow for the spatiotemporal movement of mitotic chromosomes to be visualized in high-resolution. LCFM was performed with images collected in 3-min intervals for 18 h and the DNA contents of each cell calculated at the end of the experiment as described within. Cell cycle profiles were generated and referenced to define 2C, 4C, and 8C populations. The ploidy of dividing cells, that is, the number of complete sets of chromosomes, were suc-cessfully calculated by summing together the DNA con-tents in emerged daughter cells, i.e., diploid cells tracked through mitosis were identified by the DNA contents of their daughter cells adding up to 4C, and tetraploid cells similarly identified by the summation of 8C (Addi-tional file 4: Figure S2). Notably, the precise characteriza-tion of cellular ploidy in mitotic cells was contingent on measuring DNA content in the daughter cells while they remained in growth phase I of the cell cycle. Concatena-tion of all images collected resulted in a time-lapse video that allowed for cellular ploidy and mitotic progression to be assessed contiguously (Additional file 5: Video S1).
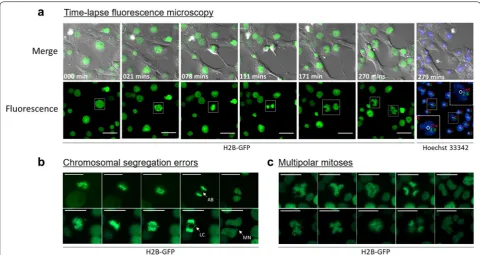
Figure 4 illustrates several mitotic defects that can be examined using this system, such as asymmetrical separa-tion of DNA (Fig. 4a), fragmented nuclear morphologies (Fig. 4a), anaphase bridges (Fig. 4b, top panel), lagging chromosomes with subsequent micronuclei formation (Fig. 4b, bottom panel) and multipolar mitoses (Fig. 4c). Collectively, the expression of H2B-GFP combined with the quantification of DNA content—as outlined in this protocol—enables DNA ploidy to be correlated with several cellular parameters, and was recently employed to examine the length of mitosis and to enumerate the
Table 1 Cell cycle distributions from images with varying densities of cells
a Percentage of cells in each stage of the cell cycle ± standard deviation (S.D)
Cells per image Total number of images
assessed G1
a (% ± S.D) Sa (% ± S.D) G2/Ma (% ± S.D)
frequency of mitotic errors in polyploid cells induced by overexpression of YWHAG [11].
Discussion
We have established a universal approach for measur-ing DNA content in live cells that is compatible with long-term LCFM. By introducing Ho342 into the cul-ture medium of H322 cells and allowing it to bind stoi-chiometrically, we were able to measure DNA content in individual cells and thus determine each cell’s stage within the cell cycle. The quantification of DNA content in individual cells was streamlined using the ProcessDNA algorithm, a Matlab-derived script that recognizes indi-vidual cells and measures the integrated nuclear fluores-cence intensity of Ho342. This combined with time-lapse images collected for H2B-GFP allowed us to track indi-vidual cells and their DNA contents back through time, providing a history of the cell’s progression through the cell cycle. Importantly, our procedure avoids cell cycle perturbations and DNA damage caused by live cell dyes, such as Ho342, by limiting cellular exposure to a short period of time at the end of the experiment. Hence, we were able to observe chromosome dynamics associated with the cell cycle, unperturbed by Ho342 staining. Using
this approach, we linked DNA content and cell cycle staging to individual cells tracked in a time-lapse fashion.
We were able to generate cell cycle distribution pro-files with distinct populations of stages G1, S, and G2/M using image processing. We found that optimal resolu-tion appeared when at least 500 cells were assessed for cell cycle distributions (Fig. 3). This number of cells was easily obtained by imaging a single FOV using a 20× 0.8-N.A. objective lens. Our method and the Process-DNA algorithm are also compatible with the use of a 10× objective if cells are to be imaged at a lower cellular con-fluence. For studies seeking to acquire cell cycle profiles with counts similar to what is achieved by flow cytom-etry, the DNA contents from multiple fields of view can be compiled and DNA histograms can then be generated from this data with spreadsheet software such as Excel or statistical software R [29].
a sufficient number of cells within a single field of view, but not too dense such that cells are growing atop one another. To mitigate this phenomenon, the chambered slides used for imaging can be pre-coated with Poly-l Lysine or fibronectin, which can encourage cell adhesion to the underlying surface [30]. Nevertheless, nuclei detec-tion and nuclear fluorescence measurements can also be performed using CellProfiler [31], an open-source image analysis pipeline that is suitable for detecting individual nuclei within cell clusters. Although timely, the assess-ment of DNA content can also be performed manually by integrating the nuclear fluorescence using software such as ImageJ. Alternatively, images can be collected at sev-eral z-planes (stacks) to account for the variability of cells in different z-positions. The stack of images can then be averaged for all z-positions and the integrated intensity of Ho342 can be calculated [29].
It was evident that cell cycle profiles generated by imag-ing, although similar, did not precisely mirror profiles generated by flow cytometry. Studies requiring precise cell cycle staging using this method should consider the use of efflux inhibitors alongside the addition of Ho342 into the imaging medium to preserve dye retention. This will reduce the lower-bound spread of G1 and G2/M pop-ulations, ultimately making all three phases more distinct. Our method alone appears sufficient for staging live cells within the cell cycle but is limited temporally to the end of the time-lapse experiment. To resolve cell cycle stages throughout the duration of the time-lapse experiment, the additional use of live cell cycle reporters can be utilized. The expression of fluorescently labeled proliferating cell nuclear antigen (PCNA) can be incorporated into the sys-tem to further clarify cells that are in S phase from those in G1 and G2/M [32]. Alternatively, the fluorescence ubiq-uitination cell cycle indicator (FUCCI) system can be used to identify cells in G1 from those in S/G2/M phases [33]. The integration of these cell cycle reporters may increase the accuracy of staging live cells, but do not provide reso-lution of all three phases and also requires the use of addi-tional spectral imaging channels, reducing the capacity for visualizing of cellular features by fluorescence imaging and consequently should be employed pragmatically.
Our method of measuring DNA content at the end of a time-lapse experiment was recently performed to study polyploid cells as they progressed through cell division [11]. We reasoned that polyploid cells could be identified using our method, as DNA content and DNA ploidy are interdependent. Cells undergoing mitosis were visual-ized by differential interference microscopy. Thus, cells that emerged from mitosis were accurately staged in G1 of the cell cycle and the amount of DNA content directly related to their ploidy. With the concomitant expression of H2B-GFP, mitotic dynamics were assessed in cells that
were retrospectively identified as diploid or polyploid. Our method is, therefore, an attractive new technique for exploring unresolved cell division and proliferation dynamics of polyploid cells.
Conclusions
We have developed a LCFM technique that allows track-ing of strack-ingle cells through an unperturbed cell cycle for an extended period and the subsequent quantification of their DNA content by automated image analysis. We outline a protocol for a standard wide-field fluorescence microscope (e.g., AxioObserver.Z1, Carl Zeiss) equipped with a UV light source for the excitation of the DNA dye and a low-cost lab-standard 20× 0.8-NA air objective lens. This configuration allows the quantification of Hoe-chst-stained cells and the derivation of cell cycle profiles without the need for 3D image acquisition. This method is wide-ranging, as the use of alternative epifluorescence or confocal microscopes will allow similar results to be achieved. Furthermore, this approach is compatible with the use of any stiociometric live-cell DNA dye, permit-ting the occupancy of alternative fluorescent channels. Collectively, we anticipate that this method will allow high-resolution microscopic analysis of cellular processes involving cell cycle progression, such as checkpoint acti-vation, DNA replication, and cellular division.
Additional files
Additional file 1. Using the ProcessDNA algorithm for measuring DNA content.
Additional file 2. ProcessDNA MATLAB file.
Additional file 3: Figure S1. Side-by-side comparison of cell cycle profiles derived from flow cytometry and by live-cell fluorescence microscopy. Flow cytometry and fluorescence image analysis data was obtained from asynchronous cells that were plated in either 6-well culture dishes or 2-well chambered slides, respectively. a) The cell cycle profile displayed was generated from cells that were fixed and treated with propidium iodide and ribonuclease A. 10,000 events were collected with doublets gated out of the analysis by SCC and PI-A. Manual gates were placed to determine the percentage of cells within the different cell cycle phases shown. b) Displayed is a cell cycle profile generated from live-cell fluorescence microscopy of Hoechst 33342 stained cells (n = ~ 600 cells). The corresponding image is presented in the top-right corner to illustrate the plating density required for 600 cells per field of view.
Additional file 4: Figure S2. Calculating cellular ploidy in live cells using Hoechst 33342. A diagrammatical representation of H2B-GFP labeled cells progressing through mitosis (grey arrows) is shown. DNA ploidy can be calculated for each mitotic cell by summing the nuclear fluorescence of Hoechst 33342 in the nascent daughter cells. A diploid and tetraploid example is illustrated.
Authors’ contributions
CJG conceptualized the methodology presented here and wrote the bulk of the manuscript. MWH worked with CJG to optimize live-cell culture condi-tions and aided CJG in performing time-lapse microscopy experiments. CWW developed the algorithm to quantitate DNA content in live cells and provided laboratory space to conduct all live-cell experiments. SMC provided project guidance, data interpretation, and editing of this manuscript. JDM provided assistance in data interpretation and project direction. He and CWW also significantly contributed to the production of this manuscript. All authors read and approved the final manuscript.
Author details
1 University of Arizona Cancer Center, University of Arizona, 1515 N. Campbell
Ave, Tucson, AZ 85724, USA. 2 Department of Cell & Molecular Medicine,
Uni-versity of Arizona, Tucson, AZ 85724, USA. 3 Department of Physics, University
of Arizona, Tucson, AZ 85724, USA. 4 Department of Molecular & Cellular
Biology, University of Arizona, Tucson, AZ 85724, USA. 5 Cancer Biology
Gradu-ate Interdisciplinary Program, University of Arizona, Tucson, AZ 85724, USA.
6 Rhode Island Hospital, Providence, RI 02903, USA. 7 Department of
Engineer-ing, Brown University, Providence, RI 02912, USA.
Acknowledgements
The University of Arizona Cancer Center flow cytometry core for their assistance in data collection. We would also like to thank Mr. Alex Hambly for his expertise and assistance in optimizing the microscope setup used in this study.
Competing interests
The authors declare that they have no competing interests.
Availability of data and materials
Data sharing is not applicable to this article as no datasets were generated or analyzed during the current study. The code generated to run the ProcessDNA algorithm is provided.
Consent for publication Not applicable.
Ethics approval and consent to participate Not applicable.
Funding
Research in this manuscript was supported by an NCI grant to JDM (CA107510); CG was supported by T32 CA09213; SC was supported by 3T32CA009213-37S1; CWW was supported by U54CA210173. Research in this manuscript was also directly supported by the flow cytometry shared service at the University of Arizona Cancer Center, which is funded by the National Cancer Institute Award P30CA023074.
Publisher’s Note
Springer Nature remains neutral with regard to jurisdictional claims in pub-lished maps and institutional affiliations.
Received: 17 March 2018 Accepted: 27 August 2018
References
1. Darzynkiewicz Z. Critical aspects in analysis of cellular DNA content. Curr Protoc Cytom. 2010. https ://doi.org/10.1002/04711 42956 .cy070 2s52. 2. Darzynkiewicz Z, Halicka HD, Zhao H. Analysis of cellular DNA content by
flow and laser scanning cytometry. New York: Springer; 2010. p. 137–47. https ://doi.org/10.1007/978-1-4419-6199-0_9.
3. Martin-Reay DG, Kamentsky LA, Weinberg DS, Hollister KA, Cibas ES. Evaluation of a new slide-based laser scanning cytometer for DNA analy-sis of tumors. Comparison with flow cytometry and image analyanaly-sis. Am J Clin Pathol. 1994;102:432–8.
4. Martin RM, Leonhardt H, Cardoso MC. DNA labeling in living cells. Cytom Part A. 2005;67A:45–52. https ://doi.org/10.1002/cyto.a.20172 .
5. Schmid I, Ferbas J, Uittenbogaart CH, Giorgi JV. Flow cytometric analysis of live cell proliferation and phenotype in populations with low viability. Cytometry. 1999;35:64–74. http://www.ncbi.nlm.nih.gov/pubme d/10554 182.
6. Zhao H, Traganos F, Dobrucki J, Wlodkowic D, Darzynkiewicz Z. Induction of DNA damage response by the supravital probes of nucleic acids. Cytom Part A. 2009;75A:510–9. https ://doi.org/10.1002/cyto.a.20727 . 7. Huang X, King MA, Halicka HD, Traganos F, Okafuji M, Darzynkiewicz Z. Histone H2AX phosphorylation induced by selective photolysis of BrdU-labeled DNA with UV light: relation to cell cycle phase. Cytometry. 2004;62A:1–7. https ://doi.org/10.1002/cyto.a.20086 .
8. Zheng J, Qi S, Zhu H, Xiao X. Toxicity of Hoechst 33342: implication in side population analysis. Cell Mol Biol (Noisy-le-grand). 2016;62:27–30. http:// www.ncbi.nlm.nih.gov/pubme d/27453 268.
9. Durand RE, Olive PL. Cytotoxicity, mutagenicity and DNA damage by Hoechst 33342. J Histochem Cytochem. 1982;30:111–6. https ://doi. org/10.1177/30.2.70618 16.
10. Taylor IW, Milthorpe BK. An evaluation of DNA fluorochromes, stain-ing techniques, and analysis for flow cytometry. I. Unperturbed cell populations. J Histochem Cytochem. 1980;28:1224–32. https ://doi. org/10.1177/28.11.61593 92.
11. Gomes CJ, Centuori SM, Harman MW, Putnam CW, Wolgemuth CW, Martinez JD. The induction of endoreduplication and polyploidy by elevated expression of 14–3-3γ. Genes Cancer. 2017;8:771–83. https ://doi. org/10.18632 /genes andca ncer.161.
12. Lengauer C, Kinzler KW, Vogelstein B. Genetic instabilities in human cancers. Nature. 1998;396:643–9. https ://doi.org/10.1038/25292 . 13. Hanahan D, Weinberg RA. Hallmarks of cancer: the next generation. Cell.
2011;144:646–74. https ://doi.org/10.1016/j.cell.2011.02.013. 14. Potapova T, Gorbsky GJ. The consequences of chromosome
segrega-tion errors in mitosis and meiosis. Biology (Basel). 2017. https ://doi. org/10.3390/biolo gy601 0012.
15. Storchova Z, Pellman D. From polyploidy to aneuploidy, genome instability and cancer. Nat Rev Mol Cell Biol. 2004;5:45–54. https ://doi. org/10.1038/nrm12 76.
16. Coward J, Harding A. Size does matter: why polyploid tumor cells are critical drug targets in the war on cancer. Front Oncol. 2014;4:123. https :// doi.org/10.3389/fonc.2014.00123 .
17. Ganem NJ, Storchova Z, Pellman D. Tetraploidy, aneuploidy and cancer. Curr Opin Genet Dev. 2007;17:157–62. https ://doi.org/10.1016/j. gde.2007.02.011.
18. Ettinger A, Wittmann T. Fluorescence live cell imaging. Methods Cell Biol. 2014;123:77–94. https ://doi.org/10.1016/B978-0-12-42013 8-5.00005 -7. 19. Harman MW, Dunham-Ems SM, Caimano MJ, Belperron AA, Bockenstedt
LK, Fu HC, et al. The heterogeneous motility of the Lyme disease spiro-chete in gelatin mimics dissemination through tissue. Proc Natl Acad Sci USA. 2012;109:3059–64. https ://doi.org/10.1073/pnas.11143 62109 . 20. Durand RE. Use of Hoechst 33342 for cell selection from
multi-cell systems. J Histochem Cytochem. 1982;30:117–22. https ://doi. org/10.1177/30.2.61745 59.
21. Scharenberg CW, Harkey MA, Torok-Storb B. The ABCG2 transporter is an efficient Hoechst 33342 efflux pump and is preferentially expressed by immature human hematopoietic progenitors. Blood. 2002. https ://doi. org/10.1182/blood .v99.2.507.
22. Krishan A. Effect of drug efflux blockers on vital staining of cellular DNA with Hoechst 33342. Cytometry. 1987;8:642–5. https ://doi.org/10.1002/ cyto.99008 0618.
23. Hofland MH, Stevenson AP, Wilder ME, Tobey RA. Chapter 9 supravital cell staining with Hoechst 33342 and DiOC5(3). Methods Cell Biol. 1990;33:89–95. https ://doi.org/10.1016/s0091 -679x(08)60514 -2. 24. Crissman HA, Hofland MH, Stevenson AP, Wilder ME, Tobey RA. Use of
DiO-C5-3 to improve Hoechst 33342 uptake, resolution of DNA content, and survival of CHO cells. Exp Cell Res. 1988;174:388–96. https ://doi. org/10.1016/0014-4827(88)90309 -6.
25. Tanudji M, Shoemaker J, L’Italien L, Russell L, Chin G, Schebye XM. Gene silencing of CENP-E by small interfering RNA in HeLa cells leads to missegregation of chromosomes after a mitotic delay. Mol Biol Cell. 2004;15:3771–81. https ://doi.org/10.1091/mbc.E03-07-0482. 26. Jiang E. Differences in the origins of kinetochore-positive and
•fast, convenient online submission •
thorough peer review by experienced researchers in your field • rapid publication on acceptance
• support for research data, including large and complex data types •
gold Open Access which fosters wider collaboration and increased citations maximum visibility for your research: over 100M website views per year •
At BMC, research is always in progress.
Learn more biomedcentral.com/submissions
Ready to submit your research? Choose BMC and benefit from:
Mol Mech Mutagen. 2016;787:7–14. https ://doi.org/10.1016/J.MRFMM M.2016.02.007.
27. Kanda T, Sullivan KF, Wahl GM. Histone–GFP fusion protein enables sensi-tive analysis of chromosome dynamics in living mammalian cells. Curr Biol. 1998;8:377–85. https ://doi.org/10.1016/S0960 -9822(98)70156 -3. 28. Qi W, Liu X, Chen W, Li Q, Martinez JD. Overexpression of 14-3-3gamma
causes polyploidization in H322 lung cancer cells. Mol Carcinog. 2007;46:847–56. https ://doi.org/10.1002/mc.20314 .
29. Roukos V, Pegoraro G, Voss TC, Misteli T. Cell cycle staging of individual cells by fluorescence microscopy. Nat Protoc. 2015;10:334–48. https ://doi. org/10.1038/nprot .2015.016.
30. Asthana A, White CM, Douglass M, Kisaalita WS. Evaluation of cellular adhesion and organization in different microporous polymeric scaffolds. Biotechnol Prog. 2018. https ://doi.org/10.1002/btpr.2627.
31. Carpenter AE, Jones TR, Lamprecht MR, Clarke C, Kang I, Friman O, Guertin DA, Chang J, Lindquist RA, Moffat J, Golland P, Sabatini DM. Cell Profiler: image analysis software for identifying and quantifying cell phenotypes. Genome Biol. 2006;7:R100. https ://doi.org/10.1186/gb-2006-7-10-r100. 32. Zerjatke T, Gak IA, Kirova D, Fuhrmann M, Daniel K, Gonciarz M, Müller
D, Glauche I, Mansfeld J. Quantitative cell cycle analysis based on an endogenous all-in-one reporter for cell tracking and classification. Cell Rep. 2017;19:1953–66. https ://doi.org/10.1016/j.celre p.2017.05.022. 33. Sakaue-Sawano A, Kurokawa H, Morimura T, Hanyu A, Hama H, Osawa H,