© Author(s) 2011. CC Attribution 3.0 License.
System Sciences
An approximate method of short-term tsunami forecast and the
hindcasting of some recent events
Yu. P. Korolev
Institute of Marine Geology and Geophysics, Far East Branch, Russian Academy of Sciences, 1b Nauki Str., Yuzhno-Sakhalinsk, 693022, Russia
Received: 3 October 2010 – Revised: 5 October 2011 – Accepted: 6 October 2011 – Published: 28 November 2011
Abstract. The paper presents a method for a short-term tsunami forecast based on sea level data from remote sites. This method is based on Green’s function for the wave equa-tion possessing the fundamental property of symmetry. This property is well known in acoustics and seismology as the reciprocity principle. Some applications of this principle on tsunami research are considered in the current study. Simple relationships and estimated transfer functions enabled us to simulate tsunami waveforms for any selected oceanic point based only on the source location and sea level data from a re-mote reference site. The important advantage of this method is that it is irrespective of the actual source mechanism (seis-mic, submarine landslide or other phenomena). The method was successfully applied to hindcast several recent tsunamis observed in the Northwest Pacific. The locations of the earth-quake epicenters and the tsunami records from one of the NOAA DART sites were used as inputs for the modelling, while tsunami observations at other DART sites were used to verify the model. Tsunami waveforms for the 2006, 2007 and 2009 earthquake events near Simushir Island were simulated and found to be in good agreement with the observations. The correlation coefficients between the predicted and ob-served tsunami waveforms were from 0.50 to 0.85. Thus, the proposed method can be effectively used to simulate tsunami waveforms for the entire ocean and also for both regional and local tsunami warning services, assuming that they have ac-cess to the real-time sea level data from DART stations.
1 Introduction
A short-term tsunami forecast and effective tsunami warning is a key problem of the tsunami service. At present, the con-ventional method for short-term tsunami forecasting is based
Correspondence to: Yu. P. Korolev (yu p [email protected])
on seismic information only (earthquake magnitude, time of the main shock and epicenter location). This method pro-vides the fastest indicator of the tsunamigenic potential of the earthquake; it also enables us to quickly estimate the ex-pected tsunami arrival time. Tsunami alert criteria are de-pendent on the exact source region and on historical tsunami impacts (Igarashi et al., 2011). An earthquake magnitude which exceeds the established threshold value, which is dif-ferent for difdif-ferent tsunamigenic zones, typically results in the issuing of a Tsunami Warning (Gusiakov, 2011). This approach, based on a “magnitude-geographical principle” is straightforward and rather effective: at least it ensures few tsunami omissions. However, this method cannot provide sufficiently accurate estimates of tsunami wave heights, espe-cially for specific coastal areas. Firstly, this is because the de-pendence of the tsunami intensity on the earthquake magni-tude is far from being deterministic (Gusiakov, 2011): strong earthquakes can produce weak tsunamis (or no tsunamis at all) and, vice versa, sometimes destructive tsunamis are in-duced by relatively weak earthquakes. Secondly, because actual tsunami runups are strongly variable along the coast (cf. MacInnes et al., 2009), the tsunami alarm can be justi-fied for one coastal site but false for another one. Moreover, the magnitude-geographical warning method does not allow evaluation of the duration of the tsunami alarm or prediction of the arrival time of the largest tsunami wave (not necessary the first, which is quite typical for tsunami events, cf. Ra-binovich et al., 2008). Consequently, up to 75 % of tsunami warnings turn out to be false (Gusiakov, 2011). False tsunami warnings cause anxiety among emergency managers, gov-ernment officials and the business community. These false alarms result in actual financial losses, sometimes signif-icant1, including losses due to production downtime, and
1The cost of the false alarm associated with the 1994 Shikotan
expenses for the emergency evacuation procedures and navi-gation of vessels to the open sea (NOAA Magazine, 2011).
According to the modern concept, a tsunami alarm should be declared timely and selectively only for exposed coastal areas where the incoming tsunami will be of a real threat. Each tsunami alarm should be accompanied by trustwor-thy information on the expected tsunami arrival time, wave heights along the coast, their frequencies, and the duration for dangerous oscillations to remain in effect. However, based merely on the seismological data such information cannot be obtained. Meanwhile, emergency managers and local officials are in urgent need of effective operational tools that can provide reliable tsunami forecasts as guidance for rapid, critical decisions in which lives and property are at stake (Titov et al., 2005).
From this point of view, direct tsunami monitoring in the open ocean by DART2stations can significantly improve the situation (Titov et al., 2005; Titov, 2009). These deep-ocean real-time tsunameters have been developed by the Pacific Marine Environmental Laboratory (PMEL/NOAA) for the early detection, measurement, and real-time reporting of far-field tsunamis. These stations have been deployed at strate-gic locations throughout the Pacific Ocean near the main seismically active regions with a history of tsunami gener-ation (Mofjeld, 2009). DART tsunami monitoring systems were expected to become a backbone of the modern Tsunami Warning System (TWS) in the Pacific Ocean.
The principal methodology of the tsunami forecast based on open-ocean sea level measurements had been developed during 1985–2005 (cf. Satake, 1987; Chubarov and Shokin, 1995; Korolev and Poplavsky, 1995; Poplavsky et al., 1997; Voronina and Tcheverda, 1998; Wei et al., 2003; Titov et al., 2005; Yamazaki et al., 2006). However, only recent advances in tsunami measurement and numerical model-ing technology made it possible to create effective tsunami forecasting systems. The tsunami forecasting technology elaborated at PMEL is based on the integration of realtime DART measurements and state-of-the-art numerical model-ing (Titov et al., 2005). This technology was applied in an operative regime for several 2005–2011 major events and demonstrated to be highly efficient (cf. Tang et al., 2008; Wei et al., 2008; Titov, 2009). The maximum wave heights and other parameters of arriving tsunami for several US sites were predicted and were later found to be in good agreement with the actual in situ observed waves (Titov, 2009).
It should be noted, however, that the PMEL technology is based on a pre-computed Propagation Database to compute a quick preliminary forecast of the ocean-wide propagation of the tsunami as a linear combination of unit sources se-lected to represent the initial earthquake parameters. Once the actual tsunami wave reaches a DART station, inversion is
2DART=Deep-ocean Assessment and Reporting of Tsunami is
a deep-sea tsunami monitoring system by the US National Oceanic and Atmospheric Administration (NOAA).
performed to adjust the slip distribution of the selected unit sources. The Propagation Database is a key component of the operational tsunami forecasting system (known as SIFT). At present, it includes 1691 pre-computed model runs for simulated earthquake sources in the Pacific, Atlantic and In-dian oceans (Titov, 2009; see also http://nctr.pmel.noaa.gov/ propagation-database.html).
In the present study we suggest a simple method for short-term tsunami forecasting that does not require pre-computed tsunami waveforms. The method is based on a reciprocity principle (cf. Rayleigh, 1945; Loomis, 1979) and uses only the seismological information about co-ordinates of the earthquake epicenter and in situ tsunami data from one of the far-field open-ocean DART stations. This method can work in a real-time mode and, therefore, be effectively used for local Tsunami Warning.
2 Reciprocity principle
The reciprocity principle for harmonic waves in acoustics has been known for more than 140 yr, since the pioneer studies of Hermann von Helmholtz and Lord Rayleigh (cf. Rayleigh, 1945). It is a corollary of the properties of symmetry of Green’s function for a linear wave equation. The validity of the reciprocity principle for an inhomogeneous medium with reflecting, absorbing and mixed (impedance) boundaries was proved later. It is valid for any areas, including shadow zones, and including the case of non-stationary waves (Cher-tock, 1970). The reciprocity principle is widely applied in hydroacoustics for hydrophone calibration (Uric, 1975). The first use of this principle for long water waves was probably suggested by Loomis (1974, 1979). The reciprocity principle was found to be effective to optimize tsunami precomputa-tions. However, the effects of the ocean depth inhomogeneity had not been analysed previously. In view of large horizontal scales of tsunami sources, these effects can be significant.
Let’s assume that a wave’s process is described by the lin-ear shallow-water equations: SourceT is located within area ST with the earthquake epicenter at pointT with coordinates
(xT, yT), while SourceAis within areaSAwith the
epicen-ter atA(coordinatesxA, yA). For simplicity, the initial sea
surface elevation is used as the wave source.
It is not difficult to demonstrate, following the algorithm described by Brekhovskikh (1960) and Landau and Lif-shits (1987), that for water waves from two distant sources AandT in areasSAandST, the following exact relationship
is true:
Z
SA
ζA0(x,y)×ζT(s,x,y)×dxdy
=
Z
ST
ζT0(x,y)×ζA(s,x,y)×dxdy, (1)
whereζA0(x,y), ζT0(s,x,y)are the initial elevations of the
free surface within areasSAandST,ζT(s;x,y)is the Laplace
transform of the waveform from SourceT in areaSA, while ζA(s;x,y)is the Laplace transform of the waveform from
SourceAin areaST. The relationship (1) and the following
reciprocity relationships are true in inhomogeneous media if the processes are linear and boundaries are reflecting and/or absorbing.
The classical statement of the reciprocity principle re-quires the following conditions to be satisfied:
a. The distance between the sources has to be longer than the wavelengths (x,yscales of the source areas), i.e. the variation1ζAshould be significantly smaller than
func-tionζA(s;x,y)within the areaST: 1ζAζA(s;x,y).
This should also be true for the functionζT(s;x,y). An
alternative asymptotic condition may be formulated in the time domain: typical wave periods should be signif-icantly smaller than the time of wave propagation be-tween the sources.
b. The horizontal (x,y)scales of both source areas have to be shorter than the wave lengths of the generated tsunami waves.
Therefore, functionsζA(s;x,y)andζT(s;x,y)in Eq. (1)
can be removed from the integrals and replaced by mean val-ues at pointsT andA. Thus, an approximate expression that follows from Eq. (1) is:
ζT(s,xA,yA)×
Z
SA
ζA0(x,y)×dxdy≈ζA(s,xT,yT)
×
Z
ST
ζT0(x,y)×dxdy.
Designating R
SA
ζA0(x,y)×dxdy = QA and
R
ST
ζT0(x,y)×dxdy=QT, we can rewrite the last
rela-tionship as:
ζT(s;xA,yA)×QA≈ζA(s;xT,yT)×QT, (2)
whereQAandQT are the volumes of the initial disturbances.
Due to the medium inhomogeneity (variable speed of wave propagation) and large horizontal source scales in compari-son with the water depth, the initial free surface elevations should satisfy to the following conditions:
Fig. 1. A map showing the region of the South Kuril Islands and a
scheme of numerical experiments. Symbols 1, 2 andT indicate the epicenters of the sources. Initial sea surface elevations at Source 1 and SourceT are pictured.
– the forms of the initial disturbances should be similar; – the disturbance radiiRAandRT are related as RA
√
gDA
=√RT
gDT
, (3)
whereDA andDT are the water depths at pointsAandT
andgis the gravitational acceleration.
The approximate relationship (2) and the condition of sim-ilarity Eq. (3) are known as dynamic reciprocity principle (re-lationships) for non-stationary long water waves (Poplavsky et al., 1997).
Additionally, if the disturbance volumes are identical (aA×R2A=aT×RT2, i.e.QA=QT), then after the inverse
Laplace transform the waveforms also will match each other: ζT(t,xA,yA)=ζA(t,xT,yT). (4)
It is of interest to identify whether the relationship (4) is fair if conditions (a) and (b) are not satisfied. This is the subject of a study represented below.
To verify this approach we made several numerical ex-periments. The numerical simulations based on actual bathymetry were conducted for the region of the South-ern Kuril Islands. Source 1 was located in the Sea of Okhotsk northwest of Kunashir Island; Source 2 in Yuzhno-Kurilsk Strait, between Kunashir and Shikotan islands; and the SourceT was in the Pacific Ocean southeast of Shikotan Island. The computational domain for the numerical exper-iments indicating the location of the sources is shown in Fig. 1. The bathymetry grid for these experiments was cho-sen to have a spatial step1x=1y=1000 m.
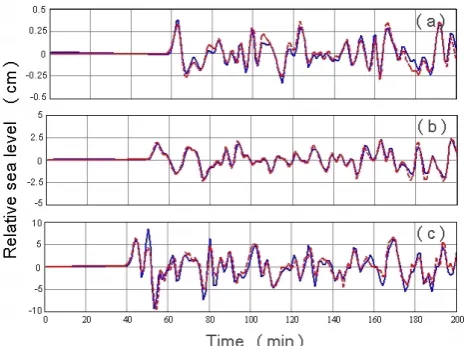
Fig. 2. Illustration of the reciprocity relationships. (a) Waveforms at
SiteT due to Source 1 (blue solid line) and at Site 1 due to SourceT
(red dashed line); correlation coefficientρ12=0.96. (b) Wave-forms at Site 2 due to Source 1 (blue solid line) and at Site 1 due to Source 2 (red dashed line); correlation coefficientρ12=0.94. (c) Waveforms at SiteT due to Source 2 (blue solid) and at Site 2 due to SourceT (red dashed line) correlation coefficientρ12=0.91.
Source 1: max ampl.a1=0.4 m, radiusR1=25 km,
water depth in epicenterD1=2418 m;
Source 2: max ampl.a2=15.6 m, radius R2=4 km,
water depth in epicenterD2= 63.6 m;
Source T: Max ampl. aT = 0.49 m, radius RT =
22.5 km, water depth in epicenterDT= 2030 m.
The results of these simulations are shown in Fig. 2. The correlation coefficient,ρ, was chosen as a criterion for com-parison of the reciprocal waveforms.
The coincidence of waveforms according to Eq. (4) is quite good despite wave sheltering by a chain of islands. The typical wave periods are about 10–18 min; the time of wave propagation is 57 min between Sources 1 andT, 50 min between Sources 1 and 2, and 40 min between Sources 2 andT. These propagation times are only three times longer than the wave periods. It is possible to make certain that wave lengths in the reciprocity source areas exceed their sizes. For example, the wavelength (λ2) in Source 2 for
period ofT2=18 min and water depthD2=63.6
9 the wavelength (λ2) in Source 2 for period of T2 = 18 min and water depth D2 = 63.6 м is
1
≈ ⋅
= 2
2 T gD
λ 27 km, while the diameter of Source 2 is 8 km. 2
Numerical experiments show that relationship (2) with condition (3) is true even if the 3
distance between the sources is of the same order as the sizes of the source areas and if the wave 4
lengths are comparable to or longer than these sizes. As was found from our experiments, 5
changing the radius of one of the sources by 25 % does not significantly influence the output. 6
Additional experiments were done when Sources 1 and 2 were the same, but Source Т was 7
not a circle but an ellipse. The ellipse minor (b2) and major (b1) axes were chosen as (1) b1=
8
63.6 km and b2= 31.8 km (b2/ b1= 1/2); and (2) b1= 77.9 km and b2= 26.0 km (b2/ b1= 1/3);
9
maximum amplitude aT = 0.49 m and water depth in epicenter DT= 2030 m (for both cases).
10
We also changed the orientation of the major axis relative to true north. The condition of 11
similarity of the source forms was not true, but it was accepted that
T A A gD b b gD
R 1 2
2 = ⋅ and 12 2 1 2 1 1
4aR =aTbb. The respective numerical results are shown in Fig. 3.
13
14
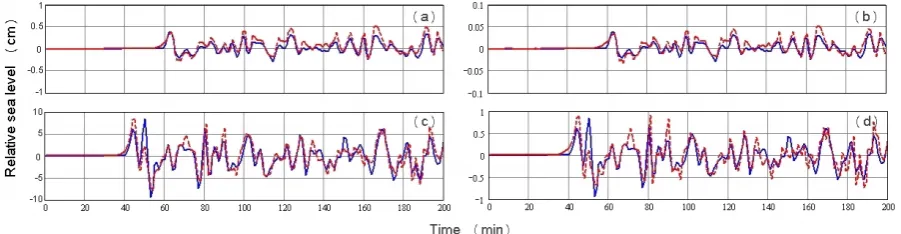
Fig. 3. Illustration of the reciprocity relationships. Elliptic Source T is elongated to the north-15
west (see Fig.1). The ratio of major/minor axes is equal to 2.0 (left column) and to 3.0 (right 16
column). Upper row: waveforms (a) at Site T due to Source 1 (blue solid line) and (b) at Site 1 17
due to Source T (red dashed line); correlation coefficients are ρ12 = 0.90 (a) and ρ12 = 0.87 (b).
18
Lower row: waveforms at (c) Site T due to Source 2 (blue solid line), and (d) at Site 2 due to 19
Source T (red dashed line); correlation coefficients are ρ12 = 0.86 (c) and ρ12 = 0.78 (d).
20 21
isλ2= T×√gD2≈27 km, while the diameter of Source 2 is 8 km.
Numerical experiments show that relationship (2) with condition (3) is true even if the distance between the sources is of the same order as the sizes of the source areas and if the wave lengths are comparable to or longer than these sizes. As was found from our experiments, changing the radius of one of the sources by 25 % does not significantly influence the output.
Additional experiments were done when Sources 1 and 2 were the same, but SourceT was not a circle but an ellipse.
The ellipse minor (b2)and major (b1)axes were chosen as
(1) b1=63.6 km and b2=31.8 km (b2/b1=1/2); and (2) b1=77.9 km andb2=26.0 km (b2/b1=1/3); maximum
am-plitudeaT =0.49 m and water depth in epicenterDT=2030
m (for both cases). We also changed the orientation of the major axis relative to true north. The condition of similar-ity of the source forms was not true, but it was accepted that
2RA √
gDA
=
√
b1×b2 √
gDT and 4a1R
2
1=aTb1b2. The respective
nu-merical results are shown in Fig. 3.
The correlation coefficients in all cases are in the range of 0.67 to 0.90. The best result is in the case when the ma-jor axis was directed toward the north-west. This agreement is good enough and sufficient for any practical applications. The relationship (4) was found to be fair not only for circular sources but also for elliptic sources, at least for the moderate ratios of axes lengths.
3 A method of short-term tsunami forecasting
The classical statement of the reciprocity principle requires conditions (a) and (b) (see the previous section); however, our numerical experiments demonstrate that it can still be applied without these strict contingencies. The results pre-sented below could become the basis for the short-term tsunami forecasting.
3.1 The reciprocity principle and main computing relationships
Korolev (2004, 2005) demonstrated that the derived reci-procity relationships could be efficiently applied for the prob-lem of short-term (operative) tsunami forecasts based on sea level data from a remote open-ocean site. It is assumed that the reciprocity relationship (2) is true when one of the sources is natural, while the other source is artificial (numer-ical).
Let’s assume Tsunami SourceT, the initial sea surface el-evation, is located within the areaST. The total volume of
the disturbed uplift isQT. Let us also assume thatM
indi-cates the site of a sea level gauge (i.e. DART site) andAthe site of interest (a point for tsunami forecasting). The prob-lem is to compute the tsunami waveform at siteA(“target site”) using the sea level data at site M (“reference site”). Mathematically, this problem does not have a unique solu-tion. However, it can be considered as a “consumer’s prob-lem”. Specific methods should be developed for solving this problem.
In this section, “waveform” means the Laplace (Fourier) transform of the waveform. Let the reciprocal sources be lo-cated within areas with epicentres atAandM. Their dis-turbed volumes are QA and QM, whileηA(s;xT,yT) and ηM(s;xT,yT)are the waveforms at site T from reciprocal
sourcesSA andSM. For the natural tsunami waveform and
Fig. 3. Illustration of the reciprocity relationships. Elliptic SourceT is elongated to the north-west (see Fig. 1). The ratio of major/minor axes is equal to 2.0 (left column) and to 3.0 (right column). Upper row: waveforms at SiteT due to Source 1 (blue solid line) and at Site 1 due to SourceT (red dashed line); correlation coefficients areρ12=0.90 (a) andρ12=0.87 (b). Lower row: waveforms at SiteT due to
Source 2 (blue solid line), and at Site 2 due to SourceT (red dashed line); correlation coefficients areρ12=0.86 (c) andρ12=0.78 (d).
for waveforms from the reciprocal sources inSAandSM,
re-lationships (2) are:
ζT(s,A)×QA=ηA(s,T )×QT; ζT(s,M)×QM=ηM(s,T )×QT .
In these expressions we designated:ζT(s,A)≡ζT(s,xA,yA), ζT(s,M)≡ζT(s,xM,yM)and so on.
In addition, let’s assume that the auxiliary sources are in the areas with the same epicenters atA, M andT (wave-forms and disturbed volumes are designated by symbols with primes). For waveforms from these sources the reciprocity relationships are also true:
η0T(s,A)×Q0A=η0A(s,T )×Q0T η0T(s,M)×Q0M=η0M(s,T )×Q0T
As the auxiliary sources may be selected rather arbitrarily; in particular,QA,QM andQ0A,Q0M may be selected in such a
way thatη0Ais equal toηA, and similarly forη0M andηM. It
is true ifQA=Q0A, and the same for SourceM.
Eliminating unknownQT from the above-mentioned two
systems yields the following relationship: ζT(s,A)
ζT(s,M)
= ηT(s,A)
ηT(s,M)
. (5)
Let us assume that functions on the left side of the equation relate to one tsunami source, and functions on the right side relate to another source, and both sources have the same epi-center. The relationship (5) supports the well-known fact that spectra of any two tsunamis from different sources are sim-ilar when recorded in the same site, whereas spectra of any two tsunamis from the same source are dissimilar at different sites (cf. Takahasi and Aida, 1961; Miller, 1972).
From Eq. (5) we can get the following main relationship: ζT(s,A)=ζT(s,M)
ηT(s,A) ηT(s,M)
. (6)
HereζT(s,A)is the target function (tsunami waveform at A);ζT(s,M)is the reference function (tsunami waveform at M, i.e. open-ocean DART data); andηT(s,M)andηT(s,A)
are the numerical waveforms atMandAfrom the auxiliary source located atST. All functions are Laplace transforms.
The ratio on the right side of Eq. (6) plays the role of a trans-fer function.
It should be noted that the generation mechanism of the actual tsunami is not important here. The method can be ap-plied for short-term forecasting irrespective of the tsunami source, in particular for tsunamis produced by earthquakes, volcanic eruptions, submarine landslides or other phenom-ena. However, for the practical realization of the proposed method it is important to assume that the transfer function for the corresponding event can be constructed as the ratio of the Laplace transforms of the waveforms at appropriate sites initiated by an initial free surface elevation. This elevation was supposed to be circular with a diameter of 50–100 km depending on the characteristic transversal size of the earth-quake source. There is no requirement to know the detailed seismological information about the source; it is enough to know the coordinates of the earthquake (or another source) epicenter. This will enable us, with an accuracy sufficient for practical use, to create a short-term tsunami forecast for specific coastal sites.
The target tsunami waveform at site A, i.e. the left side function in expression (6), can be estimated after applying the inverse Laplace (Fourier) transform to Eq. (6) (Korolev, 2004). In fact, the proposed method is a generalization of the methods suggested earlier by Miller (1972), Chubarov and Shokin (1995) and Chung et al. (1995).
3.2 Computing the short-term tsunami forecast
The algorithm for computing the tsunami waveform based on sea level data from remote sites includes the following steps: 1. Deriving the coordinates of the earthquake (or other
2. Computing the tsunami waveforms for the reference siteMand the target (forecasting) siteA, i.e. functions ηT(s;M)andηT(s;A). The auxiliary source is a
cir-cle with diameter of 50–100 km located in the center of the actual tsunami source. The computation (evaluation of the transfer function) should be completed before the tsunami reaches the reference DART site (normally the site nearest to the source).
3. Acquiring the tsunami data from the appropriate refer-ence DART station; eliminating tidal components from the corresponding record.
4. After recording and identifying tsunami waves at the reference DART station (SiteM), the tsunami forecast can be made for the target site A based on relation-ship (6). Similarly, in real-time mode, tsunami forecasts can be provided for other target sites (e.g. for particular sites along the coast). In fact, the preliminary forecast can be given after recording the first tsunami semi-wave. Hereafter, as new and more complete information is re-ceived, this forecast can be corrected and improved. 5. The forecast results can be used by TWCs for making
their decision about declaring or cancelling the Tsunami Warning.
4 Short-term tsunami forecast
Some preliminary research results published in 2005, 2011 (Korolev, 2005; Korolev and Zaytsev, 2005; Korolev, 2011) demonstrated that the proposed method can be efficiently used for short-term tsunami forecasting. In particular, it was shown that the proposed method can work in a real-time mode and that the errors in the epicenter location only slightly affect the quality of the forecast.
4.1 Preliminary information
In the present study we apply this method to hindcast tsunamis waveforms for three tsunamigenic earthquakes that occurred in 2006, 2007 and 2009 in the region of the Central Kuril Islands, eastward from Simushir Island. Associated tsunamis were recorded by a number of tide gauges on the coasts of Russia and Japan (cf. Fujii and Satake, 2008; Ra-binovich et al., 2008) and by several DART stations located along the Aleutian Islands and the US West Coast (Laverov et al., 2009; NOAA NDBC, 2011).
Tsunami waveforms were simulated for the locations of the DART stations. The actual in situ tsunami records data from the DART stations closest to the earthquake epicenters were used for the hindcast. The data from other DART sta-tions, located further from the epicenter, were used to com-pare with the predictions and to verify the method. In the present study we used only deep-ocean stations, not affected by coastal resonant effects and surf beats. All computations
were made based on the shallow-water numerical model de-scribed by Poplavsky et al. (1997). We used the Mercator projection with a spatial grid step of 3.8 km at latitude 40◦N. Bathymetric data were interpolated from the ETOPO2 global dataset (Smith and Sandwell, 1994). The correlation coeffi-cient,ρ, was chosen as the criterion for comparison of the observed and predicted waveforms.
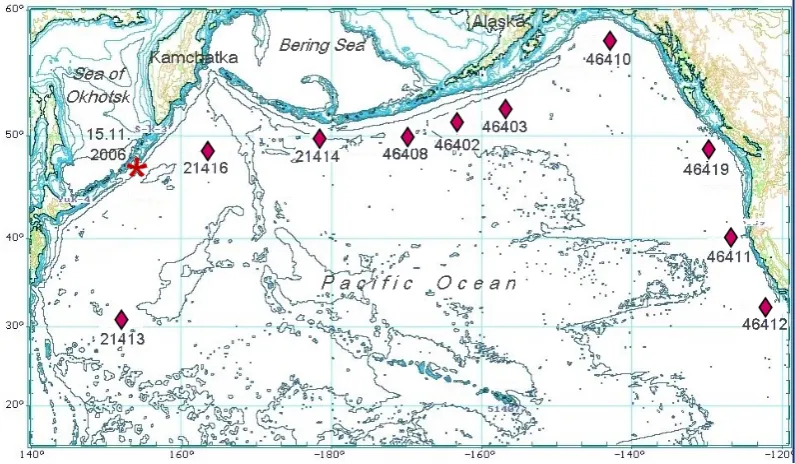
The scheme of the research experiments, indicating the earthquake epicenter and positions of the DART stations, are shown in Fig. 4. The hindcasting results are represented be-low.
4.2 The November 2006 Simushir tsunami
The tsunami was generated by a major earthquake (Mw=
8.3) on 15 November 2006 with epicenter at 46.592◦N, 153.226◦E near the Central Kuril Islands (NGDC Tsunami Database, 2011). Significant wave heights were observed along the coasts of the Kuril Islands (cf. Rabinovich et al., 2008; MacInnes et al., 2009). No seismological information about the earthquake, except the epicenter coordinates, was used in the following computations.
The auxiliary source with an initial circular sea surface uplift of 75 km in diameter and with a maximum height of 10 m was chosen as the input for the model. The selected source center coincided with the earthquake epicenter. The ocean depth in the epicenter, based on the bathymetry grid readings, was 2803 m.
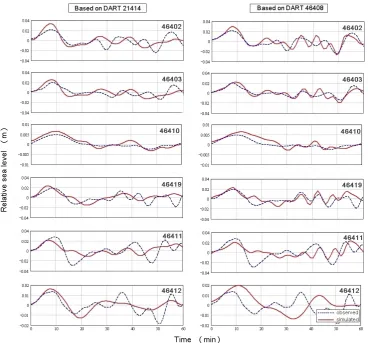
Figure 5 shows hindcast results and the waveforms of the observed tsunami waves. The computed waveforms match well the observed tsunami waveforms at DART sta-tions 46402, 46403 and 46410 along the Aleutian Islands. Similar good agreement was observed also for DART sta-tions 46419, 46411 and 46412 along the US West Coast. In all cases, the best agreement was for a few leading waves; the correlation coefficients for these waves were within the rangeρ=0.70–0.85.
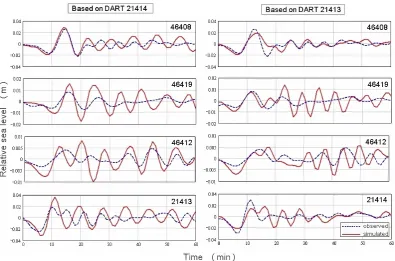
4.3 The January 2007 Simushir tsunami
The tsunami was generated by a major earthquake (Mw=
8.1) on 13 January 2007 with epicenter at 46.243◦N, 154.524◦E located on the oceanic slope of the Central Kuril Trench (NGDC Tsunami Database, 2011). This tsunami was weaker that the 2006 Simushir tsunami, but was locally quite intensive (Rabinovich et al., 2008).
The auxiliary source chosen as input for the model was the same as for the 2006 event (an initial circular uplift of 75 km in diameter and maximum height of 10 m). This source cen-ter coincided with the earthquake epicencen-ter. The ocean depth at the epicenter was 6877 m. This tsunami was recorded by a smaller number of DART stations than the 2006 tsunami (cf. Laverov et al., 2009); however, one of these stations was DART 21413, which was not in operation during the previ-ous (2006) event. This station was located southward from
Fig. 4. A map of the North Pacific Ocean showing positions of DART stations and the epicenter of the 2006 Simushir earthquake. Epicenters
of the 2007 and 2009 Simushir earthquakes are only slightly shifted from the location of the 2006 epicenter.
the 2007 epicenter (690 miles southeast from Tokyo); dur-ing the 2006 event the tsunami was only recorded by DART stations located to the east of the source. It is of additional in-terest to compare the results for open-ocean stations located in various directions from the source. The corresponding re-sults are shown in Fig. 6.
In general, the agreement between computed and observed waveforms is satisfactory both for DART 46408 near the Aleutian Islands and for DARTs 46419 and 46412 along the US West Coast. Hindcasts based on data from both sta-tions 21414 (eastward from the source) and 21413 (south-ward from the source) are of almost identical quality. For all cases, the computations show correctly the tsunami man-ifestation during the initial (negative) phase. The correlation coefficients were within the rangeρ=0.50–0.72.
4.4 The January 2009 Simushir tsunami
The earthquake (Mw=7.4) occurred on 15 January 2009,
approximately in the same region of the Central Kuril Is-lands as the 2006 and 2007 earthquakes, but it was weaker than the two previous earthquakes. The epicenter of the earthquake was located at 46.857◦N, 155.154◦E (NGDC Tsunami Database, 2011). The earthquake generated a tsunami that was recorded along the coast of the Kuril Islands and by a few DART stations, in particular by DART 21416 located 240 miles from the Kamchatka Peninsula. The latter station was the nearest to the epicenter.
The auxiliary source was taken as a circular uplift of the sea surface 50 km in diameter and maximum height of 8 m; the source center coincided with the earthquake epicenter.
This source was used as the input for the model. The ocean depth at the epicenter was 6645 m.
The computed and observed tsunami waveforms are shown in Fig. 7. The data from DART 21416 were used to hindcast the waveforms for DART 46408, located east-ward from the source, and for DART 21413, located south-ward from the source. Similar computations were also made for DARTs 21416 and 46408 based on the data from DART 21413. The computed waveforms were in good agreement with the observed tsunami records for both the area of the Kamchatka Peninsula (point 21416) and the area of the Aleu-tian Islands (point 46408), especially for the leading waves. The correlation coefficients were within the rangeρ=0.75– 0.80.
4.5 Dependence of the hindcast quality on the diameter of the auxiliary source
Fig. 5. Computed and observed tsunami waveforms for the 2006 Simushir earthquake for DART sites in the North Pacific Ocean (see Fig. 4
for the DART positions). Left column: using DART 21414 as the reference station; right column: using DART 46408 as the reference station.
4.6 Results and discussion
The results of our numerical experiments demonstrate that the diameter of the auxiliary source does not significantly in-fluences the quality of the tsunami forecasting. The best re-sults are achieved (as could be expected) when this diameter is similar to the actual characteristic (transversal) size of the earthquake source area.
In general, the main scope of the present study was to use the observational data from the 2006, 2007 and 2009 Simushir tsunamis to verify the model and this approach. The results are very encouraging. Tsunami forecasts give al-most identical results based either on the data from reference DART stations located in the same direction as the target sites (eastward) or from the stations located in other directions (in particular, southward). The results represented in Sects. 4.2– 4.4 confirm the validity of the assumptions made in Sect. 3.1 about this method to evaluate the transfer function describing the evolution of the propagating tsunami waves.
Despite its approximate character, the proposed method can provide the forecast of tsunami wave parameters for any ocean site with sufficiently high quality, and provide real-time operative information for tsunami warning services. It took less than 40 min to compute the waveforms from the auxiliary source (including the estimation of the transfer function and tsunami forecast for target sites). The tsunami propagation time from the source to the nearest open-ocean station (DART 21414) was about 150 min for the 2006 and 2007 Simushir events and about 50 min to DART 21416 for the 2009 event. Thus, taking into account these propaga-tion times and the time needed to identify the tsunami wave in the in situ record (about half of the first wave period), we can estimate the “forecast time” as being approximately 1.5–3 h. Tsunami wave propagation time from the coasts of Japan and Russia to the US West Coast is approximately 9– 10 h; that means there are 6–8 h of advance time before the tsunami reaches that coast. Similarly, for tsunamis generated in the Cascadia Subduction Zone (near the US West Coast), there 6–8 h of advance time that can be used for the Tsunami
Fig. 6. The same as in Fig. 5 but for the 2007 Simushir tsunami. Left column is for DART 21414 as the reference station; right column is for
DART 21413 as the reference station.
Fig. 7. The same as in Fig. 5 but for the 2009 Simushir tsunami. Left column is for DART 21416 as the reference station; right column is for
DART 21413 as the reference station.
Warning on the coasts of Russia and Japan. These simple estimates demonstrate that the proposed method satisfies the requirements of the warning services and can be effectively used for the Tsunami Warning.
The comparison of results presented in this paper with some other results based on assimilation of DART data (cf. Tang et al., 2008; Wei et al., 2008; Titov, 2009) shows that the forecast quality obtained by different methods is com-parable. The advantage of the proposed method is that it does not require pre-computed database of synthetic tsunami waveforms. It is especially important for the areas where tsunami early warning systems are just being established and there are no pre-computed databases.
a straightforward forecast not only of the leading tsunami waves but also following tsunami waves which can be much more intensive than the leading waves.
In the present study, the duration of the computed tsunami waveforms did not exceed the duration of the original tsunami records obtained at DART stations. The practical interest is to predict tsunami waveforms of long duration, which would take into account secondary waves reflected from island chains, submarine ridges and mainland coasts. This can be the next step in improvement of the proposed method.
5 Conclusions
The reciprocity principle, known in acoustics as an asymp-totic assumption, is applied to describe long ocean waves. The similarity conditions for reciprocal sources are obtained. It is shown in numerical experiments that, with a quality sufficient for practical applications, the reciprocity principle Eq. (2), Eq. (3) works quite well even when conditions (a), (b) are not totally satisfied (i.e. when the characteristic time of the wave propagation between the sources is only three to five times greater than the typical wave period, or when the characteristic wavelength exceeds the size of the source area).
The paper presents a method of short-term tsunami fore-cast using open-ocean sea-level data from distant sites based on the reciprocity principle. It is assumed that the proposed method will enable the computation of a reliable tsunami pre-diction irrespective of the tsunami generation mechanism. The only additional information required for this method (except an open-ocean in situ record) is the location of the earthquake epicenter. The method enables us to compute expected tsunami waveforms in real-time mode and for any given ocean site.
The method enables the transfer function to be evaluated during the event immediately after obtaining information about the earthquake epicenter location. In contrast to the PMEL/NOAA technology, which is based on a pre-computed Propagation Database that needs updating for newly de-ployed open-ocean stations, the present method does not re-quire pre-computed tsunami waveforms.
This reciprocity principle method was applied to compute waveforms of the 2006, 2007 and 2009 Simushir tsunamis. The actual tsunami records from open-ocean DART stations were used to verify the method and to estimate the effective-ness of this approach. The computed and observed tsunami waveforms for the regions of the Aleutian Islands and the US West Coast were in good agreement, satisfying the require-ments of tsunami warning services. The proposed method can be considered as the basis for creating a program pack-age that can be applied for early tsunami warning for the sites exposed to the tsunami threat. The method can be used for both regional and local tsunami warning services having
access to the open-ocean (DART) data in a real-time mode. The method can be applied for newly developing tsunami centers.
Acknowledgements. The author would like to thank Alexei
Ivashchenko, Frank Gonz´alez and Issac Fine for their valuable comments and suggestions and Alexander Rabinovich and Fred Stephenson for editing the text.
Edited by: S. Monserrat
Reviewed by: F. Gonzalez and I. Fine
References
Brekhovskikh, L. M.: Waves in Layered Media, Academic Press, New York, 561 pp., 1960.
Chertock, G.: Transient flexural vibrations on ship-like structures exposed to underwater explosions, J. Acoust. Soc. America, 48, 170–180, 1970.
Chubarov, L. B. and Shokin, Yu. I.: Mathematical modeling in miti-gating the hazardous effect of tsunami waves in the ocean, A pri-ori analysis and timely on-line forecast, Sci. Tsunami Hazards, 13, 27–44, 1995.
Chung, J. Y., Kim, S. D., and Ivanov, V. V.: Tsunami wave hind-casting in the Japan Sea, in: Tsunami: Progress in Prediction, Disaster Prevention and Warning, edited by: Tsuchiya, Y. and Shuto, N., Kluwer Academic Publishers, 85–98, 1995.
Fujii, Y. and Satake, K.: Tsunami sources of the November 2006 and January 2007 Great Kuril Earthquakes, Bull. Seism. Soc. Amer., 98, 1559–1571, 2008.
Gusiakov, V. K.: Relationship of tsunami intensity to source earth-quake magnitude as retrieved from historical data, Pure Appl. Geophys., 168, 2033–2041, doi:10.1007/s00024-011-0286-2, 2011.
Igarashi, Y., Kong, L., Yamamoto, M., and McCreery, C. S.: Anatomy of historical tsunamis: lessons learned for tsunami warning, Pure Appl. Geophys., 168, 2043–2063, doi:10.1007/s00024-011-0287-1, 2011.
Korolev, Yu. P.: Tsunami numerical modeling for short-term fore-casting using data of remote level gauges, Oceanology, 44, 346– 352, 2004.
Korolev, Yu. P.: The method of the early tsunami warning using data of remote level gauges, in: Proc. 22nd Int. Tsunami Symp., Chania, Crete Island, Greece, 27–29 June 2005, 113–119, 2005. Korolev, Yu. P.: Retrospective short-term forecast of the 1996 An-dreanov (Aleutian Islands) tsunami, Oceanology, 51, 385–393, 2011.
Korolev, Yu. P. and Poplavsky, A. A.: A method of tsunami esti-mation for short-range forecast service, in: IUGG, XXI General Assembly, Boulder, Colorado, A335, 1995.
Korolev, Yu. and Zaytsev, A.: The numerical model of the early tsunami warning, in: Waves Measurement and Analysis, Proc. Fifth Int. Symp. WAVES 2005, 3–7 July, 2005, Madrid, Spain (on CD), paper #89, (see also Book of Abstracts, 89–90), 2005. Landau, L. D. and Lifshits, E. M.: Fluid Mechanics, Vol. 6 (Course
of Theoretical Physics), Butterworth-Heinemann, 1987. Laverov, N. P., Lobkovsky, L. I., Levin, B .W., Rabinovich, A.
B., Kulikov, E. A., Fine, I. V., and Thomson, R. E.: The Kuril tsunamis of November 15, 2006, and January 13, 2007:
sian Academy of Sciences, Earth Science Section, 426, 386–392, 2009.
Loomis, H. G.: Solution of the linear, long-wave hydrodynamic equations by using unit impulse functions, in: Tsunami Res. Symp. 1974, edited by: Heath, R. A. and Cresswell, M. M., Roy. Soc. New Zealand and UNESCO, Paris, 155–158, 1974. Loomis, H. G.: Tsunami prediction using the reciprocal property of
Green’s functions, Mar. Geodesy, 2, 27–39, 1979.
MacInnes, B. T., Pinegina, T. K., Bourgeois, J., Razhigaeva, N. G., Kaistrenko, V. M., and Kravchunovskaya, E. A.: Field survey and geological effects of the 15 November 2006 Kuril tsunami in the middle Kuril Islands, Pure Appl. Geophys., 166, 9–36, 2009. Miller, G. R.: Relative spectra of tsunamis, Hawaii Inst. Geophys.
HIG-72-8, Honolulu, 7 pp., 1972.
Mofjeld, H. O.: Tsunami measurements, in: The Sea, edited by: Bernard, E. N. and Robinson, A. R., Harvard University Press, Cambridge, Vol. 15, 201–235, 2009.
NGDC Tsunami Database: available at: http://www.ngdc.noaa.gov/ hazard/tsu db.shtml, 2011.
NOAA Magazine: available at: http://www.magazine.noaa.gov/ stories/mag153.htm, 2011.
NOAA NDBC: available at: http://www.ndbc.noaa.gov/dart.shtml, 2011.
Poplavsky, A. A., Khramushin, V. N., Nepop, K. I., and Korolev, Yu. P.: The Operative Tsunami Prediction on the Sea Coasts of the Far East, DVO RAN, Yuzhno-Sakhalinsk, Russia, 1997 (in Russian).
Rabinovich, A. B., Stephenson, F. E., and Thomson, R. E.: The California Tsunami of 15 June 2005 along the coast of North America, Atmos.-Ocean, 44, 415–427, 2006.
Rabinovich, A. B., Lobkovsky, L. I., Fine, I. V., Thomson, R. E., Ivelskaya, T. N., and Kulikov, E. A.: Near-source observa-tions and modeling of the Kuril Islands tsunamis of 15 Novem-ber 2006 and 13 January 2007, Adv. Geosci., 14, 105–116, doi:10.5194/adgeo-14-105-2008, 2008.
Rayleigh Lord (Strutt, J. W.): The Theory of Sound, Vol. 2, Dover, New York, 1945.
fault heterogeneity: Method and numerical experiments, J. Phys. Earth, 35, 241–254, 1987.
Smith, W. H. F. and Sandwell, D. T.: Bathymetric prediction from dense satellite altimetry and sparse shipboard bathymetry, J. Geophys. Res., 99, 803–824, 1994.
Takahasi, R. and Aida, I.: Studies on the spectrum of tsunami, Bull. Earthq. Res. Inst., 39, 523–535, 1961.
Tang, L., Titov, V. V., Wei, Y., Mofjeld, H. O., Spillane, M., Arcas, D., Bernard, E. N., Chamberlin, C., Gica, E., and Newman, J.: Tsunami forecast analysis for the May 2006 Tonga tsunami, J. Geophys. Res., 113, C12015, doi:10.1029/2008JC004922, 2008. Titov, V. V.: Tsunami forecasting, in: The Sea, edited by: Bernard, E. N. and Robinson, A. R., Harvard University Press, Cambridge, Vol. 15, 367–396, 2009.
Titov, V. V., Gonz´alez, F. I., Bernard, E. N., Eble, M. C., Mofjeld, H. O., Newman, J. C., and Venturato, A. J.: Real-time tsunami forecasting: challenges and solutions, Nat. Hazards, 35, 35–41, 2005.
Uric, R. J.: Principles of Underwater Sound, McGraw-Hill Book Company, Inc, 1975.
Voronina, T. A. and Tcheverda, V. A.: Reconstruction of tsunami initial form via level oscillation, Bull. Novosibirsk Comp. Center, Ser. Math. Meth. Geophys., 4, 127–136, 1998.
Wei, Y., Cheung, K. F., Curtis, G. D., and MsCreery, C. S.: Inverse algorithm for tsunami forecasts, J. Waterw., Ports, Coastal Ocean Eng., ASCE, 129, 60–69, 2003.
Wei, Y., Bernard, E., Tang, L., Weiss, R., Titov, V., Moore, C., Spillane, M., Hopkins, M., and Kˆanodlu, U.: Real-time experimental forecast of the Peruvian tsunami of August 2007 for U.S. coastlines, Geophys. Res. Lett., 35, L04609, doi:10.1029/2007GL032250, 2008.