www.nat-hazards-earth-syst-sci.net/10/699/2010/ © Author(s) 2010. This work is distributed under the Creative Commons Attribution 3.0 License.
and Earth
System Sciences
Evaluation of a 3-D rockfall module within a forest patch model
W. Rammer1, M. Brauner2, L. K. A. Dorren3,*, F. Berger3, and M. J. Lexer1
1Institute of Silviculture, Department of Forest and Soil Sciences, University of Natural Resources and Applied Life Sciences,
Peter Jordanstraße 82, 1190 Vienna, Austria
2Institute of Mountain Risk Engineering, Department of Civil Engineering and Natural Hazards, University of Natural
Resources and Applied Life Sciences, Peter Jordanstraße 82, 1190 Vienna, Austria
3Cemagref Grenoble, 2 rue de la Papeterie, 38402 Saint Martin d’H´eres Cedex, France
*current address: Division for Hazard Prevention, Federal Office for the Environment (FOEN), 3003 Bern, Switzerland
Received: 31 January 2009 – Revised: 31 March 2010 – Accepted: 31 March 2010 – Published: 12 April 2010
Abstract. Many slopes in the Alps are prone to rockfall and forests play a vital role in protecting objects such as (rail) roads and infrastructure against rockfall. Decision support tools are required to assess rockfall processes and to quan-tify the rockfall protection effect of forest stands. This paper presents results of an iterative sequence of tests and improve-ments of a coupled rockfall and forest dynamics model with focus on the rockfall module. As evaluation data a real-size rockfall experiment in the French Alps and two 2-D rockfall trajectories from Austria and Switzerland were used. Mod-ification of the rebound algorithm and the inclusion of an algorithm accounting for the sudden halt of falling rocks due to surface roughness greatly improved the correspondence between simulated and observed key rockfall variables like run-out distances, rebound heights and jump lengths for the real-size rockfall experiment. Moreover, the observed jump lengths and run-out distances of the 2-D trajectories were well within the stochastic range of variation yielded by the simulations. Based on evaluation results it is concluded that the rockfall model can be employed to assess the protective effect of forest vegetation.
Correspondence to: W. Rammer
1 Introduction
Forests in mountainous regions provide important protection functions for society and particularly the protection against rockfall has attracted considerable attention recently. Rea-sons are that rockfall is one of the most common natural hazards in mountainous landscapes, and that the protective effect of many European mountain forests may decrease in the future due to abundant old-growth phases with a lack of regeneration (e.g., Ott et al., 1997; BFW, 2004). To study the development of the protective effect as well as the influence of forest management, reliable simulation tools are required which are able to take into account the spatial pattern of rock-fall processes on slopes as well as the effect of forest vege-tation composition and structure on run-out distances and ki-netic energies of falling rocks (Stoffel et al., 2006; Dorren et al., 2005). Due to the long time horizons of regeneration pro-cesses in mountain forests, models must be able to cope with time scales of several decades. Of particular importance are trade-off relationships between rockfall protection and other forest services and functions within the framework of multi-functional forest management.
Rockfall is defined here as a fast gravitational movement of rock boulders, rolling, tumbling or sliding down a hill-slope (Selby, 1995). Boulders act rather independently and the boulder size considered for trajectory analysis is typically below 5 m3.
Pamini, 1986; Azzoni et al., 1995; Pfeiffer and Bowenm, 1989; Pfeiffer et al., 1993). Typically, such models have been applied to support the design of technical rockfall protection measures. With the evolution of digital mapping and spatial modeling techniques a new class of 3-D models, simulating individual trajectories based on a digital elevation model, be-came increasingly popular (e.g. Agliardi and Crosta, 2003; Dorren et al., 2004; Lan et al., 2006). Such models are typi-cally used on local to regional scales.
However, although forests can offer an effective protection against rockfall (e.g. Bigot et al., 2009) only a small number of rockfall models take into account the mitigating effect of trees on forested slopes. These models consider the effect of forest vegetation either implicitely (e.g. Brauner et al., 2005; Wehrli et al., 2006; Berger and Dorren, 2007), using aggre-gated stand variables like stand density or average diameter at breast height, or spatially explicit (Dorren et al., 2006), sim-ulating individual tree hits along a rocks trajectory. Wehrli et al. (2006) conclude that a spatially explicit representation of forest structure would enhance the simulation approach.
Recently Woltjer et al. (2008) developed a spatially ex-plicit 3-D rockfall model and coupled it with the process oriented 3-D forest patch model PICUS v1.4 (Lexer and H¨onninger, 2001; Seidl et al., 2005). In Woltjer et al. (2008) the new rockfall model was tested for parameter sensitivity and for its ability to assess rockfall protection effects in line with static formulations from the literature (Gsteiger, 1993; Brauner et al., 2005). Moreover, the model showed plausi-ble sensitivity to forest management as implemented in the forest model. While the forest model has been evaluated rig-orously in several previous studies (e.g., Seidl et al., 2005, 2009), an evaluation of the rockfall module against empirical data is presented in this article.
The objectives of this study are twofold. First, recent model improvements are introduced, and second, the model is evaluated against empirical rockfall data from four test cases from France, Switzerland and Austria. In an iterative manner results from comparisons of model simulations and evaluation data feed back into model enhancement. Finally, conclusions on the applicability of the model are drawn.
2 Methods and materials 2.1 The forest dynamics model
The forest model used in PICUS Rock’n’Roll is the hybrid forest patch model PICUS v1.4, which incorporates elements of a classical patch model as well as a stand level production model based on physiological principles. A detailed descrip-tion of the hybridizadescrip-tion is provided in Seidl et al. (2005). Here, just a brief overview of the core model concept is given.
Basic modelling entity is the individual tree above a threshold of 1cm diameter at breast height. Tree biomass is arranged horizontally on 10×10 m2patches and vertically in 5 m canopy layers. A three-dimensional light model, al-lowing for the explicit consideration of direct and diffuse radiation within the canopy, is used to model inter- and in-tra tree species competition. The incorporation of a mod-ule that estimates NPP (net primary production) based on the concept of radiation-use efficiency (Landsberg and Waring, 1997) enhanced the robustness in predicting growth along environmental gradients. It also improved the physiological foundation of the model with regard to changing environ-mental conditions. The model requires input of incoming ra-diation, temperature, precipitation and vapor pressure deficit in at least monthly resolution.
2.2 The rockfall model
This contribution focuses on the evaluation of the rock-fall model Rock’n’Roll as presented in detail in Woltjer et al. (2008). This section presents a brief overview of the model concept. The rockfall model simulates spatially ex-plicit trajectories of spherical rocks of variable size (diam-eter, mass) on a three-dimensional slope. A rock trajectory consists of a series of rolling and/or jumping motions. The model uses a lumped mass approach for simulating free fall and ground impacts, and a rigid body approach for the simu-lation of rolling motions and tree impacts. Kinetic energy of a falling boulder is dissipated by (i) rolling friction for rolling motions, (ii) ground impacts for jumping motions, and (iii) tree impacts during rolling and jumping motions.
In a simulation rock trajectories start with a predefined initial velocity either from predefined or from randomly se-lected positions within the simulated area. A rock stops, when its kinetic energy falls to zero.
The slope surface is characterized by coefficients of resti-tution for jumping mode (i.e. rebound parameters) and by rolling friction coefficients for rolling mode. For the cur-rent study the rolling friction coefficient was kept constant at a value of 0.5 which is considered as a sensible default value for various ground types (see Azzoni et al., 1995). Co-efficients of restitution describe the ratio of the normal (or tangential) velocity component of the center of mass before and after an impact (e.g. Kharaz et al., 2001). Parameter val-ues for various surface types are retrieved from the literature (e.g., Azzoni et al., 1995; Azzoni and de Freitas, 1995; Chau et al., 2002; Schweigl et al., 2003; Heidenreich, 2004).
In order to utilize frequently available 2-D trajectories for model validation and calibration a special mode was imple-mented in the rockfall model. Docuimple-mented 2-D trajectories from single rockfall events usually report jump lengths and slope angles along the actual trajectory. In a simulation the rockfall model uses the trajectory profile as slope topography and forces the falling boulder along the profile. Within that “2-D mode” all modeled rockfall processes except tree hits are applicable and energy conservation laws are satisfied.
Rock’n’Roll is implemented in the C++ programming lan-guage. The rockfall model is integrated with the PICUS for-est model and can be invoked every simulated year to assess the effect of vegetation on rockfall activity. The software is optimized for high calculation performance. For instance, the algorithms of rock movement are not based on fixed time steps but rather rely on analytical equations of motion to fos-ter efficient computations.
Based on findings of preliminary model evaluation exer-cises and conceptual limitations of the modeling approach some components have been revised and extended. In the fol-lowing sections these model enhancements are introduced. 2.2.1 Representation of surface topography
A major enhancement compared to the model variant in Woltjer et al. (2008) is that in the current version surface topography is modeled as a triangulated irregular network (TIN). A TIN describes a surface as a set of non-overlapping triangles with variable density. Besides raster based digital elevation models, TINs are frequently used for the represen-tation of three dimensional surfaces, and modern GIS soft-ware packages usually support the conversion from raster based digital elevation models (DEM) to TINs and vice versa. While the vast majority of all available rockfall mod-els use raster based DEM, we implemented a TIN-based ap-proach. Reasons for the decision to use TINs are, inter alia, that the variable density of triangles allows a memory and time efficient computation of slope regions with more uni-form terrain features, and that the flexible spatial resolution of a TIN is easier to couple with the fixed 10×10 m patch size of the forest model.
The spatial distribution of different surface properties, e.g. coefficients of restitution, is incorporated in the model by us-ing a raster based approach. Surface properties are mapped in a GIS environment using arbitrarily shaped polygons which are imported as grids into the coupled rockfall-forest model. 2.2.2 Tree hits
In the original model variant the algorithm for the simulation of tree hits was designed as a set of mechanical and geomet-rical formulations based on fracture energy experiments in the laboratory. However, in reality a rock impacting a tree triggers far more energy-consuming processes, like defor-mation of the root-soil system or the swaying of the whole
tree. Recently published empirical data on that issue (Dorren and Berger, 2006) and results from a numerical tree impact model (Jonsson, 2007) allow the implicit inclusion of these processes.
Our implementation of the tree hit algorithm is very close to the published model of Dorren et al. (2005; see also Dor-ren and Berger, 2006). The maximum amount of energy that can be dissipated by a tree during an impact (Ediss,max)
de-pends on tree species and is related to the diameter of the tree at breast height via an exponential relationship (Eq. 1).
Ediss,max=38.7 DBH2.31 (1)
Ediss,max= Energy dissipation potential for Abies alba trees
[kJ]. See Dorren et al. (2005) for coefficients of further tree species. DBH = diameter at breast height [cm].
For impact positions off the central bole axis only a frac-tion of the dissipafrac-tion potential is exploited. This is ex-pressed by a sigmoid function relating the consumable frac-tion of the dissipafrac-tion potential to the impact posifrac-tion. If the kinetic energy of a rock during a frontal impact is higher than the dissipation potential, the tree breaks.
The horizontal deviation of the rock after the tree hit is modeled by deviation matrices, which define deviation ranges for three different impact types (frontal, lateral and scratch). Within this range a random number determines the realized deviation angle. For situations where the energy of the falling rock is high compared to the energy dissipation potential of the tree an additional upper deviation limit avoids unrealistic deviation angles. This limit is estimated as the hy-pothetical maximum deviation of the rocks’ trajectory given the energy dissipation potential of the focal tree.
2.3 Data
2.3.1 Real-size rockfall experiments Vaujany
From 2001 to 2003 real-size rockfall experiments have been realized on a forested and an adjoining unforested test slope in the Forˆet Communale de Vaujany in France and have been described in detail in several publications (Dorren et al., 2005, 2006; Bourrier et al., 2009). Here we briefly in-troduce the experimental setup. The test sites are located on a post-glacially developed talus cone, which mainly con-sists of rock avalanche, snow avalanche and rockfall deposits and is situated on altitudes ranging from 1200 m to 1400 m (a.s.l.) with a mean slope gradient of 38◦. A digital elevation model with a resolution of 2.5×2.5 m was available for both sites and surface characteristics (diameters of rocks covering the slope, etc.) were grouped into surface types and mapped throughout the test slopes (see Table 1).
0 50 100 150 200 250 300 Planimetric distance from release point [m] 1150
1200 1250 1300 1350
forest road
forest road
Upper part Lower part Section B Section C forested Site 2 unforested Site 1
(Camera positions)
0 50 100 150 200 250 300 350 400 Planimetric distance from release point [m] 1110
1160 1210 1260 1310 1360
Al
titu
de
[m
]
forest road
forest road
Upper part Lower part Section B Section C (Camera positions)
max. runout
max. runout
Fig. 1. Profiles of the test sites in Vaujany starting from the release points of the rockfall experiments along the steepest path. Left: unforested
Site 1, right: forested Site 2. The camera equipped test sections extend from the top of the slope down to the upper forest road. The observed run-out zones extend further (maxima indicated by triangles).
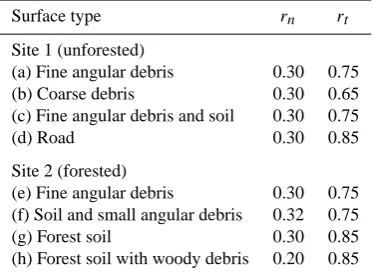
Table 1. Coefficients of restitution (rn= normal, rt = tangential
coefficient) used in the simulation series for the Vaujany sites.
Surface type rn rt
Site 1 (unforested)
(a) Fine angular debris 0.30 0.75 (b) Coarse debris 0.30 0.65 (c) Fine angular debris and soil 0.30 0.75
(d) Road 0.30 0.85
Site 2 (forested)
(e) Fine angular debris 0.30 0.75 (f) Soil and small angular debris 0.32 0.75 (g) Forest soil 0.30 0.85 (h) Forest soil with woody debris 0.20 0.85
The first section after release is mainly covered by debris with diameters of 8–10 cm (type (a) in Table 1), Section B is dominated by bigger blocks between 40 and 80 cm (type (b) in Table 1) while Section C is covered by fine debris and soil material (type (c) in Table 1).
The forested Site 2 represents a typical rockfall slope in the European Alps (see Fig. 1). The main tree species with regard to basal area are Silver fir (Abies alba, 72%), beech (Fagus sylvatica – 14%), Norway spruce (Picea abies (L.)
Karst. – 6%), and Sycamore (Acer pseudoplatanus L. – 6%).
The stand is characterized by a mean tree diameter at breast height of 31 cm and a stand density of 290 trees per hectare. The coordinates of each tree on Site 2 were mapped. In the upper half of the slope at Site 2 the spatial variability (i.e. patchiness) of the main surface types (e) and (f) (compare Table 1) was considerably higher compared to Site 1.
A total of 218 rocks with a mean diameter of 0.95 m (mean volume=0.49 m3, S.D.=0.3 m3) were released individually by an excavator from a forest road. Three-dimensional rock trajectories were captured by combined field measurements
and video analysis. Rock velocities and rebound heights were calculated by a frame-per-frame video analysis.
For the model evaluation mean and maximum of rock ve-locities and rebound heights were available at both sites. The data set further included the distribution of run out distances (ROD) and the jump lengths near the camera positions at both sites (see Fig. 1). For Site 1 the data set was extended by rebound heights and velocities of individual jumps near the cameras, for Site 2 also the distribution of the heights of tree hits on the bole was available.
2.3.2 Single 2-D rockfall trajectories in Steg and Bad Ischl
In addition to the Vaujany data set we used two rockfall tra-jectories of real rockfall events for model evaluation (Berger et al., 2004). In both cases a 2-D-profile was derived by sur-veying impact craters of single rockfall events. Addition-ally, the starting points of the two rockfall trajectories were identified and the size and mass of the rocks were measured. The first trajectory was recorded in Steg, Switzerland, after a rockfall event in March 2003 on a slope with an average incli-nation of 31◦. The rock had a diameter of 1.84 m and a mass of 9100 kg and stopped after 37 ground impacts and 441 m (planimetric) run out distance. The slope is mainly covered by pasture and is crossed by a road and a narrow rock out-crop. The surveyed data includes qualitative characterization of surface properties along the whole trajectory (see Fig. 2 and Table 2). In Bad Ischl, Austria, in summer 2004 a rock with a diameter of 0.96 m and a mass of 1250 kg hit and dam-aged a rockfall net protecting a parking lot. Here, the slope with an average inclination of 40◦is covered by sparse
0 50 100 150 200 250 300
0 100 200 300 400 500
he
igh
t [m
]
stopping point 0 50 100 150 200
0 50 100 150 200 250
rockfall net
he
igh
t [m
]
planimetric distance from starting point [m] planimetric distance from start [m]
(c) (d) (g) (h) (g) (b) (g) (a) (d) (f) (e) (f) (d)
Fig. 2. Slope profiles in Steg (left) and Bad Ischl (right). The lowercase characters denote the surface types presented in Table 2.
2.4 Model validation 2.4.1 Test site Vaujany
The coefficients of restitution for each surface type from the Vaujany test sites were extracted from the literature (e.g., Az-zoni et al., 1995; AzAz-zoni and de Freitas, 1995; Chau et al., 2002; Schweigl et al., 2003; Heidenreich, 2004) (Table 1). To mimic the release of the rocks from the shovel of the exca-vator in the simulations the rocks were started from a height of 1.5 m above ground with a speed of 3 ms−1and an angle of−30◦(relative to the horizon).
To account for differences in the shape of the rocks we varied the tangential coefficient of restitutionrtrandomly by
adding a value from the range [−0.05 to 0.05] assuming a uniform probability distribution. An independent stochastic variation of both coefficients may lead to unrealistic jump angles. Due to lacking information on a possible cross cor-relation betweenrt andrn we decided to vary onlyrt due
to its higher relevance for the calculation steps during rock rebounds.
To achieve statistically robust results two different simula-tion series were run: (i) a total of 10 000 rocks with a diam-eter of 0.95 m were released from the original starting point, and (ii) to gain insight into the variability of extreme values a series of 100 simulations, each consisting of 100 rocks with a diameter of 0.95 m, were also performed.
For the forested Site 2 we used the measured trees on their mapped positions as well as tree species, diameter and tree height. For the simulation series the dynamic components of the forest model were deactivated. Contrary to the in situ ex-periment, where the forest structure changed potentially with every released rock, simulated rocks always faced the same trees. For each simulated rockfall trajectory mean, minimum and maximum velocity, rebound heights, jump lengths, tree contacts as well as run out distance were recorded and com-pared to experimental data.
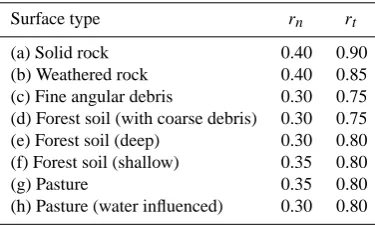
Table 2. Coefficients of restitution (rn = normal,rt = tangential)
used in the 2-D simulation series Steg and Bad Ischl.
Surface type rn rt
(a) Solid rock 0.40 0.90
(b) Weathered rock 0.40 0.85 (c) Fine angular debris 0.30 0.75 (d) Forest soil (with coarse debris) 0.30 0.75 (e) Forest soil (deep) 0.30 0.80 (f) Forest soil (shallow) 0.35 0.80
(g) Pasture 0.35 0.80
(h) Pasture (water influenced) 0.30 0.80
2.4.2 2-D trajectories in Steg and Bad Ischl
For the simulation of the 2-dimensional trajectories, the rock-fall model was operated in “2-D”-mode, where the trajecto-ries of the simulated rocks are forced along the slope profile. Also the tree hit module was disengaged because no tree hits occurred along the trajectories.
Quantitative coefficients of restitution were assigned to each mapped surface cover type along the trajectories using information from in situ field tests on representative ground materials from the literature (Azzoni et al., 1995; Azzoni and de Freitas, 1995; Schweigl et al., 2003; Heidenreich, 2004). Due to missing information about the exact starting condi-tions all trajectories were initiated in rolling mode with a ve-locity of 1 ms−1.
Jump length (Site 1)
0 5 10 15 20 25
Observed
Ju
m
p
len
gt
h
[m
p
lan
im
et
ric
]
Jump length (Site 2)
0 5 10 15 20 25
Observed
Ju
m
p
len
gt
h
[m
p
lan
im
et
ric
]
Rebound length and height on upper part of slope (Site 1 and 2) Height of tree hits (Site 2) Rebound length and height on lower part of slope (Site 1 and 2)
Rebound height (Site 1)
0 1 2 3 4 5
Observed Simulated
(improved) Simulated (initial)
Re
bo
un
d
he
igh
t [
m
]
Observed
He
igh
t o
f t
re
e
hit
s [
m
]
Height of tree hits (Site 2)
0 1 2 3 4 5
Simulated
(improved) Simulated (initial) Simulated
(improved) Simulated (initial) (improved)Simulated Simulated (initial)
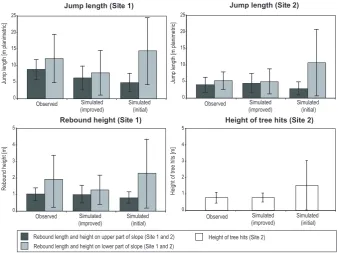
Fig. 3. Comparison of observed and simulated (initial, improved) rockfall parameters from both experimental sites in Vaujany. Jump lengths
and rebound heights are taken from the upper and the lower part of the slope near the camera positions, height of tree hits from the entire slope at Site 2. Shown are mean values and standard deviation of 100 simulated rocks with 100 replicates each.
3 Results
3.1 Initial simulation runs in Vaujany
Simulations were run at both sites in Vaujany according to the setup described in Sect. 2.3.1 with the initial model ver-sion. A first inspection of simulated and observed rockfall parameters yielded the following results: for both sites in the upper part of the slope (labelled as “upper part” in Fig. 1) the jump lengths were generally too low whereas in the lower parts of the slope jump lengths were clearly overestimated at both sites with regard to both mean values and variabil-ity (Fig. 3; upper panel). The deviation between observed and simulated rebound height was smaller (Fig. 3; lower panel), but with a similar tendency to underestimate on the upper slope and overestimate in the lower parts of the slope. That simulated rebound heights were partly overestimated was also confirmed by the simulated heights of tree hits at Site 2 (Fig. 3). Furthermore, the simulated maximum values for rebound heights and rock velocities were found too high (not shown).
In addition, the distribution of the run out distances (ROD) differed substantially from observations at both sites (Fig. 4). Based on these findings the rebound algorithm, one of the central modules of the rockfall model (i.e. the calculation of energy dissipation during a ground contact and the re-sulting jump angles after ground contact), was re-analysed. The current model version (Woltjer et al., 2008) treats the
re-bound process as an inelastic point contact based on impulse-momentum law. It is well known that this is a somewhat unrealistic and oversimplifying assumption, nevertheless this approach is frequently used in rockfall models (e.g. Stevens, 1998; Guzzetti et al., 2002; Dorren et al., 2004).
When applying repeatedly the current jump-rebound mod-ule on a simplified slope with a constant slope angle and con-stant coefficients of restitution the rock velocity increases or decreases exponentially (Eq. 2). The actual values of the ve-locity increment or decrement per jump-impact cyclefgain
mainly depends on slope angle and the values of the specific coefficients of restitution.
vi+1 vi
=fgain=const (2)
fgain= relative gain/loss in velocity per jump [−],vi=
start-ing velocity of the ith jump [ms−1].
The velocity reached at thei-th jump is proportional to
fgain raised to the power ofi (Eq. 3). Maximum rebound
Simulated (improved rebound algorithm, without rockstop submodule) Observed
300 250 200 150 100 50 0
planimetric distance from starting point [m]
0% 20% 40% 60% 80% 100%
450 400 350 300 250 200 150 100 50 0 0% 20% 40% 60% 80% 100%
planimetric distance from starting point [m]
Section A Section B Section C
%
o
f r
oc
ks
re
ac
hin
g
dis
ta
nc
e
Simulated (initial simulation runs) Simulated (improved rebound algorithm, rockstop submodule)
Fig. 4. Percentage of rocks that reach a certain distance at the unforested Site 1 (left) and forested Site 2 (right) in Vaujany. The filled area
denotes the observed values, the bold line shows the simulation results (N=10 000 rocks) of the final model version. The dash-dot lines indicates the initial simulation runs, the dashed lines results with improved rebound algorithm but without the rockstop submodule.
vi∼fgaini (3)
Hi∼fgain2·i (4)
Di∼fgain2·i (5)
vi= starting velocity of thei-th jump,fgain= relative velocity
gain/loss per jump [−], Hi = rebound height fori-th jump
[m],Di= jump length (planimetric) fori-th jump [m].
However, this is in contrast to empirical evidence about real rockfall trajectories. For instance, on steep sites rocks typically gain energy very quickly and reach maximum ve-locity after a short distance (e.g. Dorren et al., 2005; Jahn, 1988). Furthermore, reported rebound heights usually do not exceed 2 m to 4 m while simulated rebound heights are much higher (e.g. Dorren and Berger, 2006; Stoffel et al., 2006; see also Fig. 3). Re-inspection of the model formulations fo-cused on the amount of energy that is lost during rebound. Conceptually, the loss depends on the characteristics of the contact process itself and the amount of energy gain during the flight phase, which in turn is strongly influenced by the jump angle after rebound.
The rebound process is characterized as an elasto-plastic contact in many studies (e.g., Pfeiffer and Bowen, 1989), with elastic boulder response and plastic deformation of softer ground material. Johnson (1985) proposed to extend the widely applied point-like contact concept to plastic reac-tion by reducing the coefficients of restitureac-tion with increasing velocity proportional tov(−0.25)to account for deformation work, elastic wave propagation and fracturing during impact (Eq. 6).
r=k·v−
1
4 (6)
r= coefficients of restitution (normal and tangential) [−],k
= scaling factor [−],v= impact velocity [ms−1].
This relationship is supported by investigations of elasto-plastic contact reaction (Wu et al., 2003, 2005; Hayakawa and Kuninaka, 2003; Heidenreich, 2004). Similar relation-ships are also found in studies based on field data from rock slopes (Wu, 1985; Pfeiffer and Bowen, 1989; Pfeiffer et al., 1993). The model extension by Johnson (1985) results in increased energy dissipation at high velocities, which is in agreement with field observations (e.g. Dorren et al., 2005; Jahn, 1988). However, rock velocity does not affect the jump angle after impact. Pfeiffer and Bowen (1989) and Pfeiffer et al. (1993) developed separate scaling factors forrn and rt from field data causing both coefficients of restitution to
decrease with increasing impact velocity. This concept re-sults in both a pronounced energy dissipation and slightly lower jump angles at high impact velocities. This is in ac-cordance with Zinggeler (1989) and Heidenreich (2004) who found for elasto-plastic contacts no strict geometric relation-ship between impact and jump angles due to various influen-tial factors such as friction or material strength.
3.2 Model improvement 3.2.1 Rebound algorithm
Based on the analysis of the original rebound model as pre-sented above the contact model was extended following the proposal by Johnson (1985) as it refers to velocity as the most influential parameter of the jump-rebound cycle (Eq. 6). Generally, this approach is supported by many studies over various materials and settings (Wu, 1985; Wu et al., 2003, 2005; Hayakawa and Kuninaka, 2003; Heidenreich, 2004).
10 ms−1or below (Broili, 1973; Azzoni and de Freitas, 1995; Chau et al., 2002).
r=
(
v <=10 ms−1:rliterature v >10 ms−1:k·v−14
(7)
k=rliterature·10 1
4 (8)
rliterature= reported coefficient of restitution in literature
(tan-gential and normal); see Tables 1 and 2 [−],r= resulting co-efficient of restitution (tangential and normal) [−],k= linear factor,v=impact velocity [ms−1].
Furthermore, the calculation of jump angles after rebound was modified. The analysis of the jump-rebound cycle al-ready indicated that the geometric approach to calculate the jump angle may not be sufficient to reliably represent the complex processes during actual rebounds. The real-size rockfall experiments from Vaujany provided data on rock ve-locity after rebound and rebound height for a series of indi-vidual jumps on the upper slope of the unforested Site 1. Us-ing this information for each of these jumps the jump angle after rebound was back-calculated. A power function (Eq. 9) was fitted to back-calculated rebound angle and rock velocity data (compare Fig. 5).
The updated rebound model uses this relationship to cal-culate the jump angles after each rebound. This approach aims at providing realistic jump angles while preserving the ability to consider the dampening characteristics of different surface types via the coefficients of restitution.
αslope=k·v0f (9)
αslope= jump angle after rebound (relative to slope) [◦],v0=
velocity just after rebound [ms−1],f = empirical exponent [−0.74],k= empirical factor [80].
After implementing these modifications a second set of simulations were run. Simulated velocities and rebound heights, as well as the distribution of jump lengths were much closer to observed values. However, the simulated dis-tribution of run-out distances deviated still substantially from observations (Fig. 4). Particularly the high frequency of stops in the middle section of the unforested Site 1 in Vaujany (Sec-tion B in Fig. 1) was still not satisfactorily captured by the improved model. This section, where almost one third of the rocks stopped despite high rock velocities, is characterized by the presence of debris large enough to act as obstacles. We concluded that rocks are stopped randomly by obstacles on the surface, a process which is not accounted for by the standard rebound algorithm.
3.2.2 Stopping algorithm
The hypothesis in improving model behavior was that the probability for rock stops at high velocities depends on the relation of (i) the size and distribution of obstacles on the surface of a given surface type and (ii) the size of the falling
y = 79.998x-0.7412
(R2 = 0.22)
0 5 10 15 20 25 30 35 40 45 50
2.00 6.00 10.00 14.00 18.00
rock velocity just after rebound [m/s]
re
bo
un
d
an
gle
re
lat
ive
to
sl
op
e
[°]
measured rocks regression
Fig. 5. Relationship of rebound angle and velocity just after
re-bound for 63 recorded rere-bounds on the unforested Site 1 in Vaujany.
rock. To establish such relationships we developed a sepa-rate software module external to the PICUS model and ran a large number of simulations of boulder impacts on virtual surfaces of block deposits. The virtual surface of block de-posits is generated by imitating a natural deposition process where added blocks tend to accumulate at already present deposits. The characteristic sizes of the deposited blocks are either pre-defined or drawn randomly from observed rock size distributions. This process roughly resembles a rockfall-related talus generation. After reaching a defined degree of surface coverage the process is stopped (see Fig. 6 for an ex-ample).
Starting with randomly distributed angles between 10◦and 20◦relative to the surface, i.e. a realistic range of impact an-gles for real rockfall events, rocks are thrown from random positions above the surface. A rock is considered “stopped” if an obstacle at the surface is centrally hit. This is the case when the angle between the hit point and the direction vector of the falling rock is below 25◦(Fig. 7). If no obstacle is hit a simplified rebound is simulated assuming equality between incoming and outgoing angle. Finally, the “stopping proba-bility” for a certain combination of surface type and falling rock size is defined as the ratio of stopped to total number of events (Eq. 10).
pstop=
Nstopped Ntotal
(10)
pstop= probability that a rock is stopped during ground
con-tact,Nstopped = number of rocks that were stopped,Ntotal =
total number of rocks thrown onto surface.
During trajectory calculations within the Rock’n’Roll rockfall model Eq. (10) is used to calculatepstop for each
ground impact. If the kinetic energy of a falling boulder exceeds zero, a uniform random numberRrs [0–1] decides
Fig. 6. Visualization of a geerated virtual surface used to calculate
stopping probabilities (Screenshot). Cover percentage of deposited blocks = 30%.
Stopping impact No impact
25°
Fig. 7. 2-D-scheme for calculating the stopping probability of a
rock (indicated by circles) during a single ground contact. The gray arc indicates the sensitive 25◦region for considering a collision as a stop.
ifpstop> Rrs). To that end the macro-roughness of the
gen-erated virtual surface types was visually compared to surface types observed in the field by mapping personnel. First tests yielded promising results and should be corroborated by an extended quantitative comparison of simulated and observed surface roughness in the future.
3.2.3 Vaujany
After implementing the new model algorithms the complete set of simulations was repeated. For 3-D simulations – espe-cially when the forest is considered explicitly – run-out tances are of particular interest. Regarding the simulated dis-tribution of run-out distances the improved model was able to reproduce the observed pattern well (Fig. 4). Especially for the unforested Site 1 the effect of the rockstop submodule is notable for the region between 225 m and 300 m (Section B in Fig. 1). In this section the slope inclination is about 38◦, comparable to the section above, but the surface is covered with bigger blocks resulting in a higher probability of stop-ping impacts.
Table 3 shows that mean and maximum velocities as well as the average number of tree hits as simulated by PICUS Rock’n’Roll match the observations well. While the model only slightly underestimates the average rebound heights, the simulated maximum rebound heights deviate still substan-tially from observed values, especially on the forested Site 2.
0% 10% 20% 30% 40% 50%
12 11 10 9 8 7 6 5 4 3 2 1
Simulated Observed Min-Max-range of 100x100 rock experiment
0
number of tree hits per rock
percentage of rocks
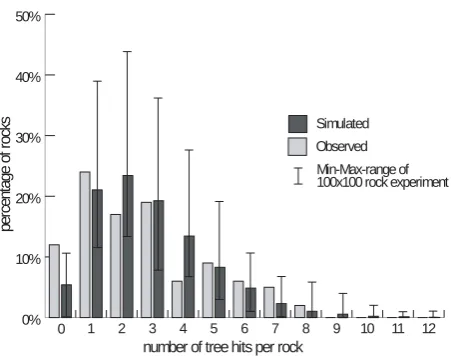
Fig. 8. Observed and simulated frequency of rocks in categories for
“number of tree hits per rock” for the forested Site 2 in Vaujany. The simulated tree hits are represented by the mean value of 10 000 sim-ulated rocks, the error bars indicate the minimum/maximum range of 100 simulated rocks with 100 replicates each.
The average of the maximum rebound heights from 100 rep-etitions of a simulation series with 100 rocks overestimates the maximum rebound height by factor three. However, in the majority of simulations, the maximum rebound heights are substantially lower (see average value and value of the 90th percentile) and extremely high jumps were simulated only on few specific spots along the slope. The general plau-sibility of simulated rebound heights is also indicated by the good match of the height at which trees were hit on Site 2 (Fig. 3, bottom left corner).
Figure 8 shows the distribution of the number of tree hits per rock on the forested Site 2. The error bars indicate the ex-treme values for 100 simulation series with 100 rocks each. The simulated number of rocks that hit only one tree or no tree at all is lower than the observed value, while the num-ber of rocks that hit two to four trees is overestimated by the model. A possible explanation for this deviation is that dur-ing the Vaujany field experiment the forest especially near the starting point was thinned out by previously released rocks, thus reducing the likelihood of early tree hits.
The match of simulated mean and standard deviation of jump lengths for the upper and lower part of the slopes im-proved considerably with the revised model (Fig. 3). Com-pared to results of the original model version the simulated jumps of the updated model in the upper part of the slope are now longer while the jump lengths in the downslope sections are shorter and exhibit less variation (Fig. 3).
3.3 2-D trajectories in Steg and Bad Ischl
Table 3. Summary of observed and simulated (with improved rebound algorithm) rockfall parameters for both sites in Vaujany. The columns
denoted withN=100×100 present the mean and standard deviation of 100 simulation series with 100 rocks each.
Site 1 (unforested) Site 2 (forested)
Parameter Unit Observed Simulated Simulated Observed Simulated Simulated N=100 N=10 000 N=100×100 N=100 N=10 000 N=100×100
average of maximum ms−1 15.4 17.3 17.2±0.57 11.7 12.9 12.8±0.34 trajectory velocities
90th percentile of max. ms−1 – 25.5 25.1±0.84 – 17.1 17.1±0.81 trajectory velocities
maximum velocity ms−1 30.6 32.7 29.5±1.24 24.2 29.5 23.1±1.95
mean velocity ms−1 11 9.4 9.6±1.5 8 6.8 6.7±1.2
mean number of tree – – – – 2.8 2.8 2.9±0.19
hits per falling rock
maximum rebound m 8 13.8 10.33±1.27 2 7.9 5.8±1.05
height
90th percentile of m – 6.4 6.5±0.6 – 2.2 2.1±0.4
max. rebound heights
mean rebound height m 1.5 1.2 1.1±0.2 1 0.8 0.8±0.2
0 5 10 15 20 25 30 35 40 45
0 100 200 300 400 500
planimetric distance from starting point [m]
jum
p l
en
gt
h [
m]
planimetric distance from start [m]
jum
p l
en
gt
h [
m]
0 5 10 15 20 25 30 35
0 50 100 150 200 250
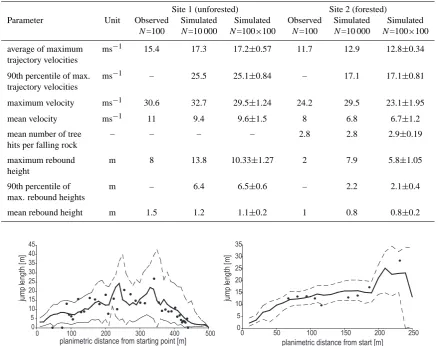
Fig. 9. Simulated and observed jump lengths for the profiles in Steg (left) and Bad Ischl (right). Dots denote observed jump lengths. The
bold line indicates mean jump length and the dashed line the minimum and maximum jump length of 10 000 simulations.
deviation) is in agreement with the observed value of 441 m. In Bad Ischl more than 99.9% of the simulated rocks reach the rockfall net with an average kinetic energy of 349 kJ±132 kJ (90th percentile=570 kJ). Keeping in mind the stochastic nature of observed jump lengths resulting from a singular rockfall event, the observed jump lengths fit well within the distribution of simulated jump lengths (see Fig. 9).
4 Discussion
In this paper a comprehensive model validation experiment with a 3-D rockfall and forest model was presented. Focus of the validation was on the rockfall model. The study fea-tures an iterative cycle of testing and improving the model (e.g. Vanclay and Skovsgaard, 1997). A first set of simula-tion runs at the sites in Vaujany indicated major deficiencies of the initial model version with regard to simulated rock
current study the relationship of velocity and the coefficients of restitution is the same for all surface types.
Additionally, an empirical relationship to estimate jump angles after rebound was derived. This modification resulted in a more realistic model behavior but also in a weakened physical foundation of the rebound algorithm. We used spe-cific data from one of the Vaujany experimental sites itself, thus rendering the Vaujany data no longer an entirely inde-pendent data set for model evaluation. However, detailed empirical data on rockfall processes is sparse, and excluding the Vaujany data from model development deemed unduly restrictive. We are aware that the empirical relationship of velocity and jump angle based on limited data from one spe-cific site is not a generally valid relationship. However, the modified model variant combining Johnson’s approach with the empirical relationship worked well for both sites in Vau-jany as well as for the two trajectories in Steg and Bad Ischl. Considering the quite diverse conditions represented by these four sites we conclude that the chosen approach has some potential which should be further explored. More empirical data on individual jumps from different surface types are re-quired to test the generality of the approach and to provide insight into the sensitivity of simulated trajectories to vari-ation in the rebound algorithm. In general, the necessity to calibrate rockfall models for each individual site and applica-tion may severely hamper model applicability. For instance, for assessments at larger scales such calibration procedures are very likely not feasible due to missing calibration data, thus calling for generalizable approaches.
A major model improvement was the implementation of a probabilistic stopping algorithm for falling rocks. Based on a conceptual model of the interaction of a falling rocks with boulder obstacles on the ground virtual data were generated with an external software module to derive a general meta model of the process. The advantage of the presented ap-proach is that the virtual surface types used to establish stop-ping probabilities for falling boulders of specific size can be compared to surface types used for site mapping activities. Thus, a direct link can be established between input parame-ters used in generating the virtual surface types and observ-able data (e.g., block cover percentage, size distribution of deposited blocks).
Generally, the updated model showed good agreement with observed rockfall parameters, particularly with regard to rock velocities, jump length and run-out distances. Worth-while to note is the persistent overestimation of maximum rebound heights for the Vaujany simulations despite the rel-atively small range of additionally applied variability in the tangential coefficient of restitutionrt. However, especially
on the forested Site 2 large rebound heights occurred on only few spots along the slope. A possible reason is that Rock’n’Roll calculates jump angles relative to the slope an-gle at the impact point. Large rebound heights can thus arise from an overestimated variability of the inclinations along the slope as a result from artifacts of the digital elevation
model (Agliardi and Crosta, 2003) or the transformation to a TIN. A possible further model extension would be the con-sideration of soft impact with penetration of the boulder into the ground on loose soils and scree deposits. This feature could be implemented by smoothing the point inclinations along an estimated contact zone.
Both single event 2-D trajectories were contained within the range of simulated stochastic outcomes. Compared to comprehensive 3-D data sets as available in Vaujany, 2-D profiles from post-hoc analysis of individual rockfall trajec-tories provide less opportunity to explore and validate model behavior. However, they proved to be a readily available and efficient complementary element in our model evaluation.
In the presented validation experiments the forest dynam-ics model was deactivated as the rockfall processes featured in the evaluation data took place within one time step of the forest model. As already outlined in Woltjer et al. (2008) a fully coupled forest and rockfall model with feedback of rock hits on the vitality and subsequently stability and mor-tality risk of trees is conceptually possible within this frame-work. Based on data of the Austrian National Forest In-ventory Vospernik (2002), for instance, showed that Norway spruce trees with rockfall wounds had an increased proba-bility of death. However, rock fall frequency as a prereq-uisite for such an approach cannot be readily inferred from standard data sources, limiting a fully coupled simulation ap-proach.
5 Conclusions
The current model version produces reliable results over a wide array of conditions for rockfall processes as well as for forest dynamics (e.g. Seidl et al., 2008, 2005). It can thus be applied to analyze protective effect of forest vegetation over time periods of several decades under natural forest develop-ment or different forest managedevelop-ment regimes. The rockfall model itself is designed for high computing performance and is able to calculate approx. 1000 trajectories per second (us-ing standard hardware from 2007) which allows to efficiently extend the spatial scale of application. The coupled rockfall and forest model can simulate an area of about 40 hectares which is sufficient for most protection forest management projects. The evaluation results presented in this contribu-tion generally support the approach and increase the credi-bility of the rockfall module. Hence, we are confident that the presented model can be used for operational assessments of the protective function of forests against rockfall.
Acknowledgements. We are grateful to three anonymous referees and the guest editor for their critical but valuable comments and suggestions which greatly helped to improve earlier drafts of this manuscript.
Edited by: K. Schellenberg
References
Agliardi, F. and Crosta, G. B.: High resolution three-dimensional numerical modelling of rockfalls, Int. J. Rock Mech. Mining Sci., 40, 455–471, 2003.
Azzoni, A., La Barbera, G., and Zaninetti, A.: Analysis and predic-tion of rockfalls using a mathematical model, Int. J. Rock. Min. Sci Geomech. Abstr., 32, 709–724, 1995.
Azzoni, A. and de Freitas, M. H.: Experimentally gained param-eters, decisive for rock fall analysis, Rock Mech. Rock Eng., 28(2), 111–124, 1995.
Berger, F., Corominas, J., Lopez Carreras, C., Brauner, M., Kien-holz, H., and Bartelt, P.: ROCKFOR Project – Final Report QLK5 – CT – 2000-01302, Cemagref, Grenoble, 2004. Berger, F. and Dorren, L. K. A.: Principles of the tool Rockfor.NET
for quantifying the rockfall hazard below a protection forest, Schweiz. Z. Forstw., 158, 157–165, 2007.
BFW: ¨Osterreichische Waldinventur 2000/02 – Hauptergebnisse, BWF Praxis Information Nr. 3, 2004.
Bigot, C., Dorren, L. K. A., and Berger, F.: Quantifying the pro-tective function of a forest against rockfall for past, present and future scenarios using two modelling approaches, Nat Hazards, 49, 99–111, doi:10.1007/s11069-008-9280-0, 2009.
Bourrier, F., Dorren, L. K. A., Nicot, F., Berger, F., and Darve, F.: Toward objective rockfall trajectory simulation using a stochastic impact model, Geomorphology, 110, 68–79, 2009.
Bozzolo, D. and Pamini, R.: Simulation of rock falls down a valley side, Acta Mechanica, 63, 113–130, 1986.
Brauner, M., Weinmeister, W., Agner, A., Vospernik, S., and Hoesle, B.: Forest management decision support for evaluating forest protection effects against rockfall, Forest Ecol. Manag., 207, 75–85, 2005.
Broili, L.: In situ tests for the study of rockfall, Geologia Applicata e Idrogeologica, 8(1), 105–111, 1973.
Chau, K. T., Wong, R. H. C., and Wu, J. J.: Coefficient of restitution and rotational motions of rockfall impacts, Int. J. Rock Mech. Mining Sci., 39, 69–77, 2002.
Dorren, L. K. A., Maier, B., Putters, U. S., and Seijmonsbergen, A. C.: Combining field and modelling techniques to assess rockfall dynamics on a protection forest hillslope in the European Alps, Geomorphology, 57, 151–167, 2004.
Dorren, L. K. A., Berger, F., Le Hir, C., Mermin, E., and Tardif, P.: Mechanisms, effects and management implications of rockfall in forests, Forest Ecol.Manage., 215(1–3), 183–195, 2005. Dorren, L. K. A., Berger, F., and Putters, U. S.: Real-size
ex-periments and 3-D simulation of rockfall on forested and non-forested slopes, Nat. Hazards Earth Syst. Sci., 6, 145–153, 2006, http://www.nat-hazards-earth-syst-sci.net/6/145/2006/.
Dorren, L. K. A. and Berger, F.: Stem breakage of trees and en-ergy dissipation during rockfall impacts, Tree Physiol., 26, 63– 71, 2006.
Gsteiger, P.: Steinschlagschutzwald: Ein Betrag zur Abgrenzung, Beurteilung und Bewirtschaftung, Schweiz. . f¨ur Forstwesen, 144(2), 115–132, 1993.
Guzzetti, F., Crosta, G., Detti, R., and Agliardi, F.: Stone: a com-puter program for the three-dimensional simulation of rock-falls, Comput. Geosci., 28, 1079–1093, 2002.
Hayakawa, H. and Kuninaka, H.: Theory of the inelastic impact of elastic materials, Department of Physics, Yoshida-south campus, Kyoto University, Kyoto, Department of Physics, Yoshida-south
campus, Grant No. 15540393, Ministry of Education, Science and Culture, Japan, 2003.
Heidenreich, B.: Small- and half-scale experimental studies of rockfall impacts on sandy slopes, Th`ese NO 3059, ´Ecole Poly-technique F´ed´erale De Lausanne, 2004.
Jahn, J.: Entwaldung und Steinschlag, International Congress Inter-praevent, Graz Conf. Proc., 1, 185–198, 1988.
Johnson K. L.: Contact Mechanics, Cambridge University Press, 1985.
Jonsson, M. J. O.: Energy absorption of trees in a rockfall protection forest, Diss. ETH Zuerich No. 17214, 266 pp., 2007.
Kharaz, A. H., Gorham, D. A., and Salman, A. D.: An experimental study of the elastic rebound of spheres, Powder Technol., 120, 281–291, 2001.
Lan, H., Martin, C. D., and Lim, C. H.: RockFall analyst: A GIS extension for three-dimensional and spatially distributed rockfall hazard modeling, Comput. Geosci., 33, 262–279, 2006. Landsberg, J. J. and Waring, R. H.: A generalized model of
for-est productivity using simplified concepts of radiation-use effi-ciency, carbon balance and partitioning, Forest Ecol. Manag., 95, 209–228, 1997.
Lexer, M. J. and H¨onninger, K.: A modified 3-D-patch model for spatially explicit simulation of vegetation composition in hetero-geneous landscapes, Forest Ecol. Manag., 144, 43–65, 2001. Ott, E., Frehner, M., Frey, H., and L¨uscher, P.: Gebirgsnadelw¨alder:
Ein Praxisorientierter Leitfaden f¨ur eine Standortgerechte Wald-behandlung, Paul Haupt Verlag, Bern, 287 pp., 1997.
Pfeiffer, T. J. and Bowen, T. D.: Computer simulation of rockfalls, Assoc. Eng. Geol., 26, 135–146, 1989.
Pfeiffer, T. J., Higgins, J. D., Andrew, R. D., Barrett, R. K., and Beck, R. B.: Colorado Rockfall Simulation Program-users man-ual for version 3.0. Colorado Department of Transportation, Re-port No. CDOT-DTD-ED3-CS-2B, 66 pp., 1993.
Schweigl, J., Ferretti, C., and Noessing, L.: Geotechnical character-ization and rockfall simulation of a slope: a practical case study from South Tyrol (Italy), Eng. Geol., 67, 281–296, 2003. Seidl, R., Lexer, M. J., J¨ager, D., and H¨onninger, K.: Evaluating the
accuracy and generality of a hybrid patch model, Tree Phys., 25, 939–951, 2005.
Seidl, R., Rammer, W., Lasch, P., Badeck, F. W., and Lexer, M. J.: Does conversion of even-aged, secondary coniferous forests affect carbon sequestration? A simulation study under changing environmental conditions, Silva Fenn, 42, 369–386, 2008. Seidl, R., Rammer, W., and Lexer, M. J.: Sch¨atzung
von Bodenmerkmalen und Modellparametern f¨ur die Wald¨okosystemsimulation auf Basis von Großrauminven-turen, Allg. Forest J., ISSN 0002-5852, 2009.
Selby, M. J.: Hillslope material and processes. Oxford Univ. Press, 359 pp., 1995.
Stevens, W.: RocFall: a tool for probabilistic analysis, design of remedial measures and prediction of rockfalls. M.A.Sc. Thesis, Dep. Of Civil Engineering, Univ. of Toronto, Ontario, Canada, 105 pp., 1998.
Stoffel, M., Wehrli, A., K¨uhne, R., Dorren, L. K. A., Perret, S., and Kienholz, H.: Assessing the protective effect of mountain forests against rockfall using a 3-D simulation model, Forest Ecol. Manag., 225, 113–122, 2006.
Vospernik, S.: Predicting forest growth against rockfall, Final re-port, Institute of Forest Growth and Yield, University of Agricul-tural Sciences, Vienna, 72 pp., 2002.
Wehrli, A., Dorren, L. K. A., Berger, F., Zingg, A., Schoeneberger, W., and Brang, P.: Modelling long-term effects of forest dynam-ics on the protective effect against rockfall, For. Snow. Lands. Res., 80, 57–76, 2006.
Woltjer, M., Rammer, W., Brauner, M., Seidl, R., Mohren, G. M. J., and Lexer, M. J.: Coupling a 3-D patch model and a rockfall module to assess rockfall protection in mountain forests, Envi-ron. Manag., 87, 373–388, 2008.
Wu, S. S.: Rockfall evaluation by computer simulation: transporta-tion research record, Vol. 1031, Washington, DC: Transportatransporta-tion Research Board, 1–5, 1985.
Wu, C. Y., Li, L. Y., and Thornton, C.: Rebound behavior of spheres for plastic impacts, Int. J. Impact Eng., 28, 929–946, 2003. Wu, C. Y., Li, L. Y., and Thornton, C.: Energy dissipation during
normal impact of elastic–plastic spheres, Int. J. Impact Eng., 32, 593–604, 2005.