www.nat-hazards-earth-syst-sci.net/9/1719/2009/ © Author(s) 2009. This work is distributed under the Creative Commons Attribution 3.0 License.
and Earth
System Sciences
Relationship between lightning and model simulated microphysical
parameters over the central and eastern Mediterranean
D. K. Katsanos, K. Lagouvardos, and V. Kotroni
National Observatory of Athens, Institute for Environmental Research and Sustainable Development, Athens, Greece Received: 15 April 2009 – Revised: 4 September 2009 – Accepted: 21 September 2009 – Published: 21 October 2009
Abstract. In this study the relationship between lightning and simulated microphysical parameters of clouds, is exam-ined. In order to investigate such a relationship, a number of cases with significant lightning activity that occurred dur-ing the wet period of the year over the central and eastern Mediterranean have been selected, based on the lightning ac-tivity reported by the ZEUS lighting detection network, op-erated by the National Observatory of Athens. For the same cases, simulations with the non-hydrostatic MM5 model were performed with the aim of reproducing the dynamical and microphysical parameters associated with the weather systems that produced lightning. The analysis showed that the temporal distribution of convective rainfall is not well correlated with that of lightning, while on the contrary, the temporal distribution of the simulated concentrations of solid hydrometeors correlates well with lightning and there is also a general coincidence of their maxima. Further, it was shown that the best correlation was found during the development stage of the storms, while during the decay phase the number of lightning decreases much faster that the simulated concen-trations of solid hydrometeors.
1 Introduction
The Mediterranean Sea, although a relatively small and rather warm body of water, is considered as one of the most important centers of electrical activity in the northern hemi-sphere during the cold period of the year, as this is implied by the studies made by Orville (1981), Christian et al. (1999) and Holt et al. (2001). In more recent studies, Price and Federmesser (2006) based on TRMM satellite data over the Mediterranean, concluded that more than 75% of rain and
Correspondence to: D. K. Katsanos
lightning in the region occur during the period from Octo-ber to March, while more than 90% of the thunderstorms oc-cur over the sea. Furthermore, lightning activity presents its maximum during November, while the maximum of precipi-tation occurs during December. In a recent study, Katsanos et al. (2007a) have shown that during the wet period of the year (e.g. autumn and winter for the area of the Mediterranean) the lightning activity occurs over the maritime area and near the coasts almost delineating the Mediterranean coastline.
In these studies it was shown that low values of bright-ness temperature are associated with lightning activity and therefore this kind of data could be used as proxies for es-timating the possibility of lightning occurrence. Recently Pessi and Businger (2009) showed a very good correlation between satellite estimated convective rainfall, derived by the Precipitation Radar (PR) onboard TRMM that measures at 13.8 GHz and lightning, giving motivation to investigate the possibility of a relationship between those two parameters. Most of the studies that investigate the relationship between convective precipitation and lightning, are devoted to tropi-cal thunderstorms, while there is a lack of such studies over the Mediterranean.
Since satellites can only provide data during their over-pass above a specific area, it is difficult to cover adequately all cases that occur and to study their temporal evolution. As direct measurements of ice content are sparse, this analysis could be based on simulated fields provided by mesoscale at-mospheric numerical models, as discussed in the following section. Such an approach was recently used by Lagouvar-dos and Kotroni (2007) concluding that spaceborne measure-ments can be used for the observation of mid-latitude weather systems as well as for the validation of high resolution model results.
The rest of the paper is organized as follows: Sect. 2 presents the data and the methodology used, while Sect. 3 discusses the comparison between MM5 model simulated fields and lightning activity. Section 4 is devoted to the con-cluding remarks and prospects of this study.
2 Data and methodology
2.1 Lightning Data
The analysis and the selection of cases are based on light-ning data provided by the ZEUS network and simulations performed with the non-hydrostatic model MM5. A num-ber of cases, most of them lasting one day, with significant amount of recorded lightning flashes by ZEUS during au-tumn and winter (2005–2008) over the central and eastern Mediterranean, were selected in order to perform the com-parison with the simulated fields by MM5.
The ZEUS long-range lightning detection system, oper-ated by the National Observatory of Athens, is based on de-tection of sferics – the impulsive radio noise emitted by a lightning strike – in the Very Low Frequency (VLF) spec-trum between 7 and 15 kHz. The ZEUS system consists of a network of six VLF receivers located around the periphery of Europe (Birmingham in UK, Roskilde in Denmark, Iasi in Romania, Larnaka in Cyprus, Athens in Greece and Lis-bon in Portugal). Each receiver reports the vertical electric field as a function of time which represents the sferic’s wave-form and includes a time stamp synchronized to GPS time. At each receiver site an identification algorithm is executed
that detects a probable sferics candidate, excludes weak sig-nal and noise and is capable of capturing up to 70 sferics per second. Then the lightning location is retrieved (at the cen-tral station of the network) using the arrival time difference triangulation technique. Further details on ZEUS network are given in Kotroni and Lagouvardos (2008).
The detection efficiency and location error of the ZEUS lightning detection network has been evaluated recently against collocated data provided by the LINET detection net-work (Lagouvardos et al., 2009). The area of comparison was limited over a part of Central-Western Europe, where the dense LINET network can guarantee a high detectability of lightning strokes with location accuracy of the order of a few hundred meters. The analysis showed that the location error of ZEUS was calculated to be∼6.8 km, while the detection efficiency was∼25%, with a characteristic under-prediction during nighttime.
2.2 MM5 model configuration
The MM5 model is a non-hydrostatic, primitive equations model (Dudhia, 1993). Several physical parameterization schemes, are available in the model for the boundary layer, the radiative transfer, the microphysics and the cumulus con-vection. For this study, from the multitude of available schemes the following have been selected: the scheme by Hong and Pan (1996) for the boundary layer, the Kain-Fritsch (1993) for cumulus convection and the Schultz (1995) for explicit microphysics. The last two schemes have been proved to provide the most skillful precipitation forecasts in the eastern Mediterranean (Kotroni and Lagouvardos, 2001). Two domains are used for the model simulations. The coarse domain covers most of Europe, up to 60◦N, North
Africa and the Middle East with a horizontal resolution of 24 km and 220×140 grid points. The inner domain covers a part of the central and eastern Mediterranean with a hor-izontal resolution of 8 km and 220×148 grid points. In the vertical, 31 sigma levels are defined from the surface up to 100 hPa. ECMWF analyses at 0.5 degrees resolution have been used to initialize the model and to nudge the boundaries of the coarse domain during the simulation period.
over the maritime area of central and eastern Mediterranean. The selected days satisfied a criterion of at least 20 000 ob-served lightning flashes over the selected area, during 24 h. Among these ten cases, for six cases the model was able to reproduce well the temporal and spatial evolution of the weather system, in accordance with ZEUS lightning obser-vations. In the following paragraphs two representative cases with heavy rainfall and intense lightning are presented in de-tail, later on, all six cases are discussed. It should be men-tioned that the four remaining cases that are not analyzed in the following have been considered as not successful simula-tions, as they failed to reproduce a convective activity coher-ent (both spatially and temporally) with the observations.
3 Results – discussion
3.1 Case study (a)
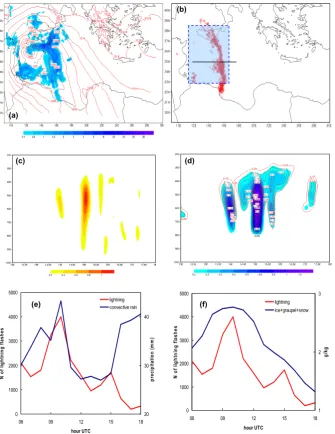
On 13 December 2005 at 06:00 UTC, a barometric low with a central pressure of 1005 hPa was located over the area north-west of the Gulf of Sidra. The pressure low deepened to 997 hPa at 12:00 UTC, and reached the lowest central pres-sure of 992 hPa by the end of the day, just offshore the Tunisian coast. The pressure low was accompanied by a cold front moving slowly northeastwards. Within 24 h an amount of almost 35 000 CG lightning flashes was recorded. The corresponding TRMM overpass showed a band of low Po-larization Corrected Temperature (PCT) values (not shown) expanding from Sicily southwards to the Sidra Gulf denoting the cold front position.
Figure 1a presents the convective precipitation (in mm) with the surface pressure (in hPa), as simulated by the MM5 model inner grid (the domain shown represents the extent of MM5 inner domain with 8-km resolution), at 12:00 UTC. The simulated low pressure centre of 996 hPa is located southwest of Sicily. The model has positioned the low pressure centre almost 1◦to the west of its actual posi-tion. Significant lightning activity was recorded during the event (Fig. 1b). The convective precipitation field shows that rainfall and lightning are present in the same area during the same time period; however convective rain is still forecasted in areas that no lightning activity is recorded. The highest concentrations of simulated solid hydrometeors (not shown) were found shifted to the west of the area where lightning activity was recorded by ZEUS system.
Figure 1c presents the cross section of the vertical veloc-ity (in ms−1) along the 35◦N latitude line and from 12◦E
to 18◦E shown in Fig. 1b. It can be seen that updrafts are present in the same area where also lightning is recorded.
Figure 1d shows the vertical distribution of all ice phase elements (ice + graupel + snow) and only graupel separately across the same line as in Fig. 1c. It is shown that ice parti-cles are present down to relatively low levels (800 hPa), with graupel (black contour line) being the dominant
hydrome-teor at the lower levels of the cloud. Ice on the other hand, is mostly present at the upper levels of the cloud (not shown).
The temporal evolution of the lightning activity with the convective precipitation and ice particle concentrations, are presented in the following. This is done by integrating both fields within a box with dimensions 5◦×5◦including the area from 11◦E to 16◦E and from 33.5◦N to 38.5◦N (denoted with a dotted box in Fig. 1b) in order to account for the “shift” of the simulated fields. Within this box, the num-ber (sum) of lightning flashes was calculated along with the maximum values of convective rainfall and the average pro-file of the integrated mixing ratio of ice+graupel+snow, de-rived from the MM5 simulations.
The results concerning the comparison between convec-tive precipitation and lightning, are shown in Fig. 1e. It can be seen that there is coherence in the temporal evolution of lightning activity and model calculated convective precipita-tion up to 15:00 UTC, with coincidence of the time of both maxima, but also coherence in the decrease of both fields from the time of their peak at 10:00 UTC up to the minima at 13:00 UTC. From 15:00 UTC and on, the two fields do not evolve in the same way as the lightning activity decreases further while, on the contrary, the convective precipitation increases. It is obvious that convective rainfall is present, ac-cording to the model forecasted fields, both before and after the period of lightning occurrence.
In Fig. 1f the comparison between the temporal evolu-tion of the average profile of the integrated mixing ratio of ice + graupel + snow and lightning activity is presented, for the hours from 06:00 to 18:00 UTC. The mixing ratio presents almost a “bell” shaped distribution with the maxi-mum values from 07:00 to 12:00 UTC, which coincides with the time interval of the fast low pressure deepening. As ex-pected, the building up of the lightning activity time lags the increase in the mixing ratio of ice + snow + graupel, although here the time lag of about one to two hours is considered larger than what is usually observed. This is partly attributed to the fact that, while lightning observations are continuous, the model outputs are at hourly intervals and also to a delay of the model itself to reproduce the convective and micro-physical properties of the event. Nevertheless, it should be noted that the two curves coincide at their maximum which occurs at 10:00 UTC. Then, within the period of decrease of the mixing ratio, the lightning activity also decreases with a faster rate. Unlike the comparison of the lightning with the convective precipitation, the temporal evolution of lightning actually seems to be very well correlated with the presence of the ice phase species.
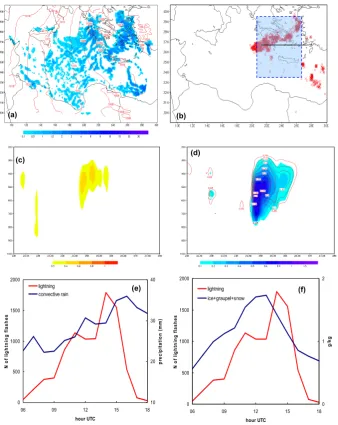
3.2 Case study (b)
(a)
(c)
(b)
0 1000 2000 3000 4000 5000
06 09 12 15 18
hour UTC
N
of
li
ght
ni
ng
f
la
sh
es
20 30 40
pr
ec
ip
it
at
ion
(
m
m
)
lightning convective rain
(e)
0 1000 2000 3000 4000 5000
06 09 12 15 18
hour UTC
N
of
li
g
ht
n
ing f
la
sh
es
1 2 3
g/
kg
lightning ice+graupel+snow
(f) (d)
Figure 1. (a) convective precipitation (mm) and surface pressure (in hPa with 2 hPa interval) as
forecasted by MM5 at 12:00 UTC, (b) lightning activity, (c) cross section (y axis in hPa) of vertical velocity (in ms-1 with 0.2 ms-1 interval) across the line shown in (b), (d) cross section (y axis in hPa) of ice+graupel+snow (shaded), only graupel (black contour) and only ice (red contour) in g/kg, across the line shown in (b), temporal evolution of: (e) convective precipitation with lightning activity and (f) ice+graupel+snow with lightning activity, for the area within the box in (b).
14
Fig. 1. (a) convective precipitation (mm) and surface pressure (in hPa with 2 hPa interval) as forecasted by MM5 at 12:00 UTC, (b) lightning
activity, (c) cross section (y axis in hPa) of vertical velocity (in ms−1with 0.2 ms−1interval) across the line shown in (b), (d) cross section (y axis in hPa) of ice + graupel + snow (shaded), only graupel (black contour) and only ice (red contour) in g/kg, across the line shown in (b), temporal evolution of: (e) convective precipitation with lightning activity and (f) ice + graupel + snow with lightning activity, for the area within the box in (b).
eastern Greece, accompanied by a cold front. Within 24 h an amount of almost 22 000 lightning flashes was recorded. Spatial comparison (Fig. 2a and b) shows the presence of simulated convective rainfall in areas without lightning ac-tivity. Indeed convective rainfall in this case is forecasted outspread in a large area, while lightning is recorded in a more limited area.
The cross section of forecasted vertical velocity (Fig. 2c) shows again the presence of updrafts in the area of lightning, however not very strong (0.5 ms−1) in comparison with the previous case. The vertical distribution of solid hydromete-ors (Fig. 2d) shows that the model forecasts their presence in
low levels, with graupel being again the dominant type at the lower parts of the cloud and snow or ice at the higher parts, with this distribution being favorable for creating charge sep-aration necessary for cloud electrification and lightning oc-currence.
0 500 1000 1500 2000
06 09 12 15 18
hour UTC
N
o
f l
ight
ni
ng f
la
s
he
s
10 20 30 40
p
re
c
ip
ita
ti
o
n
(m
m
)
lightning convective rain
0 500 1000 1500 2000
06 09 12 15 18
hour UTC
N
o
f l
ight
ni
ng f
la
s
he
s
0 1 2
g/
k
g
lightning ice+graupel+snow
(a)
(c)
(b)
(e) (f)
(d)
Figure 2. (a) convective precipitation (mm) and surface pressure (in hPa with 2 hPa interval) as
forecasted by MM5 at 12:00 UTC, (b) lightning activity, (c) cross section (y axis in hPa) of vertical velocity (in ms-1 with 0.2 ms-1 interval) across the line shown in (b), (d) cross section (y axis in hPa) of ice+graupel+snow (shaded) , only graupel (black contour) and only ice (red contour) in g/kg, across the line shown in (b), temporal evolution of: (e) convective precipitation with lightning activity and (f) ice+graupel+snow with lightning activity, for the area within the box in (b).
15
Fig. 2. (a) convective precipitation (mm) and surface pressure (in hPa with 2 hPa interval) as forecasted by MM5 at 12:00 UTC, (b) lightning
activity, (c) cross section (y axis in hPa) of vertical velocity (in ms−1with 0.2 ms−1interval) across the line shown in (b), (d) cross section (y axis in hPa) of ice + graupel + snow (shaded), only graupel (black contour) and only ice (red contour) in g/kg, across the line shown in (b), temporal evolution of: (e) convective precipitation with lightning activity and (f) ice + graupel + snow with lightning activity, for the area within the box in (b).
In agreement with the discussion of the previous case, there is also a very good agreement between the temporal variation of model integrated ice, graupel and snow with the amount of observed lightning flashes throughout the day (Fig. 2f), for the area delimited by the box shown in Fig. 2b, while there are slight differences in the occurrence times of the maximal values and in the rate of decrease, with the light-ning activity decreasing more rapidly.
3.3 Discussion