R E S E A R C H A R T I C L E
Open Access
Cognitive and motor outcomes in children
born low birth weight: a systematic review
and meta-analysis of studies from South
Asia
Ravi Prakash Upadhyay
1*, Gitismita Naik
1, Tarun Shankar Choudhary
1, Ranadip Chowdhury
1, Sunita Taneja
1,
Nita Bhandari
1, Jose Carlos Martines
2, Rajiv Bahl
3and Maharaj Kishan Bhan
4,5Abstract
Background:South Asia contributes substantially to global low birth weight population (i.e. those with birth weight < 2500 g). Synthesized evidence is lacking on magnitude of cognitive and motor deficits in low birth weight (LBW) children compared to those with normal birth weight (NBW) (i.e. birth weight≥2500 g). The meta-analysis aimed to generate this essential evidence.
Methods:Literature search was performed using PubMed and Google Scholar. Original research articles from south Asia that compared cognitive and/or motor scores among LBW and NBW individuals were included. Weighted mean differences (WMD) and pooled relative risks (RR) were calculated. All analyses were done using STATA 14 software. Results:Nineteen articles (n= 5999) were included in the analysis. Children < 10 years of age born LBW had lower cognitive (WMD -4.56; 95% CI: -6.38,−2.74) and motor scores (WMD -4.16; 95% CI: -5.42,−2.89) compared to children with NBW. Within LBW children, those with birth weight < 2000 g had much lower cognitive (WMD -7.23, 95% CI; −9.20, −5.26) and motor scores (WMD -6.45, 95% CI; −9.64, −3.27).
Conclusions: In south Asia, children born LBW, especially with < 2000 g birth weight, have substantial cognitive and motor impairment compared to children with NBW. Early child development interventions should lay emphasis to children born LBW.
Keywords: Cognitive score, Motor score, Children, Adolescents, Low birth weight, South Asia
Key notes
Evidence is lacking from south Asian setting on magnitude of cognitive and motor deficits in low birth weight (LBW) individuals compared to those with normal birth weight (NBW).
Our meta-analysis showed that LBW children < 10 years of age had 4.56 points lower cognitive and 4.16 points lower motor scores compared to children with NBW.
Early child development interventions in south Asia should emphasize on children born LBW
Introduction
Lower middle income countries (LMICs), as per the re-cent World Bank criteria, are those with a gross national income (GNI) per capita between USD 996 and 3895
[1]. In LMICs, around 18 million infants are born with
low birth weight (LBW) (i.e. birth weight < 2500 g), of
which one-fourth (26%) are in south Asia alone [2].
In-fants born with low birth weight have been identified to be at an increased risk of adverse outcomes other than mortality, such as predisposition to stunting, wasting
and impaired neurodevelopment outcomes [3–8]. Further,
investigations based on the concept of Developmental * Correspondence:[email protected]
1Knowledge Integration and Translational Platform (KnIT) at Centre for Health
Research and Development, Society for Applied Studies, New Delhi, India Full list of author information is available at the end of the article
Origins of Health and Disease (DOHaD) also link low birth weight to risk of adult onset cardiovascular, renal and metabolic disorders [9,10].
In most of the south Asian regions, substantial thrust is still on improving survival, particularly in the neonatal period [11, 12]. In the post-neonatal period, additional inputs, either for survival or thrive, from the health system are largely lacking. Evidence on the quantum and nature of growth and development impairment in LBW
infants compared to NBWs (i.e. with birth weight≥
2500 g) would help prioritize and aid in design of post-natal programs. The evidence from LMICs, including south Asia, is available for growth but lacking for neuro-development. A recent systematic review incorporating data from 137 developing countries has documented low birth weight, including prematurity and foetal growth re-striction, as a leading risk factor for childhood stunting at 2 years of age [8].
Data on neurodevelopment impairment from devel-oped countries suggest that individuals born with LBW have a higher risk of lower cognitive function, tend to score lower on academic performance measures, have higher prevalence of mental disorders, serious emotional and behavioural problems and development delay
com-pared to term healthy counterparts [13–18].
Neurodeve-lopmental deficits in low birth weight infants has been linked to injury to the cerebral white matter, cystic peri-ventricular leukomalacia, intraperi-ventricular hemorrhage, reduced total brain volume, altered cortical volume and structure, decreased total number of cells and myelin-ation deficits [19,20]. Brain connectivity is also impaired in such infants as evidenced by neuronal migration defi-cits, reduced dendritic processes, and under-efficient
neural networks [19, 20]. A meta-analysis involving 15
studies (n= 3276) from developed settings documented
lower cognitive scores in school aged children born pre-term, compared to controls born at term (Weighted mean difference 10.9; 95% CI, 9.2–12.5) [21]. These find-ings, however, may not be entirely generalizable to south Asia, owing to the difference in settings and populations. In the developed settings, LBWs are predominantly pre-mature whereas small for gestational age (SGA)
contrib-utes majorly to LBW in south Asia [2, 22]. Further,
social factors, economic factors as well as quality of available health care could moderate the trajectory of developmental outcomes and these are different in south Asia when compared to developed settings.
Our systematic review examined the degree of develop-mental impairment primarily in LBW children, compared with normal birth weights, in south Asia. Additionally, a similar comparison was also done for adolescent age group. Synthesizing such comparative evidence will be helpful in strategic planning of a health program aimed at improving child development. A question in deciding
about such program is whether to reach all infants equally, irrespective of their birth weights or make additional inputs on LBWs. To address this question, we attempted to elucidate how NBW children in south Asian context grow developmentally compared to NBW children from upper-middle-income settings (GNI per capita between
USD 3896 to 12,055) [1]. For this, we have compared
cognitive and motor scores of NBW children from south Asian settings with those from upper middle-high income settings.
Methods
Primary objective(s) of the systematic review
The primary objective of the systematic review was to compare cognitive and motor scores among children aged < 10 years born with normal and low birth weight in south Asian setting. It also encompassed a compari-son of these outcomes between children born with a birth weight of < 2000 g and those with NBW. We further extended such comparisons until the adolescent age group (i.e. 10–19 years of age).
Objective of the additional analysis
The objective of the additional analysis was to compare cognitive and motor scores among NBW children born in south Asia and upper middle-high income settings, following the World Bank classification [1].
Search strategy and selection criteria
For the primary objective
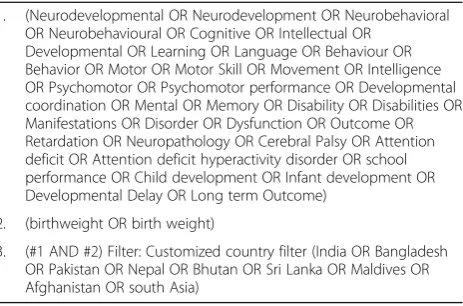
A systematic search was performed by two authors inde-pendently (GN, TSC) using PubMed and Google Scholar. Google Scholar was used as an adjunct resource to complement PubMed as it offers advantages in terms of its potential to provide access to the gray literature, theses, abstracts, conference proceedings, preprints and institutional repositories. Any discrepancy was discussed with a third author (RPU). Search strategies used subject headings and key words with no language and time re-strictions. For abstracts/articles published in non-English language, we planned to use Google translator or involve a language expert to help the team in comprehending the study findings. The search strategy is presented in
Table1. The last date of article search was 31st
Decem-ber 2017. The bibliographies of relevant guidelines, re-views and reports were also read to identify relevant primary reports. For studies with data missing or requir-ing clarification, investigators of the included studies were contacted.
Asian setting and have compared outcomes of interest among normal and low birth weight individuals. After initial screening of titles and abstracts, full-text publica-tions of potential studies were reviewed. Discrepancies about inclusion of studies and interpretation of data were resolved by discussion with the other authors (RPU, RC). Data from all studies meeting the inclusion criteria were abstracted into a tabular form (RPU). Newcastle-Ottawa Quality Assessment Scale adapted for observational studies was used for quality assessment of
included studies [23]. The assessment was done by two
authors separately (GN and TSC). In case of any dis-crepancy, a third author (RPU) independently assessed the study.
For the additional analysis
For the additional analysis, a search strategy was devel-oped to identify most recent reviews that either presented pooled cognitive and/or motor scores for NBW individ-uals or compared cognitive and/or motor scores among
normal and low birth weight individuals from
upper-middle-high income settings. The key search terms
included: “birth weight”, “low birth weight”, “preterm”,
“cognition”, “intelligence”, “motor”, “psychomotor”,
“neu-rocognitive”, “systematic reviews”, “meta-analysis”. The
search strategy was run on PubMed and Google Scholar. Last date of search was 31st December, 2017. Data on cognitive and/or motor scores from each of the studies included in the identified review(s) were tabulated.
Data analysis
All analyses were done using STATA 14 software. Het-erogeneity of effects was assessed and quantified by the I2. I2values > 50% were considered to represent substan-tial heterogeneity [24]. In cases with substantial hetero-geneity, random effects model were used. Weighted mean differences (WMD) were calculated by comparing cognitive and motor scores obtained by LBWs with
normal birth weight individuals. Standardized assess-ment tests provide raw scores on scales that are
com-pared to same age peers for norm-referenced
interpretation. Norms are often standardized to a mean of 100 and a standard deviation (SD) of 15 [25]. In studies where standardized tests were not used, the scores were converted into a standardized scale with mean of 100 and standard deviation of 15 [25,26]. This was done to effect-ively pool all the studies and obtain an estimate in terms of weighted mean difference. Pooled relative risks (RR) were also calculated with normal birth weight individuals as the reference. Subgroup analysis based on birth weight i.e. birth weight < 2000 g, compared to normal birth weight, was done. All pooled estimates were reported with 95% confidence intervals.
In studies that reported an outcome at different points in time, only the outcome reported at the most recent point of assessment was considered for analysis. This was done to avoid the analyses of correlated data from repetitive and paired observations, and consequently compromising the reliability of the findings of this meta-analysis. In studies where the outcomes were re-ported as median (range), conversion into mean
(stand-ard deviation) was done using a reliable method [27].
Where standard deviation was not provided along with mean, it was imputed either through calculation of mean of the standard deviations from similar studies or
through methods proposed by Cochrane [28, 29].
Publi-cation bias was assessed using Begg’s test.
We did an additional analysis to compare pooled mean cognitive and motor scores among NBW children from south Asia and upper middle-high income settings. The pooled mean cognitive and motor scores for NBW indi-viduals in these two settings were obtained separately and thereafter, compared for statistical significance of difference in means.
Results
Characteristics of the included studies
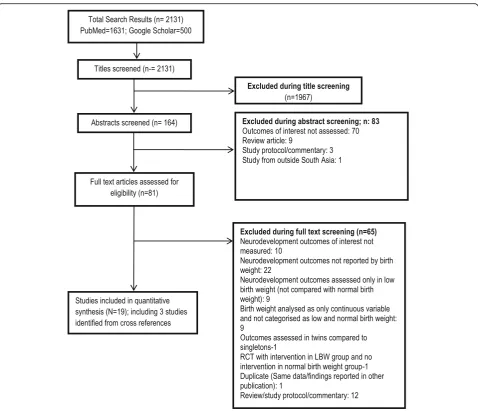
We screened 2131 titles of articles identified through
electronic literature search (PubMed;n= 1631 and
Goo-gle Scholar; n= 500). Out of these, 1967 were excluded
based on titles and another 83 after reviewing the ab-stracts. We assessed 81 full text articles for eligibility and found 16 articles to be relevant for the review. Add-itional 3 articles were identified through cross-references of eligible studies. A total of 19 articles (with 5999 sub-jects; 2236 with low birth weight and 3763 with normal birth weight) were included in our final analysis [30–48]. Figure1shows the flowchart for article selection. All the included studies were published in English language and no additional resources were required for translation.
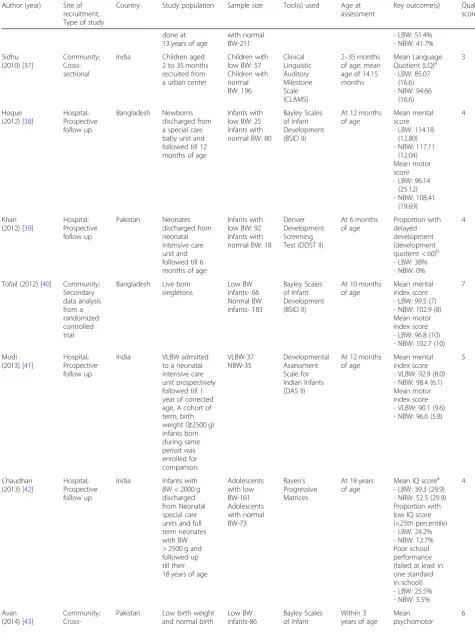
Out of 19 studies, 12 were conducted in India, 2 each in Pakistan, Bangladesh and Nepal and one in Sri Lanka. Table 1Search strategy used to identify articles to be included
in the systematic review and meta-analysis
1. (Neurodevelopmental OR Neurodevelopment OR Neurobehavioral OR Neurobehavioural OR Cognitive OR Intellectual OR
Developmental OR Learning OR Language OR Behaviour OR Behavior OR Motor OR Motor Skill OR Movement OR Intelligence OR Psychomotor OR Psychomotor performance OR Developmental coordination OR Mental OR Memory OR Disability OR Disabilities OR Manifestations OR Disorder OR Dysfunction OR Outcome OR Retardation OR Neuropathology OR Cerebral Palsy OR Attention deficit OR Attention deficit hyperactivity disorder OR school performance OR Child development OR Infant development OR Developmental Delay OR Long term Outcome)
2. (birthweight OR birth weight)
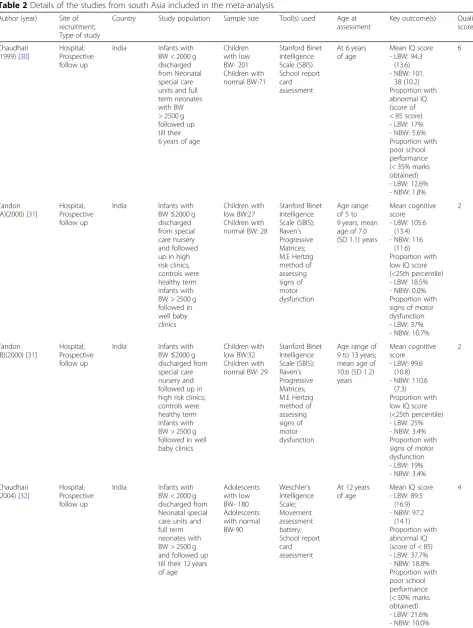
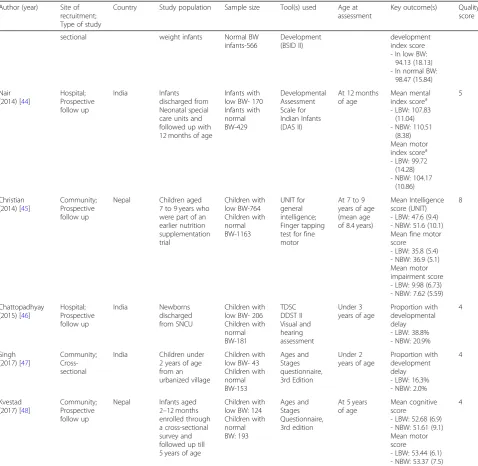
A total of 13 studies were conducted in children aged up to 5 years of age, three studies in children aged 6 to 9 years and 4 studies in adolescents i.e. 10–18 years of age
(Table2). One study by Tandon et al. assessed cognitive
and motor outcomes in two different age groups using different set of participants i.e. involving children aged 5 to 9 years (mean, SD: 7, 1.1 years) and adolescents aged 9 to 13 years (mean, SD: 10.6; 1.2 years) (Table 2) [31]. This study was considered as two different studies for generating pooled estimates. In 11 out of 19 studies, eligible participants were enrolled into the study from hospital whereas in 8 studies, they were enrolled from community setting. A total of 13 studies involved prospective follow up of enrolled infants and children [30–33, 36, 38, 39, 41, 42, 44–46, 48]; 5 were cross-sectional studies [34,35,37,43,47] and one study involved analysis of data generated from a randomized
controlled trial [40]. There were 7 studies with a quality
score of ≥5. The median quality score of the included
studies was 4 and scores ranged from 2 to 8.
Findings of the cognitive score
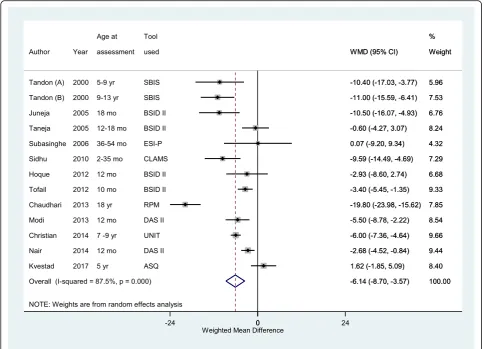
The overall pooled weighted mean difference (WMD) in cognitive scores from infancy till adolescence in low
birth weights, compared to NBW participants was−6.14
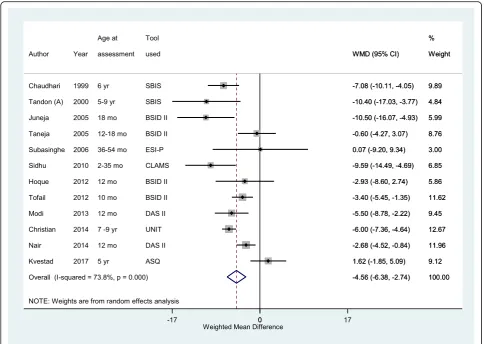
(95% CI; −8.70, −3.57) (n= 4203, I2 = 87.5%) (Fig. 2). Children under 10 years of age born with low birth weight had around 5 points lower cognitive scores compared to NBW children (Weighted mean
differ-ence (WMD) -4.56; 95% CI; −6.38, −2.74) (n= 4180;
I2 = 73.8%) (Fig. 3). The difference among low and
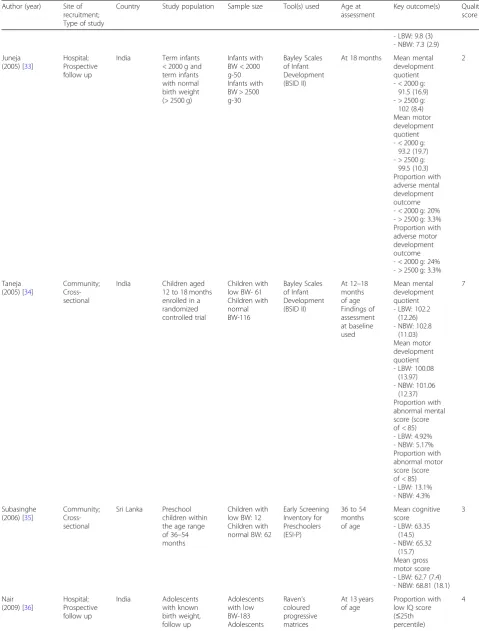
Table 2Details of the studies from south Asia included in the meta-analysis
Author (year) Site of recruitment; Type of study
Country Study population Sample size Tool(s) used Age at assessment
Key outcome(s) Quality score
Chaudhari (1999) [30]
Hospital; Prospective follow up
India Infants with BW < 2000 g discharged from Neonatal special care units and full term neonates with BW > 2500 g followed up till their 6 years of age
Children with low BW- 201 Children with normal BW-71 Stanford Binet Intelligence Scale (SBIS) School report card assessment
At 6 years of age
Mean IQ score - LBW: 94.3
(13.6) - NBW: 101.
38 (10.2) Proportion with abnormal IQ (score of < 85 score) - LBW: 17% - NBW: 5.6% Proportion with poor school performance (< 35% marks obtained) - LBW: 12.6% - NBW: 1.8%
6
Tandon (A)(2000) [31]
Hospital; Prospective follow up
India Infants with BW≤2000 g discharged from special care nursery and followed up in high risk clinics; controls were healthy term infants with BW > 2500 g followed in well baby clinics Children with low BW:27 Children with normal BW: 28
Stanford Binet Intelligence Scale (SBIS); Raven’s Progressive Matrices; M.E Hertzig method of assessing signs of motor dysfunction Age range of 5 to 9 years; mean age of 7.0 (SD 1.1) years
Mean cognitive score - LBW: 105.6
(13.4) - NBW: 116
(11.6) Proportion with low IQ score (<25th percentile) - LBW: 18.5% - NBW: 0.0% Proportion with signs of motor dysfunction - LBW: 37% - NBW: 10.7%
2
Tandon (B)(2000) [31]
Hospital; Prospective follow up
India Infants with BW≤2000 g discharged from special care nursery and followed up in high risk clinics; controls were healthy term infants with BW > 2500 g followed in well baby clinics
Children with low BW:32 Children with normal BW: 29
Stanford Binet Intelligence Scale (SBIS); Raven’s Progressive Matrices; M.E Hertzig method of assessing signs of motor dysfunction
Age range of 9 to 13 years; mean age of 10.6 (SD 1.2) years
Mean cognitive score - LBW: 99.6
(10.8) - NBW: 110.6
(7.3) Proportion with low IQ score (<25th percentile) - LBW: 25% - NBW: 3.4% Proportion with signs of motor dysfunction - LBW: 19% - NBW: 3.4%
2
Chaudhari (2004) [32]
Hospital; Prospective follow up
India Infants with BW < 2000 g discharged from Neonatal special care units and full term neonates with BW > 2500 g and followed up till their 12 years of age Adolescents with low BW- 180 Adolescents with normal BW-90
Weschler’s Intelligence Scale; Movement assessment battery; School report card assessment
At 12 years of age
Mean IQ score - LBW: 89.5
(16.9) - NBW: 97.2
(14.1) Proportion with abnormal IQ (score of < 85) - LBW: 37.7% - NBW: 18.8% Proportion with poor school performance (< 50% marks obtained) - LBW: 21.6% - NBW: 10.0% Mean motor impairment score
Table 2Details of the studies from south Asia included in the meta-analysis(Continued)
Author (year) Site of recruitment; Type of study
Country Study population Sample size Tool(s) used Age at assessment
Key outcome(s) Quality score
- LBW: 9.8 (3) - NBW: 7.3 (2.9)
Juneja (2005) [33]
Hospital; Prospective follow up
India Term infants < 2000 g and term infants with normal birth weight (> 2500 g)
Infants with BW < 2000 g-50 Infants with BW > 2500 g-30
Bayley Scales of Infant Development (BSID II)
At 18 months Mean mental development quotient - < 2000 g:
91.5 (16.9) - > 2500 g:
102 (8.4) Mean motor development quotient - < 2000 g:
93.2 (19.7) - > 2500 g:
99.5 (10.3) Proportion with adverse mental development outcome - < 2000 g: 20% - > 2500 g: 3.3% Proportion with adverse motor development outcome - < 2000 g: 24% - > 2500 g: 3.3%
2
Taneja (2005) [34]
Community; Cross-sectional
India Children aged 12 to 18 months enrolled in a randomized controlled trial
Children with low BW- 61 Children with normal BW-116 Bayley Scales of Infant Development (BSID II)
At 12–18 months of age Findings of assessment at baseline used Mean mental development quotient - LBW: 102.2
(12.26) - NBW: 102.8
(11.03) Mean motor development quotient - LBW: 100.08
(13.97) - NBW: 101.06
(12.37) Proportion with abnormal mental score (score of < 85) - LBW: 4.92% - NBW: 5.17% Proportion with abnormal motor score (score of < 85) - LBW: 13.1% - NBW: 4.3%
7
Subasinghe (2006) [35]
Community; Cross-sectional
Sri Lanka Preschool children within the age range of 36–54 months
Children with low BW: 12 Children with normal BW: 62
Early Screening Inventory for Preschoolers (ESI-P)
36 to 54 months of age
Mean cognitive score - LBW: 63.35
(14.5) - NBW: 65.32
(15.7) Mean gross motor score - LBW: 62.7 (7.4) - NBW: 68.81 (18.1)
3
Nair (2009) [36]
Hospital; Prospective follow up India Adolescents with known birth weight, follow up Adolescents with low BW-183 Adolescents
Raven’s coloured progressive matrices
At 13 years of age
Proportion with low IQ score (≤25th percentile)
Table 2Details of the studies from south Asia included in the meta-analysis(Continued)
Author (year) Site of recruitment; Type of study
Country Study population Sample size Tool(s) used Age at assessment
Key outcome(s) Quality score
done at 13 years of age
with normal BW-211
- LBW: 51.4% - NBW: 41.7%
Sidhu (2010) [37]
Community; Cross-sectional
India Children aged 2 to 35 months recruited from a urban center
Children with low BW: 57 Children with normal BW: 196 Clinical Linguistic Auditory Milestone Scale (CLAMS)
2–35 months of age; mean age of 14.15 months
Mean Language Quotient (LQ)a - LBW: 85.07
(16.6) - NBW: 94.66
(16.6)
3
Hoque (2012) [38]
Hospital; Prospective follow up
Bangladesh Newborns discharged from a special care baby unit and followed till 12 months of age
Infants with low BW: 25 Infants with normal BW: 80
Bayley Scales of Infant Development (BSID II)
At 12 months of age
Mean mental score - LBW: 114.18
(12.80) - NBW: 117.11
(12.04) Mean motor score - LBW: 96.14
(25.12) - NBW: 108.41
(19.69)
4
Khan (2012) [39]
Hospital; Prospective follow up Pakistan Neonates discharged from neonatal intensive care unit and followed till 6 months of age
Infants with low BW: 92 Infants with normal BW: 18
Denver Development Screening Test (DDST II)
At 6 months of age
Proportion with delayed development (development quotient < 60)b - LBW: 38% - NBW: 0%
4
Tofail (2012) [40] Community; Secondary data analysis from a randomized controlled trial
Bangladesh Live born singletons Low BW infants- 66 Normal BW infants- 183 Bayley Scales of Infant Development (BSID II)
At 10 months of age
Mean mental index score - LBW: 99.5 (7) - NBW: 102.9 (8) Mean motor index score - LBW: 96.8 (10) - NBW: 102.7 (10)
7
Modi (2013) [41]
Hospital; Prospective follow up
India VLBW admitted to a neonatal intensive care unit prospectively followed till 1 year of corrected age. A cohort of term, birth weight (≥2500 g) infants born during same period was enrolled for comparison. VLBW-37 NBW-35 Developmental Assessment Scale for Indian Infants (DAS II)
At 12 months of age
Mean mental index score - VLBW: 92.9 (8.0) - NBW: 98.4 (6.1) Mean motor index score - VLBW: 90.1 (9.6) - NBW: 96.6 (5.8)
5
Chaudhari (2013) [42]
Hospital; Prospective follow up
India Infants with BW < 2000 g discharged from Neonatal special care units and full term neonates with BW > 2500 g and followed up till their 18 years of age
Adolescents with low BW-161 Adolescents with normal BW-73
Raven’s Progressive Matrices
At 18 years of age
Mean IQ scorea - LBW: 39.3 (29.9) - NBW: 52.5 (29.9) Proportion with low IQ score (<25th percentile) - LBW: 24.2% - NBW: 12.7% Poor school performance (failed at least in one standard in school) - LBW: 25.5% - NBW: 5.5%
4
Avan (2014) [43]
Community;
Cross-Pakistan Low birth weight and normal birth
Low BW infants-86
Bayley Scales of Infant
Within 3 years of age
Mean psychomotor
adolescent age group (WMD -15.45; 95% CI; −24.08, −6.83) (n= 295, I2= 87.1%).
The proportion with low cognitive score, defined as IQ score of less than 25th percentile or a mental quotient of < 85, was 14% (95% CI; 6–22%) and 5% (95% CI; 2–8%) in LBW and NBW children aged < 10 years respectively (Data not shown). The risk of low
cognitive score in children under 10 years was around 2.5 times higher in LBWs compared to those born
with NBW (RR 2.69; 95% CI, 1.34–5.39) (n= 584, I2=
12.7%) (Table 3). This risk was 1.28 times higher in
adolescents (aged 10–18 years) born LBW compared
to those born NBW (RR 1.28; 95% CI, 1.02–1.61) (n=
687, I2= 46.8%).
Table 2Details of the studies from south Asia included in the meta-analysis(Continued)
Author (year) Site of recruitment; Type of study
Country Study population Sample size Tool(s) used Age at assessment
Key outcome(s) Quality score
sectional weight infants Normal BW
infants-566
Development (BSID II)
development index score - In low BW:
94.13 (18.13) - In normal BW:
98.47 (15.84)
Nair (2014) [44]
Hospital; Prospective follow up India Infants discharged from Neonatal special care units and followed up with 12 months of age
Infants with low BW- 170 Infants with normal BW-429 Developmental Assessment Scale for Indian Infants (DAS II)
At 12 months of age
Mean mental index scorea - LBW: 107.83
(11.04) - NBW: 110.51
(8.38) Mean motor index scorea
- LBW: 99.72 (14.28) - NBW: 104.17
(10.86)
5
Christian (2014) [45]
Community; Prospective follow up
Nepal Children aged 7 to 9 years who were part of an earlier nutrition supplementation trial Children with low BW-764 Children with normal BW-1163 UNIT for general intelligence; Finger tapping test for fine motor
At 7 to 9 years of age (mean age of 8.4 years)
Mean Intelligence score (UNIT) - LBW: 47.6 (9.4) - NBW: 51.6 (10.1) Mean fine motor score
- LBW: 35.8 (5.4) - NBW: 36.9 (5.1) Mean motor impairment score - LBW: 9.98 (6.73) - NBW: 7.62 (5.59)
8
Chattopadhyay (2015) [46]
Hospital; Prospective follow up India Newborns discharged from SNCU Children with low BW- 206 Children with normal BW-181 TDSC DDST II Visual and hearing assessment Under 3 years of age
Proportion with developmental delay - LBW: 38.8% - NBW: 20.9%
4
Singh (2017) [47]
Community; Cross-sectional
India Children under 2 years of age from an urbanized village
Children with low BW- 43 Children with normal BW-153 Ages and Stages questionnaire, 3rd Edition Under 2 years of age
Proportion with development delay - LBW: 16.3% - NBW: 2.0%
4
Kvestad (2017) [48]
Community; Prospective follow up
Nepal Infants aged 2–12 months enrolled through a cross-sectional survey and followed up till 5 years of age
Children with low BW: 124 Children with normal BW: 193 Ages and Stages Questionnaire, 3rd edition
At 5 years of age
Mean cognitive score
- LBW: 52.68 (6.9) - NBW: 51.61 (9.1) Mean motor score
- LBW: 53.44 (6.1) - NBW: 53.37 (7.5)
4
BWbirth weight,LBWlow birth weight,VLBWvery low birth weight,NBWnormal birth weight,IQintelligence quotient aSD calculated using imputation
method (http://handbook-5-1.cochrane.org/chapter_7/7_7_3_3_obtaining_standard_deviations_from_standard_errors.htm) b
Findings of the motor score
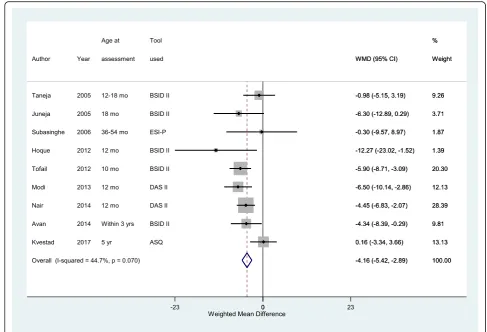
Children, under-five years of age, born LBW had 4 points lower motor scores compared to children with
NBW (WMD -4.16, 95% CI; −5.42, −2.89) (n= 2325,
I2 = 44.7%) (Fig. 4). Among children < 10 years of age, 23% (95% CI; 10–35%) of LBW children had motor impairment (defined as either presence of signs of motor dysfunction on clinical examination or motor quotient of < 85) as opposed to 5% of normal birth weight chil-dren (95% CI; 1–8%). The risk of motor impairment in children born LBW was around 3 times higher com-pared to those born NBW (RR 3.32; 95% CI, 1.56–7.06) (n= 312, I2= 0.0%) (Table3).
Findings of cognitive and motor scores in a sub-group of LBW (< 2000 g)
Within LBW children under 10 years of age, those with birth weight < 2000 g had much lower cognitive and motor scores when compared to children with normal
birth weight (Table 4). Such children had around 7
points lower cognitive score (WMD -7.23, 95% CI; −
9.20,−5.26) (n= 479, I2= 8.7%) compared to their
coun-terparts with NBW (Table 4). The risk of low cognitive
performance was nearly 4 times higher (RR 3.59; 95%
CI; 1.55, 8.32) (n= 407; I2 = 0.0%). In terms of motor
performance, such children had around 6.5 points lower motor score compared to their NBW counterparts (WMD -6.45, 95% CI;−9.64, −3.27) (n= 152; I2= 0.0%). There was around 4 times higher risk of low motor per-formance in children born with birth weight of < 2000 g (RR 3.72, 95% CI; 1.32, 10.54) compared to those with a weight of≥2500 g at birth (n= 135; I2= 0.0%) (Table 4). Additional findings from the studies included in the
re-view have been presented in Additional file 1: Table S1.
Begg’s plot did not suggest publication bias for the
pri-mary outcomes of interest (P value of 0.837 and 0.917
for WMD cognitive and WMD motor scores respect-ively) (Fig.5).
Findings of the additional analysis
performance. The search strategy used to identify sys-tematic reviews from upper middle-high income settings resulted in a total of 690 articles of which 53 were dupli-cates. Another 606 articles were rejected based on title screening. Full texts of 31 reviews were read and of them
4 were included for the additional analysis [49–52].
There were four studies from South Asia [35,42,45,48] wherein the reported scores were converted into stan-dardized scores with mean of 100 and SD of 15 in order to make them comparable to those reported in studies from upper middle-high income settings.
Mean cognitive scores for NBW children aged < 10 years in upper middle-high income countries was 105.37 (95% CI; 103.54, 107.20) and for south Asia it was 104.13
(95% CI; 100.94, 107.31) with a P-value for difference in
means of 0.482 (Additional file1: Table S2, Figure S1 and Figure S2). The overall pooled mean cognitive scores in NBW individuals from infancy till adolescence for upper middle-high income countries and south Asia were 104.56 (95% CI; 103.34, 105.78) and 105.03 (95% CI; 101.96,
108.10) respectively (P-value for difference in means
0.799) (Additional file1: Figures S3 and S4).
Fig. 3Pooled weighted mean difference (WMD) in cognitive scores in children aged < 10 years born with low birth weight, compared to their counterparts with normal birth weight
Table 3Risk of adverse neuro-developmental outcomes in children < 10 years of age born with low birth weight compared to those born with normal birth weight
Outcomes No. of studies No. of subjects Age range Pooled RR (95% CI) I2Statistic
Low cognitive scorea 4 584 < 10 years 2.69 (1.34, 5.39) 12.7%
Motor impairmentb 3 312 < 10 years 3.32 (1.56, 7.06) 0.0%
Developmental delayc 3 693 ≤3 years 1.97 (1.41, 2.73) 69.3%
a
Defined as mental quotient of < 85 or IQ score≤25th percentile b
defined as either presence of signs of motor dysfunction on clinical examination or motor quotient of < 85 c
Mean motor scores for NBW children < 10 years of age from upper middle-high income countries and south Asia were 106.89 (95% CI; 101.39, 112.40) and 101.75 (95% CI; 99.45, 104.05) respectively (P-value for
differ-ence in means = 0.092) (Additional file 1: Table S3,
Figures S5 and S6).
Discussion
The current meta-analysis was done to primarily assess the magnitude of cognitive and motor impairment that children born with low birth weight experience, compared to their normal birth weight counterparts in a south Asian
setting. We observed that LBW children had 5 point lower cognitive scores and 4 point lower motor scores compared to children with normal birth weight. The deficit in scores was even greater (around 7 points) in those with birth weight of < 2000 g. The risk of cognitive and motor defi-cits in LBWs seemed to persist throughout the transition from early childhood to adolescence. In the additional analysis, we found cognitive and motor scores of NBW children from south Asian settings to be similar to those in upper middle-high income settings.
There is substantial difference in quantum of deficits that LBW individuals experience compared to normal Fig. 4Pooled weighted mean difference (WMD) in motor scores in children under-five years of age born low birth weight, compared to those with normal birth weight
Table 4Risk of adverse neuro-developmental outcomes in children < 10 years of age born with birth weight < 2000 g compared to those born with normal birth weight (≥2500 g)
Outcomes No. of studies No. of subjects Age range Effect size (95% CI) I2Statistic
Cognitive score 4 479 < 10 years WMD−7.23 (−9.20;−5.26) 8.7%
3 407 < 10 years RR 3.59 (1.55; 8.32)a 0.0%
Motor score 2 152 < 10 years WMD−6.45 (−9.64;−3.27) 0.0%
2 135 < 10 years RR 3.72 (1.32; 10.54)b 0.0%
a
Represents the risk of having“low cognitive performance”defined as mental quotient of < 85 or IQ score≤25th percentile b
birth weights, in upper middle-high income and south Asian settings. Recently published systematic reviews from upper middle-high income settings document LBW individuals to have around 8–12 points lower cog-nitive scores, as opposed to 5 points lower scores found
by us in south Asia [49–51]. Similarly, children and
adolescents who were LBW had around 13 points lower motor scores in upper middle-high income settings whereas we found a 4 to 6 points lower motor scores
[52]. These observed differences could be due to the
difference in the nature of low birth weights in these two settings. While small for gestational age (SGA) forms a significant proportion of LBW in south Asia, prematurity contributes to a major proportion in high income/developed settings [2,22].
The magnitude of cognitive deficit is often related to subsequent income. According to the World Bank 2006
report, studies from United States, Pakistan, Kenya and Tanzania reported 8–12, 6.5, 8 and 5% decreases in wages, respectively, for a 0.5 SD decline in cognitive
score [53]. In the present metaanalysis, we found an
overall pooled 0.40 SD (around 6 points; 1 SD = 15 points on standardized developmental assessment scales) decrease in cognitive scores from infancy to adolescence in LBWs and therefore, could possibly expect a similar reduction in adult wages. The amount of economic po-tential lost is a serious concern and therefore demands early recognition and action.
South Asia is home to a large proportion of the
World’s LBW infants [2]. Until now, much of the focus
has been on ensuring survival of these vulnerable subsets, particularly in the neonatal period, as mortality
rates are high in the first few months of life [6, 54].
Those who survive this critical period are often cared for
A
B
similarly to infants born with NBW and no additional efforts are made to improve their growth and develop-ment. It seems imperative to consider how to design programs wherein the needs of such infants can be met. One key policy question in the south Asian context, considering the constraints in resources, is to decide whether early child development interventions should be for all children irrespective of their birth weight or primarily for those with low birth weight. The findings of the study underscore the need to target LBW chil-dren. Further, as shown in the additional analysis, NBW children in south Asia appear to reach similar cognitive and motor scores as observed in upper middle-high income settings. A similar finding was reported by a recent multicentre study from India, Argentina, Turkey and South Africa, where most developmental milestones in normal birth weight healthy children in early child-hood were attained at similar ages across these four
diverse settings [55]. While we believe that early child
development (ECD) intervention program(s) should cater to the growth and developmental needs of all children yet if we are to reduce the inequity, mecha-nisms for additional care focussing on LBW infants, particularly those with birth weight of under 2000 g, should be ensured.
To the best of our knowledge, this is the first system-atic review which documents the magnitude of deficits in cognitive and motor performance among individuals born from south Asia with LBW compared to those with NBW. The current review suffers from paucity of good quality studies from south Asia; only a third of the
included studies had a score of ≥5 out of 10 (reflecting
acceptable quality). Another limitation of the review is that because of the limited data on cognitive and motor performance disaggregated by prematurity and SGA, we could not compare their separate neurodevelopment outcomes with term-appropriate for gestational age (ter-m-AGA) infants. Further, the small number of studies reporting outcomes in adolescence led to wide confi-dence intervals of estimates. Most of the studies in the review were from India with lesser representation from other countries of south Asia. However, the social, cultural, economic and health care milieu in most of the south Asian countries has strong similarities and there-fore, the generalizability of the findings will probably remain unaffected. We used Google Scholar to comple-ment the findings of the search on PubMed. However, we acknowledge the limitations of Google Scholar such as lack of reliable advanced search functions, lack of con-trolled vocabulary (similar to MeSH terms in PubMed) and inadequate understanding of the exact scope of its coverage. The included studies varied in the nature of study design. Almost all the studies were observational in nature; however, pooling of studies with cohort and
cross-sectional design might lead to some loss of reliability of the findings. In studies with prospective follow up, we would expect the birth weight to have been reliably measured while birth weight data may be prone to recall bias and consequent misclassification of birth weight cat-egories in cross-sectional studies (especially when data is not recorded from hospital birth records). In studies where standardized test was not used, the scores were converted into a standardized scale with mean of 100 and standard deviation of 15. The advantage of this conversion is that scores from different tests can be meaningfully interpreted and compared. However, there is a limitation that such conversions assume a normal distribution but in case this assumption is not met, the scores cannot be interpreted as a standard proportion of the distribution from which they were calculated.
Conclusions
This metaanalysis from south Asian setting reveals significant deficits in cognitive and motor scores in children and adolescents born with low birth weight, compared to those born with normal birth weight. We also observed a dose effect relationship wherein among the LBW children; those with birth weight of less than 2000 g had much lower cognitive and motor scores. While NBW infants from south Asia appear to develop similar to their counterparts from upper middle-high in-come settings, the high degree of deficits among LBWs underscore the need for prioritizing the delivery of child development interventions to these children.
Additional file
Additional file 1:Table S1.Summarized additional findings in the studies included in the meta analysis.Table S2.Mean cognitive scores in normal birth weight children and adolescents from upper middle-high income settings and south Asia.Table S3.Mean motor scores in normal birth weight children from upper middle-high income and south Asian setting.Figure S1.Pooled mean cognitive scores in children < 10 years of age born with normal birth weight (≥2500 g) from upper middle-high income settings.Figure S2.Pooled mean cognitive scores in children < 10 years of age born with normal birth weight (≥2500 g) from south Asian setting.Figure S3.Pooled mean cognitive scores from infancy till adolescence in individuals born with normal birth weight (≥2500 g) from upper middle-high income settings.Figure S4.Pooled mean cognitive scores from infancy till adolescence in individuals born with normal birth weight (≥2500 g) from south Asian setting.Figure S5.Pooled mean motor scores in children < 10 years of age born with normal birth weight from upper middle-high income settings.Figure S6.Pooled mean motor scores in children < 10 years of age born with normal birth weight from south Asian setting. (DOC 221 kb)
Abbreviations
AGA:Appropriate for gestational age; CENTRAL: Central register for controlled trials; ECD: Early child development; LBW: Low birth weight; LMIC: Low middle income countries; NBW: Normal birth weight; RR: Relative risk; SGA: Small for gestational age; WMD: Weighted mean difference
Funding
This work was funded by Knowledge Integration and Technology Platform (KnIT); a Grand Challenges Initiative of the Department of Biotechnology and Biotechnology Industry Research Assistance Council (BIRAC) of Government of India and Bill & Melinda Gates Foundation (USA). The funding body had no role in the design of the study and collection, analysis, and interpretation of data and in writing the manuscript.
Availability of data and materials
All data generated or analysed during this study are included in this published article [and its supplementary information files].
Authors’contributions
MKB, RB, JM and RPU conceptualized the idea; RPU, RC, GN developed the search strategy; GN and TSC did the article search, abstracted the data and did the quality assessment; RPU developed the plan for analysis and performed the analysis; RPU prepared the manuscript with critical inputs from NB, ST, JM, RC, RB and MKB. All the authors read and approved the final draft.
Ethics approval and consent to participate Not applicable
Consent for publication Not applicable
Competing interests
The authors declare that they have no competing interests.
Publisher’s Note
Springer Nature remains neutral with regard to jurisdictional claims in published maps and institutional affiliations.
Author details
1Knowledge Integration and Translational Platform (KnIT) at Centre for Health
Research and Development, Society for Applied Studies, New Delhi, India.
2Centre for Intervention Science in Maternal and Child Health, Centre for
International Health, University of Bergen, Bergen, Norway.3Department of Maternal, Newborn, Child and Adolescent Health, World Health Organization, Geneva, Switzerland.4Indian Institute of Technology (IIT), New Delhi, India.
5Knowledge Integration and Translational Platform (KnIT), Biotechnology
Industry Research Assistance Council (BIRAC), New Delhi, India.
Received: 5 June 2018 Accepted: 17 January 2019
References
1. World Bank country and lending groups. Available at:https://datahelpdesk. worldbank.org/knowledgebase/articles/906519-world-bank-country-and-lending-groups. Accessed 26 Nov 2018.
2. Lee AC, Katz J, Blencowe H, Kozuki N, Vogel JP, Adair L, et al. National and regional estimates of term and preterm babies born small for gestational age in 138 low-income and middle-income countries in 2010. Lancet Glob Health. 2013;1(1):e26–36.
3. United Nations Children’s Fund and World Health Organization. Low Birth weight: Country, regional and global estimates. New York: UNICEF; 2004. https://www.unicef.org/publications/files/low_birthweight_from_EY.pdf. Accessed 28 Nov 2018.
4. Christian P, Lee SE, Donahue Angel M, Adair LS, Arifeen SE, Ashorn P, et al. Risk of childhood undernutrition related to small-for-gestational age and preterm birth in low- and middle-income countries. Int J Epidemiol. 2013; 42(5):1340–55.
5. Hviid A, Melbye M. The impact of birth weight on infectious disease hospitalization in childhood. Am J Epidemiol. 2007;165(7):756–61. 6. Million Death Study Collaborators, Bassani DG, Kumar R, Awasthi S, Morris
SK, Paul VK, et al. Causes of neonatal and child mortality in India: a nationally representative mortality survey. Lancet. 2010;376(9755):1853–60. 7. Veena SR, Krishnaveni GV, Wills AK, Kurpad AV, Muthayya S, Hill JC, et al.
Association of birthweight and head circumference at birth to cognitive performance in 9-to 10-year-old children in South India: prospective birth cohort study. Pediatr Res. 2010;67:424–9.
8. Danaei G, Andrews KG, Sudfeld CR, Fink G, McCoy DC, Peet E, et al. Risk factors for childhood stunting in 137 developing countries: a comparative risk assessment analysis at global, regional, and country levels. PLoS Med. 2016;13(11):e1002164.
9. Suzuki K. The developing world of DOHaD. J Dev Orig Health Dis. 2018; 9(3):266–9.
10. Luyckx VA, Perico N, Somaschini M, Manfellotto D, Valensise H, Cetin I, et al. A developmental approach to the prevention of hypertension and kidney disease: a report from the low birth weight and nephron number working group. Lancet. 2017;390(10092):424–8.
11. Gogia S, Sachdev HP. Home-based neonatal care by community health workers for preventing mortality in neonates in low- and middle-income countries: a systematic review. J Perinatol. 2016;36(Suppl 1):S55–73. 12. Nair N, Tripathy P, Prost A, Costello A, Osrin D. Improving newborn survival
in low-income countries: community-based approaches and lessons from South Asia. PLoS Med. 2010;7(4):e1000246.
13. Orchinik LJ, Taylor HG, Espy KA, Minich N, Klein N, Sheffield T, et al. Cognitive outcomes for extremely preterm/extremely low birth weight children in kindergarten. J Int Neuropsychol Soc. 2011;17(6):1067–79. 14. Weindrich D, Jennen-Steinmetz C, Laucht M, Schmidt MH. Late sequelae of
low birthweight: mediators of poor school performance at 11 years. Dev Med Child Neurol. 2003;45(7):463–9.
15. Whitaker AH, Feldman JF, Lorenz JM, Shen S, McNicholas F, Nieto M, et al. Motor and cognitive outcomes in nondisabled low-birth-weight adolescents: early determinants. Arch Pediatr Adolesc Med. 2006;160(10):1040–6. 16. Arpi E, Ferrari F. Preterm birth and behaviour problems in infants and
preschool-age children: a review of the recent literature. Dev Med Child Neurol. 2013;55(9):788–96.
17. Leijon I, Ingemansson F, Nelson N, Wadsby M, Samuelsson S. Reading deficits in very low birthweight children are associated with vocabulary and attention issues at the age of seven. Acta Paediatr. 2016;105(1):60–8. 18. Hayes B, Sharif F. Behavioural and emotional outcome of very low birth
weight infants--literature review. J Matern Fetal Neonatal Med. 2009; 22(10):849–56.
19. Miller SL, Huppi PS, Mallard C. The consequences of fetal growth restriction on brain structure and neurodevelopmental outcome. J Physiol. 2016;594(4):807–23.
20. Volpe JJ. Brain injury in premature infants: a complex amalgam of destructive and developmental disturbances. Lancet Neurol. 2009;8:110–24. 21. Bhutta AT, Cleves MA, Casey PH, Cradock MM, Anand KJ. Cognitive and
behavioral outcomes of school-aged children who were born preterm: a meta-analysis. JAMA. 2002;288(6):728–37.
22. Blencowe H, Cousens S, Chou D, Oestergaard M, Moller AB, Say L, et al. Born too soon: the global epidemiology of 15 million preterm births. Reprod Health. 2013;10(Suppl 1):S2.
23. Wells G, Shea B, O’Connell D, Peterson J, Welch V, Losos M, et al. The Newcastle-Ottawa (NOS) for assessing the quality of nonrandomized studies in meta-analysis. Ottawa: Ottawa Hospital Research Institute. Available from: http://www.ohri.ca/programs/clinical_epidemiology/oxford.asp.
24. Higgins JPT, Green S, editors. Cochrane handbook for systematic reviews of interventions. London: The Cochrane Collaboration; 2008. Available from: https://onlinelibrary.wiley.com/doi/book/10.1002/9780470712184. 25. Brock SE. Descriptive statistics and psychological testing. Available at:http://
www.csus.edu/indiv/b/brocks/courses/eds%20250/eds%20250/handouts/11/ descrptive%20statistics%20and%20the%20normal%20curve.pdf. Accessed 28 Nov 2018.
26. Carey G. Linear transformation and linear composites. Available athttp:// psych.colorado.edu/~carey/Courses/PSYC7291/handouts/transformations. pdf, Accessed 28 Nov 2018.
27. Hozo SP, Djulbegovic B, Hozo I. Estimating the mean and variance from the median, range, and the size of a sample. BMC Med Res Methodol. 2005;5:13.
28. Furukawa TA, Barbui C, Cipriani A, Brambilla P, Watanabe N. Imputing missing standard deviations in meta-analyses can provide accurate results. J Clin Epidemiol. 2006;59(1):7–10.
29. Higgins JPT, Green S, editors. Cochrane handbook for systematic reviews of interventions. London: The Cochrane Collaboration; Version 5.1.0; 2011. Available from:http://handbook-5-1.cochrane.org/chapter_7/7_7_3_3_ obtaining_standard_deviations_from_standard_errors.htm
31. Tandon A, Kumari S, Ramji S, Malik A, Singh S, Nigam VR. Intellectual psycho-educational and functional status of low birth weight survivors beyond 5 years of age. Indian J Pediatr. 2000;67(11):791–6.
32. Chaudhari S, Otiv M, Chitale A, Pandit A, Hoge M. Pune low birth weight study--cognitive abilities and educational performance at twelve years. Indian Pediatr. 2004;41(2):121–8.
33. Juneja M, Shankar A, Ramji S. Neurodevelopmental, functional and growth status of term low birth weight infants at eighteen months. Indian Pediatr. 2005;42(11):1134–40.
34. Taneja S, Bhandari N, Bahl R, Bhan MK. Impact of zinc supplementation on mental and psychomotor scores of children aged 12 to 18 months: a randomized, double-blind trial. J Pediatr. 2005;146(4):506–11. 35. Subasinghe SMLP, Wijesinghe DGNG. The effect of nutritional status on
cognitive and motor development of pre-school children. Trop Agric Res. Available at:https://www.pgia.ac.lk/files/Annual_congress/journel/v18/8.pdf. 36. Nair MK, Chacko DS, Paul MK, Nair L, George B, Kumar GS. Low birthweight
babies--outcome at 13 years. Indian Pediatr. 2009;46(Suppl):s71–4. 37. Sidhu M, Malhi P, Jerath J. Multiple risks and early language development.
Indian J Pediatr. 2010;77(4):391–5.
38. Hoque MM, Ahmed NU, Khan FH, Jahan R, Yasmeen HN, Chowdhury MA. Breastfeeding and cognitive development of children: assessment at one year of age. Mymensingh Med J. 2012;21(2):316–21.
39. Khan MR, Maheshwari PK, Shamim H, Saleem AF, Ahmed S, Ali SR, et al. Neurodevelopmental outcomes of premature infants at a tertiary care center in Pakistan. Pediatr Neurol. 2012;47(2):109–13.
40. Tofail F, Hamadani JD, Ahmed AZ, Mehrin F, Hakim M, Huda SN. The mental development and behavior of low-birth-weight Bangladeshi infants from an urban low-income community. Eur J Clin Nutr. 2012;66(2):237–43. 41. Modi M, Saluja S, Kler N, Batra A, Kaur A, Garg P, et al. Growth and
neurodevelopmental outcome of VLBW infants at 1 year corrected age. Indian Pediatr. 2013;50(6):573–7.
42. Chaudhari S, Otiv M, Khairnar B, Pandit A, Hoge M, Sayyad M. Pune low birth weight study - birth to adulthood - cognitive development. Indian Pediatr. 2013;50(9):853–7.
43. Avan BI, Raza SA, Kirkwood BR. An epidemiological study of urban and rural children in Pakistan: examining the relationship between delayed psychomotor development, low birth weight and postnatal growth failure. Trans R Soc Trop Med Hyg. 2015;109(3):189–96.
44. Nair MK, Krishnan R, Harikumaran Nair GS, George B, Bhaskaran D, Leena ML, et al. CDC Kerala 3: at-risk baby clinic service using different screening tools--outcome at 12 months using developmental assessment scale for Indian infants. Indian J Pediatr. 2014;81(Suppl 2):S80–4.
45. Christian P, Murray-Kolb LE, Tielsch JM, Katz J, LeClerq SC, Khatry SK. Associations between preterm birth, small-for-gestational age, and neonatal morbidity and cognitive function among school-age children in Nepal. BMC Pediatr. 2014;14:58.
46. Chattopadhyay N, Mitra K. Neurodevelopmental outcome of high risk newborns discharged from special care baby units in a rural district in India. J Public Health Res. 2015;4(1):318.
47. Singh A, Roy N, Boro P. A community based cross sectional study on developmental delay and its determinants amongst under two year old children in an Urbanized Village of Delhi. Int J Curr Res. 2017;9(07):54135–8. 48. Kvestad I, Hysing M, Shrestha M, Ulak M, Thorne-Lyman AL, Henjum S, et al. Vitamin B-12 status in infancy is positively associated with development and cognitive functioning 5 y later in Nepalese children. Am J Clin Nutr. 2017; 105(5):1122–31.
49. Gu H, Wang L, Liu L, Luo X, Wang J, Hou F, et al. A gradient relationship between low birth weight and IQ: a meta-analysis. Sci Rep. 2017;7:18035. 50. Kormos CE, Wilkinson AJ, Davey CJ, Cunningham AJ. Low birth weight and
intelligence in adolescence and early adulthood: a meta-analysis. J Public Health (Oxf). 2014;36(2):213–24.
51. Kerr-Wilson CO, Mackay DF, Smith GC, Pell JP. Meta-analysis of the association between preterm delivery and intelligence. J Public Health (Oxf). 2012;34(2):209–16.
52. de Kieviet JF, Piek JP, Aarnoudse-Moens CS, Oosterlaan J. Motor
development in very preterm and very low-birth-weight children from birth to adolescence: a meta-analysis. JAMA. 2009;302(20):2235–42.
53. Alderman H, Behrman JR. Estimated economic benefits of reducing low birth weight in low-income countries. Human Development Network (HNP) discussion paper, April 2004. Washington, DC: The International Bank for Reconstruction and Development / The World Bank.http://siteresources.
worldbank.org/HEALTHNUTRITIONANDPOPULATION/Resources/281627-1095698140167/Alderman-ReduceLowBirthWeight_whole.pdf. Accessed 1 Dec 2018.
54. Lee AC, Kozuki N, Cousens S, Stevens GA, Blencowe H, Silveira MF, et al. Estimates of burden and consequences of infants born small for gestational age in low and middle income countries with INTERGROWTH-21st standard: analysis of CHERG datasets. BMJ. 2017;j4229:358.