CAD MODEL TO PREDICT THE
EFFECT OF RADOME ON THE
CHARACTERISTICS OF
RECTANGULAR PATCH ANTENNA
M. SEN
Department of Physics, Gobardanga Hindu College,
24 Parganas (North), West Bengal 743273, India
M. BISWAS
Department of Electronics & Tele-Communication Engineering, Jadavpur University,
Kolkata, West Bengal 700032, India
[email protected]
Abstract:
A simple and efficient CAD model based on cavity model analysis is proposed to compute accurately the
resonant frequency, input impedance, bandwidth and gain of radome loaded rectangular patch antenna. The
computed values for wide range of radome parameters are compared with different theoretical and experimental
values available in open literature. The computed values employing the present model shows very close
agreements with the experiments compared to the other model. An electromagnetic software (HFSS) is also
used to generate some simulated data.
Keywords
: rectangular
patch, characteristics, radome, computer aided design.
1.
Introduction
The different aspects of rectangular patch antennas are investigated by many researchers [1-44]. Among
them, radome or superstrate loaded rectangular patch antenna investigated by few researchers [8, 11, 14, 18, 27,
29- 31, 37, 39]. Superstrate protects the patch from environmental hazards and improves the antenna
performances [43]. The patch with substrate–superstrate combined geometry can also operate in the noise
environments. Superstrate reduces the bandwidth of the antenna so, substrate –superstrate combined geometry
is suitable for filter design [45]. The radome loaded patch can receive the signal of interest in the present of
noise. For design a radome loaded patch the resonant frequency is the primary parameter because it determine
the dimensions of the patch. So, the accurate computation of resonant frequency is very important. The different
computational methods are available in open literature [8, 11, 27, 29- 31, 37] to compute the resonant frequency
of radome loaded rectangular patch antenna. Among them, conformal mapping techniques [27, 31, 37] is more
accurate but involves large mathematical steps. Still, there is a discrepancy between measured and computed
values.
For achieving the better efficiency of the antenna, the better impedance matching is required in between
coaxial probe and patch. So, input impedance is a critical parameter for design a patch antenna. The input
impedance of rectangular microstrip patch antenna is investigated by many researchers [7, 12, 14, 16, 20, 23, 25,
28, 38-39]. Among them, fewer researchers [14, 23, 39] have investigated the input impedance of rectangular
patch with radome. But they have not studied thoroughly the effect of radome on input impedance
characteristics.
Fig. 1. Schematic diagram of probe fed rectangular patch antenna loaded with superstrate.
are closer to the experiments compared to the others. The structure is also validated by employing
electromagnetic software (HFSS).
2.
Theoretical Formulations
2.1. Resonant Frequency
The resonant frequency of radome loaded rectangular patch antenna shown in Fig. 1, may be written as [20]
2 2
1/2,
,
(
/
)
(
/
)
2
reff e emn
r
m
b
n
a
c
f
(1)
Where, c is the velocity of light in free space,
r,eff ,b
e,
a
eare the effective dielectric constant, effective
length and effective width respectively of a rectangular patch antenna with and without radome.
The effective dielectric constant of the antenna is enhanced due to dielectric loading. For computing the
r,effof radome loaded rectangular patch antenna, the different techniques are available in open literature [8, 11, 27,
29- 31, 37]. Among them, conformal mapping techniques [27, 31, 37] is more accurate but involves large
mathematical steps. But we have proposed a very simple expression that involves less mathematical steps for
computing
r,effas
2 1 ,eff
F
F
r
(2)
The first term (
F
1) of this equation represents the effective permittivity of the patch without dielectric loading.
Due to dielectric loading the effective permittivity is enhanced and this enhancement is counted by introducing
an empirical relation (
F
2).
F
1 andF
2may be expressed as
2 / 1
585 . 2
12 1
2
12
1
2
1
2
1
a
d
F
re
re(3)
2 3 2 3 12 2
0
.
00377
r r
d
d
d
a
F
(4)
3 2 1 2 3 1 1 3 2
3 2 1
d
d
d
d
r r r
r r
r
r r r
re
(5)
The actual length is enhanced due to the fringing field at the end of patch and this is termed as effective
length
b
e. The effective length
b
eof substrate-superstrate combined geometry may be expressed as [9]
b
b
b
e
2
where,
b is the extension of length due to fringing field of substrate-superstrate combined geometry. The
fringing fields are very much dependent on the relative characteristics of the substrate and radome as indicated
in [44].
Different expressions are available in open literature for computing
b without radome. Among them, [9]
have provided more accurate expression for computing
b without radome. We have employed this expression
for computing
b with radome as
1 3 5 4
12
p
p
p
/
p
d
b
(7)
87
.
0
/
236
.
0
/
189
.
0
26
.
0
434907
.
0
0.854412 8544 . 0 12 81 . 0 , 81 . 0 , 1
d
a
d
a
p
e e eff r eff r
1
358
.
2
1
, 371 . 0 12 2
eff r ed
a
p
0.9236 , / 9413 . 1 12 3 2
084
.
0
arctan
5274
.
0
1
eff r p ed
a
p
e
reff
d
a
p
, 456 . 1 124
1
0
.
0377
arctan
0
.
067
6
5
exp
0
.
036
1
p
5
1
0
.
218
exp
(
7
.
5
a
e/
d
12)
The width is also enhanced due to fringing fields and expressed as
a
e. We have used the expression of
a
ethat was given by [1] without radome for computing
a
e with radome asTable 2. Comparison of theoretical and experimental dominant mode resonant frequencies for radome loaded rectangular patch antennas. a = 33.25 mm, b = 32.25 mm, r1 = 1.0, r2 =2.32, r3 = 2.32, d1 = 0.0 mm, d2 = 3.18 mm
h3 (mm) Exp GHz AB [18] Theory GHz HFSS Bernhard
[37]
Zhong [31]
Present
3.18 2.749 2.555 (7.057) 2.776 (-0.982) 2.718 (1.12) 2.722 (0.981) 6.36 2.704 2.505
(7.359) 2.757 (-1.96) 2.701 (0.111) 2.701 (0.110) 9.54 2.682 2.465
(8.090) 2.746 (-2.386) 2.688 (-0.223) 2.681 (0.037) 12.72 2.670 2.455
(8.052) 2.738 (-2.547) 2.678 (-0.23) 2.661 (0.337) Average % Error 7.635 1.968 0.421 0.366
Table 1. Comparison of theoretical and experimental dominant mode resonant frequencies for radome loaded rectangular patch antennas. a = 33.0 mm, b = 28.5 mm, r1 = 1.0, r2 = 2.32, r3 = 2.32, d1 = 0.0 mm, d2 = 3.18 mm
d3 (mm) Exp (GHz) Bernhard [37] Theory ( GHz) HFSS Zhong
[31]
Bernhad [37]
Present
3.18 3.104 2.94 3.111 (-0.22 )
3.098 (0.20)
3.044 (1.93) 6.36 3.025 2.88 3.092
(-2.23)
3.077 (-1.72)
3.023 (0.06) 9.54 2.980 2.835 3.078
(-3.30)
3.064 (-2.83)
3.000 (-0.67) 12.72 2.955 2.84 3.067
(-3.80)
3.056 (-3.42)
0
.
94
1
.
451
2
ln
1
1
164
.
0
882
.
0
12 12 , 2 12 12 ,d
a
d
d
d
a
a
re re eff r re re re eff r ree
(8)
2.2. Input Impedance
Accurate calculation of input impedance of the patch antenna is required for achieving the optimum
performance. So, a simple, efficient and improved CAD formula based on cavity model analysis is proposed to
compute the input impedance of rectangular patch antenna with and without radome. The input impedance of a
rectangular patch of length
b
and width
a
with and without radome seen by the coaxial feed, located at a
distance
x
0from the centre of the patch shown in Fig. 1, may be written as
2 , 2 , 2 , , 2 , ,1
)
(
1
)
(
mn r mn rf
f
f
f
Q
f
f
f
f
Q
R
j
f
f
f
f
Q
R
X
j
R
Z
mn r T mn r T mn r mn r T in
(9)
where,
R(
)
is the input resistance at resonance when the feed is located at a distance
from the centre,
Q
Tis the total quality factor and
f
r,mnis the mode dependent resonant frequency.
Q
Tconsisting of quality factor due to radiation loss (
Q
r), quality factor due to dielectric loss (
Q
d) and
quality factor due to conductor loss (
Q
c), given by
0 2 4 6 8 10 12 14 16 1.0 1.2 1.4 1.6 1.8 2.0 2.2 2.4 2.6 2.8 3.0 3.2 3.4 f r,10 (G Hz)
d3 (mm)
r3 = 2.32 = 4.5 = 6.5 = 9.8
2 4 6 8 10 12 14 16 1.0 1.5 2.0 2.5 3.0 3.5 4.0
f r,10
(G
Hz)
r3
d3 = 1.575 mm = 3.15 = 6.3 = 12.6
(i) (ii)
Fig. 2. Variation of dominant mode resonant frequency as a function of superstrate thickness and dielectric constant. a = 36.7 mm, b = 28.5 mm, r1 = 1.0, r2 = 2.32, d1 = 0.0 mm, d2 = 1.575 mm. i) fr,10 versus d3, r3 variable ii) ) fr,10 versus r3 , d3 variable.
0 2 4 6 8 10 12 14 16 0 10 20 30 40 50 60 70 f r,1 0 % d3 (mm)
r3 = 2.32
= 4.5 = 6.5 = 9.8
2 4 6 8 10 12 14 16 0 10 20 30 40 50 60 70
f,1r
0
%
r3
d3 = 1.575 mm
= 3.15 = 6.3 = 12.6
(i) (ii)
1
)
1
1
1
(
c d r T
Q
Q
Q
Q
(10)
Q
r,
Q
dand
Q
cmay be computed as [23, 39,44]
mn r eff r r
f
d
c
Q
, 12
,
5
.
2
(11)
, 012 rnm
c
d
f
Q
(12)
tan
1
d
Q
(13)
R(
)
may be computed as [44]
Table 3. Comparison of theoretical and experimental dominant mode resonant frequencies of rectangular patch antennas without radome. r1 =
1.0, r2 = 2.33, r3 = 1.0, d1 = 0.0 mm, d3 = 0.0 mm
a ( mm)
b (mm)
d2
(mm) Expt. (GHz)
[16]
Theory ( GHz) HFSS Bern.
[37]
Hamm. [16]
Present
57.0 38.0 3.175 2.31 2.335 (-1.082)
2.392 (-3.55)
2.38 (-3.030)
2.347 (-1.601) 45.5 30.5 3.175 2.89 2.870
(0.692)
2.926 (-1.246)
2.90 (-0.346)
2.863 (0.934) 29.5 19.5 3.175 4.24 4.385
(-3.42)
4.352 (-2.642)
4.34 (-2.358)
4.235 (0.117) 19.5 13.0 3.175 5.84 6.515
(-11.558)
6.132 (-5.000)
6.12 (-4.794)
5.935 (-1.643) 17.0 11.0 3.175 6.80 7.420
(-9.118)
7.007 (-3.004)
7.01 (-3.088)
6.773 (0.441) 14.0 9.0 3.175 7.70 8.670
(-12.597)
8.199 (-6.480)
8.19 (-6.363)
7.907 (-2.688) 12.0 8.0 3.175 8.51 9.612
(-12.95)
8.993 (-5.676)
9.01 (-5.875)
8.655 (-1.704) 10.5 7.0 3.175 9.32 10.42
(-11.803)
9.934 (-6.588)
9.97 (-6.974)
9.545 (-2.414) 9.0 6.0 3.175 10.25 11.070
(-8.000)
11.104 (-8.332)
11.18 (-9.073)
10.650 (-3.902) Total Average % Error 6.900 4.724 4.123 1.716
2.4 2.6 2.8 3.0 3.2
-80 -60 -40 -20 0 20 40 60
80 r3= 2 r2 r3= r2
Z
& X (ohm
)
f (GHz)
r3= 1.0
2.8 2.9 3.0 3.1 3.2
-80 -60 -40 -20 0 20 40 60
80 d3 = 2 d2 d3 = d2
R &
X (oh
m
)
f (GHz)
d3 = 0.0 mm
(i) (ii)
Fig. 4. Variation of dominant mode input impedance as a function of frequency for different thickness and permittivity of superstrate. a = 45 mm, b = 30 mm, r1 = 1.0, r2 = 2.33, d1 = 0.0 mm, d2 = 1.575 mm, x0 = 6.0 mm. i) d3 = 1.575 mm and r3 variable ii)r3 = 2.33 and d3
e e
r e T r
b
b
a
b
d
Q
R
)
4
cos
0
.
5
(
0 12 2(14)
2.3. Bandwidth efficiency and gain
The V.S.W.R less than 2.0 bandwidth, efficiency and gain are computed from [46] as
1
2
1
.
W
Q
TB
(15)
r T
Q
Q
(16)
r e r
G
b
k
G
0 2
84
.
1
(17)
0 4 8 12 16
0 25 50 75 100 125 150 175 200 225
Rr (o
hm
)
x
0(mm)
r3 = 1.0
= r2
= 2 r2
0 4 8 12 16
0 25 50 75 100 125 150 175 200
Rr (o
hm)
x
0 (mm)
d
3 = 0.0 mm
= d
2
= 2 d
2
(i) (ii)
Fig. 5. Variation of dominant mode input at resonance as a function of feed location for different thickness and permittivity of superstrate. Parameters as in Fig. 4. i) d3 = 1.575 mm and r3 variable ii) )r3 = 2.33 and d3 variable.
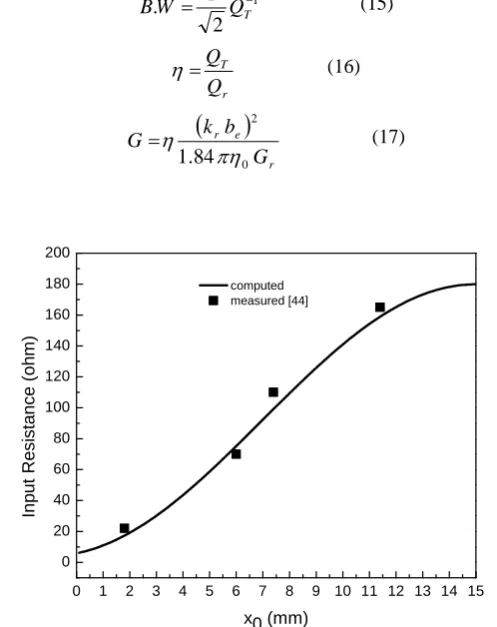
0 1 2 3 4 5 6 7 8 9 10 11 12 13 14 15
0 20 40 60 80 100 120 140 160 180 200
Inp
u
t Resi
sta
n
ce
(oh
m
)
x0 (mm)
computed measured [44]
Fig. 6. Input resistance at resonance as a function of feed location of a rectangular patch without radome. a = 45 mm, b = 30 mm, r1 = 1.0,
3.
Results and Discussions
In this section we have compared our computed values with different theoretical and experimental values
available in open literature.
3.1.
Resonant Frequency
In Table 1, we have compared our computed values with theoretical values [31] and [37] along with
measurements done by [37] for wide range of superstrate thickness variation. In this study the antenna
parameters are
a
= 33.0 mm,
b
= 28.5 mm,
r1=1.0,
r2=2.32,
r3= 2.32,
d
1=0.0 mm,
d
2= 3.18 mm. The
present models shows only 0.890% average error but 2.387% and 2.042% for [31] and [37] respectively with
respect to the measured values. So, the present model is closer to the experiments compared to the others.
The validity of present model is further verified with other experiments done by [18] and presented in table
2. For this study the antenna parameters are
a
= 33.25 mm,
b
= 32.25 mm,
r1= 1.0,
r2= 2.32,
r3= 2.32,
d
1=
0.0 mm,
d
2= 3.18 mm. From this comparative study it is understood that the present model is closer to the
measurements compared to the others.
The effect of superstrate parameters on resonant frequency is depicted in Fig.2. The resonant frequency is
lowered due to the imposed of superstrate. More lowering in resonant frequency is occurred for higher value of
superstrate thickness (
d
3) and permittivity (
r3).
The percentage shift of resonant frequency due to the application of superstrate with respect to the
unloaded patch is visualized in Fig.3. This figure indicates that the more percentage shift in resonant frequency
2.5 3.0 3.5 4.0
-80 -60 -40 -20 0 20 40 60 80
X
R & X
(ohm
)
f (GHz)
computed measured [44] R
Fig. 7. Input impedance as a function of frequency of a rectangular patch without radome. x0= 6.0 mm, and other parameters as in Fig. 6.
3.0 3.2 3.4 3.6 3.8 4.0 4.2 4.4 4.63.0
3.5 4.0 4.5 5.0
15 16 17 18 19 20 21 22 23 24 25
B.
W
%
fr (GHz)
d3 = 0.0 mm = 0.795 mm = 1.59 mm
QT
3.0 3.2 3.4 3.6 3.8 4.0 4.2 4.4 4.6
14 16 18 20 22 24 26
2.0 2.5 3.0 3.5 4.0 4.5 5.0
QT
fr (GHz)
r3 = 1.0
= 2.33 = 4.66
B.W %
(i) (ii)
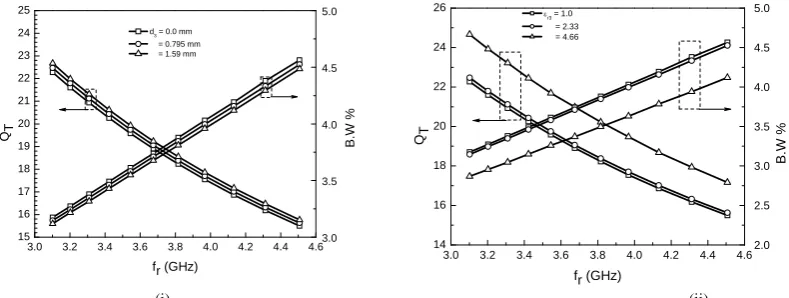
Fig. 8: Variation of total quality factor and % bandwidth as a function of resonant frequency for different thickness and permittivity of radome. a = 45 mm, b is variable, d1 = 0.0 mm, d2 = 1.59 mm, r1 = 1.0, r2 = 2.33, tan = 0.0005. i)r3 = 2.33and d3 variable ii) d3 = 0.795
is occurred for higher value of superstrate thickness (
d
3) and permittivity (
r3).
The present model is well valid for patch without superstrate. This is verified in table 3. The present model
is very close to the experiments compared to the other model for all aspect ratio.
3.2.
Input Impedance
The effect of superstrate on both resonant frequency and input impedance is depicted in Fig. 4. Due to
impose of superstrate the resonant frequency is shifted to the lower side but the input impedance is slightly
increased. The more change in both resonant frequency and input impedance is seen for higher values of
superstrate parameters.
In Fig. 5 we have studied the variation of input resistance at resonance with feed location for different
superstrate parameters. The input resistance increases with the increase of superstrate parameters.
The present model without superstrate is validated with the experiment was performed by [44] and
presented in Fig. 6 and 7. The computed theoretical curve well agreed the measured results.
3.3
Bandwidth and gain
Due to the application of superstrate the quality factor is increased and bandwidth is reduced compared to
the unloaded patch. More increase in quality factor and more decrease in bandwidth are observed for a
superstrate having higher values of thickness and permittivity. These phenomena are seen from Fig.8.
The effect of superstrate on gain for different thickness and permittivity is depicted in Fig.9. The gain is
increased more, for a superstrate whose thickness and permittivity is more high value.
4.
Conclusions
The effect of radome on resonant frequency, input impedance, bandwidth and gain is studied thoroughly. A
very simple and accurate CAD model is proposed to predict the effect of superstrate on such characteristics of
rectangular patch antenna. The computed values for wide range of superstrate parameters and patch sizes are
compared with different theories and measured values available in open literature and the present model reveals
close agreement with experiments compared to the other models. The superiority of present model is that
present model is also valid for a rectangular patch without superstrate. This model is very much important to
design a rectangular patch with radome for practical implementation.
References
[1] Wheeler, H.A. (1965): Transmission-line properties of parallel strips separated by a dielectric sheet, IEEE Trans. Microwave Theory Tech., 13, pp. 172–185.
[2] Yamashita, E.; Mittra, R. (1968): Variational method for the analysis of microstrip lines, IEEE Trans. Microwave Theory Tech., 16, pp. 251 – 256.
[3] Munson, R.E. (1974): Conformal microstrip antennas and microstrip phased arrays, IEEE Trans. Antennas Propagat., 22, pp. 74 – 78. [4] Wolff, I.; Knoppik, N. (1974): Rectangular and circular microstrip disk capacitors and resonators, IEEE Trans. Microwave Theory
Tech., 22, pp. 857- 864.
[5] Crampagne, R.; Ahmadpanah, M.; Guiraud, J.-L. (1978): A simple method for determining the Green’s function for a large class of MIC lines having multilayered dielectric structures, IEEE Trans. Microwave Theory Tech., 26, pp. 82-87.
[6] Bahl, I.J. (1979): Build microstrip antennas with paper-thin dimensions, Microwaves, 18, pp. 50-63.
[7] Lo, Y.T.; Solomon, D.; Richards, W.F. (1979): Theory and experiment on microstrip antennas, IEEE Trans. Antennas Propagat., 27, pp. 137- 145.
[8] Bahl, I.J.; Stuchly, S.S. (1980): Analysis of a microstrip covered with a lossy dielectric, IEEE Trans. Microwave Theory Tech., 28, pp. 104-109.
[9] M. Kirschning, R. H. Jansen, and N. H. L. Koster, “Accurate model for open end effect of microstrip lines,” Electron. Lett., vol. 17, pp. 123–125, Feb. 1981.
3.0 3.2 3.4 3.6 3.8 4.0 4.2 4.4 4.6
7.5 8.0 8.5 9.0
G (
d
B
)
fr (GHz) d3 = 0.0 mm
= 0.795 mm = 1.59 mm
3.0 3.2 3.4 3.6 3.8 4.0 4.2 4.4 4.6
7.5 8.0 8.5 9.0 9.5 10.0 10.5
G(dB)
fr (GHz)
r3 = 1.0
= 2.33 = 4.66
(i) (ii)
Fig.9. Variation of gain as a function of resonant frequency for different thickness and permittivity of radome. Parameters as in Fig 9. i)r3 =
[10] Newman, E.H.; Tulyathan, P. (1981): Analysis of microstrip antennas using moment methods, IEEE Trans. Antennas Propagat., 29(1), pp. 47- 53.
[11] Bahl, I. J.; Bhartia, P.; Stuchly, S. (1982): Design of microstrip antennas covered with a dielectric layer,” IEEE Trans. Antennas Propagat., 30, pp. 314–318.
[12] Pozar, D.M. (1982): Input impedance and mutual coupling of rectangular microstrip antennas, IEEE Trans. Antennas Propagat, 30, pp. 1191- 1196.
[13] Kirschning, M.; Jansen, R.H. (1982): Accurate model for effective dielectric constant of microstrip with validity up to millimeter-wave frequencies, Electron. Lett., 18, pp. 272–273.
[14] Despande, M.D.; Bailey, M.C. (1982): Input impedance of microstrip antennas, IEEE Trans. Antennas Propagat, 30, pp. 645- 650. [15] Sengupta, D.L. (1983): Approximate expression for the resonant frequency of rectangular patch antenna, Electron. Lett., 29, 834-835. [16] Chang, E.; Long, S.A.; Richards, W.F. (1986): Experimental investigation of electrically thick rectangular microstrip antennas, IEEE
Trans. Antennas Propagat., 34(6), pp. 767-772.
[17] Garg, R.; Long, S.A. (1987): Resonant frequency of electrically thick rectangular microstrip antennas,. Electron. Lett., 23, pp. 1149-1151.
[18] Bhattacharyya, A.; Tralman, T. (1988): Effects of dielectric superstrate on patch antennas, Electron. Lett., 24, pp. 356–358.
[19] Chew, W.C.; Liu, Q. (1988): Resonance frequency of a rectangular microstrip patch, IEEE Trans. Antennas Propagat., 36(8), pp. 1045-1056.
[20] Abboud, F.; Damiano, J.P.; Papiernik, A. (1988): Simple model for the input impedance of coax-fed rectangular microstrip patch antenna for CAD, IEE Proc. Microw. Antennas Propag., 135, pp. 323- 326.
[21] Abboud, F.; Damiano, J. P.; Papiernik, A. (1989): Accurate model for the input impedance of coax-fed rectangular microstrip antenna with and without airgap, Proc. ICAP., pp. 102-106.
[22] Schaubert, D.; Pozar, D.; Adrian, A. (1989): Effect of microstrip antenna substrate thickness and permittivity: comparison of theories and experiment, IEEE Trans. Antennas Propagat., 37, pp. 677-682.
[23] J. R. James and P. S. Hall, Handbook of microstrip antennas, Peter Peregrinus Ltd., London, United Kingdom 1989.
[24] Thouroude, D.; Himdi, M.; Daniel, J.P. (1990): .CAD oriented cavity model for rectangular patches. Electron. Lett., 26(13), pp. 842-844.
[25] Bhattacharya, A.K. (1990): Long rectangular patch antenna with a single feed, IEEE Trans. Antennas Propagat, 38(7), pp. 987- 993. [26] Ramahi, O.M.; Lo, Y.T. (1992): Superstrate effect on the resonant frequency of microstrip antennas,” Microwave Opt. Technol. Lett.,
5, pp. 254–257.
[27] Svaˇcina, J. (1992): Analysis of multilayer microstrip lines by a conformal mapping method, IEEE Trans. Microwave Theory Tech., 40, pp. 769–772.
[28] Fan, Z.; Lee, K.-F. (1992): Spectral domain analysis of rectangular microstrip antennas with an air gap, Microw. Opt.Tech. Lett., 5(7), pp. 315-318.
[29] Verma, A.; Rostamy, Z.(1993): Resonant frequency of uncovered and covered rectangular microstrip patch using modified Wolff model, IEEE Trans. Microwave Theory Tech., 41, pp. 109–116.
[30] Shavit,R. (1994): Dielectric cover effect on rectangular microstrip antenna array, IEEE Trans. Antennas Propagat., 42, pp. 1180–1184. [31] Zhong,S.-S.;Liu,G.;Qasim,G. (1994): Closed form expressions for resonant frequency of rectangular patch antennas with multi
dielectric layers, IEEE Trans. Antennas Propagat., 42, pp. 1360–1363.
[32] Vandenbosch,G.A.E.;Van de Capelle,A.R. (1994): Study of the capacitively fed microstrip antenna element, IEEE Trans. Antennas Propagat, 42(12), pp. 1648- 1652.
[33] Afzalzadeh,R.;Karekar, R.N. (1994): Characteristics of a rectangular microstrip patch antenna with protecting spaced dielectric superstrate, Microwave Opt. Technol. Lett.,7, pp. 62–66.
[34] K. F. Lee and W. Chen, Probe-Fed Microstrip Antenna, Advances in Microstrip and Printed Antennas, Wiley New York, 1997, p. 44. [35] Gauthier, G.P.;Courtay,A.;Rebeiz,G.M. (1997):Microstrip antennas on synthesized low dielectric constant substrates, IEEE Trans.
Antennas Propagat., 45(8), pp. 1310- 1314.
[36] Kara, M. (1998): Design consideration for rectangular microstrip antenna elements with various substrate thickness, Microwav. Opt. Technol. Lett., 19(2), pp. 111-121.
[37] Bernhard, J.T.;Tousignant,C.J. (1999): Resonant Frequencies of Rectangular Microstrip Antennas with Flush and Spaced Dielectric Superstrates, IEEE Trans. Antennas Propagat.,47(2), pp. 302 – 308.
[38] Basilio,L.I.;Khayat, M.A.;Williams, J.T.;Long,S.A. (2001): The dependence of input impedance on feed position of probe and microstrip line fed patch antennas, IEEE Trans. Antennas Propagat., 49(1), pp. 45-47,.
[39] Verma,A.K.;Nasimuddin (2001): The input impedance of rectangular microstrip patch antenna with iso/anisotropic substrate-superstrate,IEEE Microwave and wireless component letters, 11(11), pp.456-458.
[40] Mayhew-Ridgers,G.;Odendaal,J.W.;Joubert, J. (2004): Entire-domain versus sub domain attachment modes for the spectral-domain method of moments analysis of probe-fed microstrip patch antennas, IEEE Trans. Antennas Propagat, 52(6), pp. 1616- 1620.
[41] Rahmat-Samii, Y. (2007): Wearable antenna design processes based on simulations, Proc. CNC/USNC NorthAmerican Radio Science Meeting, Ottawa, Canada.
[42] Conway,G.A.;Cotton,S.L.;Scanlon, W.G. (2007): Design and characterization of integrated antennas for compact wearable wireless devices, Proc. CNC/USNC North American Radio Science Meeting, Ottawa, Canada.
[43] Alexopoulos,N.G.;Jackson, D.R. (1984): Fundamental superstrate (cover) effects on printed circuit antennas, IEEE Trans. Antennas Propagat.,32, pp. 807–816.
[44] Chattopadhyay,S.;Biswas,M.;Siddiqui,J.Y.;Guha, D.(2009): Input impedance of probe-fed rectangular microstrip antennas with variable air gap and varying aspect ratio, IET Microw. Antennas and Propagat.,3, pp. 1151-1156.
[45] Biswas,M.;Guha,D. (2009):Input impedance and resonance characteristic of superstrate loaded triangular microstrip patch, IET Microw. Antennas Propagat.,3, pp. 92 – 98.