OPTIMIZING SURFACE ROUGHNESS
IN TURNING OPERATION USING
TAGUCHI TECHNIQUE AND ANOVA
H.M.SOMASHEKARA*
Assistant Professor, Department of Mechanical Engineering, Dr. Ambedkar Institute of Technology, Bangalore, India.
Dr. N. LAKSHMANA SWAMY
Professor, Department of Mechanical Engineering,
University Visvesvaraya College of Engineering, Bangalore University, Bangalore, India
Abstract
The objective of this paper is to obtain an optimal setting of Turning parameters (Cutting speed, Feed and Depth of Cut) which results in an optimal value of Surface Roughness while machining Al 6351-T6 alloy with Uncoated Carbide Inserts. Several statistical modelling techniques have been used to generate models including Genetic Algorithm, Response Surface Methodology. In our study, an attempt has been made to generate a model to predict Surface Roughness using Regression Technique. Also an attempt has been made to optimize the process parameters using Taguchi Technique. S/N ratio and ANOVA analysis were also performed to obtain significant factors influencing Surface Roughness.
Keywords: Turning operation, Surface Roughness, Mathematical Model, ANOVA, Taguchi Technique.
1. Introduction
From past so many years it has been recognized that conditions during machining such as Cutting speed, Feed and Depth of Cut (DOC) should be selected to optimize the economics of machining operations. Manufacturing industries in developing countries suffer from a major drawback of not running the machine at their optimal operating conditions. Machining industries are dependent on the experience and skills of the machine tool operators for optimal selection of cutting conditions. In machining industries the practice of using hand book based conservative cutting conditions are in progress at the process planning level. The disadvantage of this unscientific practice is the decrease in productivity due to sub optimal use of machining capability. The literature survey has revealed that several researchers attempted to calculate the optimal cutting conditions in turning operations. Armarego and Brown used the concept of maxima / minima of differential calculus to
optimize machining variable in turning operation [1]. Brewer and Rueda have developed different monograms
which assist in the selection of optimum conditions [2]. Some of the other techniques which have been used to
optimize the machining parameters include goal programming [3] and geometrical programming [4]. Now a days
more attention is given to accuracy and Surface Roughness of the product in the industries. Surface roughness is the most important criteria in determining the machinability of the material. Surface Roughness and dimensional accuracy are the major factors needed to predict the machining performances of any machining
operation [5]. Most of the Surface Roughness prediction models are empirical and they are generally based on
experiments conducted in the laboratory. Also it is difficult in practice, to keep all factors under control as required to obtain the reproducible results [6]. Optimization of machining parameters increases the utility for machining economics and also increases the product quality to greater extent [7].
produce the best performance of the product or process under study. The optimal condition is selected so that influence of noise factors (uncontrollable factors) causes minimum variation to study performances. The orthogonal arrays, variance and signal to noise analysis are the essential tools of parameter design. Tolerance design is used to fine tune the results of parameter design by tightening the tolerance of the parameter with the significant influence on the product.
In this paper Taguchi DOE (Design of Experiments) approach is used to analyze the effect of Turning process parameters that is Cutting Speed, Feed and Depth of Cut on Surface Roughness. While machining Al 6351–T6 alloy using Uncoated Carbide Inserts and to obtain an optimal setting of these parameters that may result in optimizing Surface Roughness.
2. Taguchi technique
Genichi Taguchi is a Japanese Engineer who has been active in the improvement of Japans industrial product and processes since the late 1940s. He has developed both philosophy and methodology for the process or product quality improvement that depends mainly on statistical concepts and tools, especially statistically designed experiments. Many Japanese firms achieved great success by applying his methods. Taguchi has
received some of the Japan’s most prestigious awards for quality achievement, including the Deming Prize [8].
During the year 1986, he received the most prestigious award from the International Technology Institute- The W.F.Rockwell Medal for excellence in Technology. His major contribution is that he has combined engineering and statistical techniques to achieve rapid improvements in reducing the cost and increasing the quality level by optimizing product design and manufacturing processes. During 1983, Taguchi associated with top companies and institutes of USA (Ford motor company, XEROX, AT&T, Bell laboratories etc), Taguchi techniques are
called as Radial approach to quality, experimental design and engineering [9]. Taguchi technique refers to the
Parameter Design, Tolerance Design, Quality Loss Function, Design of Experiments using Orthogonal Arrays and Methodology applied to evaluate measuring systems [8].
Pignatiello [10] has identified two different aspects of Taguchi technique 1). The strategy of Taguchi. 2). Tactics of Taguchi. Taguchi strategy is the conceptual frame work for planning a process or product design experiment. Taguchi tactics refer to the collection of specific techniques used by Taguchi.
Taguchi has addressed Design, Engineering (offline) as well as Manufacturing (online) quality. This concept differentiates Taguchi technique from Statistical Process Control (SPC) which is purely an online quality control
technique [10, 11].Taguchi ideas can be reduced into two fundamental concepts 1). Quality losses should be
defined as deviation from target, not conformance to arbitrary specifications. [11] 2). To achieve high system
quality levels economically requires quality to be designed into product. Quality is designed, not manufactured, into the product. [12, 13]
Taguchi techniques represent a new philosophy. [14] Quality is measured by the deviation of a functional
characteristic from its target value. Noises (uncontrollable factors) will cause such deviations which results in loss of Quality. Taguchi techniques seek to remove the effect of Noises. The most important part of the Taguchi technique is quality loss function [15].Taguchi has found that a quadratic function (parabola) approximates the behavior of loss in many cases [9].when the quality characteristic of interest is to be maximized or minimized,
the loss function will become a half parabola [16].Loss occurs not only when the product is outside its
specification but also when product falls within its specification [17]. Taguchi has recommended signal to noise ratio (S/N ratio) as performance statistics [18]. Signal refers to the change in quality characteristics of a product under investigation in response to a factor introduced in the experimental design. Noise refers to the effect of external factors (uncontrollable parameters) on the outcome of the quality characteristics [19].
3. Turning process parameters
The process parameters that are affecting the characteristics of turned parts are 1).Cutting Tool parameters-Tool geometry and Tool material. 2).Work piece related parameters –Hardness, Metallography. 3).Cutting parameters –Cutting Speed, Feed, Depth of Cut. 4).Environmental parameters-Dry cutting, Wet cutting [20,21,22].
The following process parameters were selected for the present work: Cutting speed-(A), Feed-(B), Depth of Cut-(C), Tool Material- Uncoated Carbide Inserts, Work Material- Al 6351-T6 alloy, Environment-Dry Cutting.
The ranges of the selected process parameters were ascertained by conducting preliminary experiments using
The work material used for this experimentation is Al 6351- T6 alloy. This material is widely used in the aerospace industry.
Table 1: Chemical composition of Al 6351- T6
Element Ti Cu Fe Mg Zn Si Mn Others Balance
Wt% 0.2 0.1 0.5 0.4 0.2 0.7 0.4 0.15 Al
Table 2: Mechanical Properties of Al 6351- T6
Brinell Hardness Number (BHN) 95
Density 2.8 X 10³ kg/m3
% Elongation 20
Tensile Strength, Ultimate 250 MPa
Yield Strength 150 MPa
Poissons Ratio 0.330
Fatigue Strength 90 MPa
Shear Strength 200 Mpa
Table 3: Experimental Conditions
Work piece Material Al 6351- T6
Length of the work piece 75 mm
Diameter of the work piece 25.3 mm
Lathe Used CNC Lathe (ULTRALYNX-Pride-FANUC)
Inserts Used Uncoated Carbide Insert (KORLOY Make)
Insert Designation TNMG 16 04 08 (ISO Designation)
Tool holder MTJNL 25 * 25 * H 16 (ISO Designation)
Measuring Instrument Profilometer (Talysurf), Mitutoyo SJ-201P (for measuring Surface Roughness)
Environment DRY
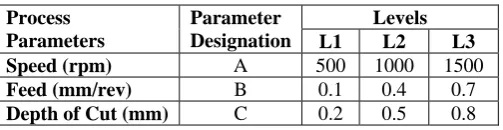
Table 4: Process parameters with their values at 3 levels
Process Parameters
Parameter Designation
Levels
L1 L2 L3 Speed (rpm) A 500 1000 1500
Feed (mm/rev) B 0.1 0.4 0.7
Depth of Cut (mm) C 0.2 0.5 0.8
The experimental layout was developed based on Taguchi’s Orthogonal Array Experimentation Technique.
An L9 Orthogonal Array Experimental layout was selected to satisfy the minimum number of experiment
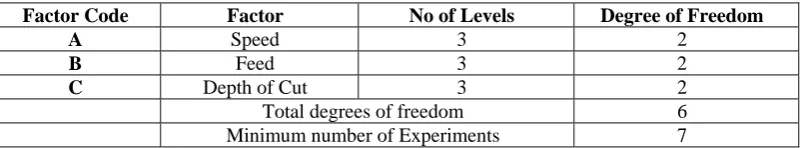
Table 5: Factors, Levels and Degrees of Freedom
Factor Code Factor No of Levels Degree of Freedom
A Speed 3 2
B Feed 3 2
C Depth of Cut 3 2
Total degrees of freedom 6
Minimum number of Experiments 7
Table 6: Standard L9 Orthogonal Array
Table 7: Standard L9 Array with Observations
Table 1 shows the chemical composition of the test specimen i.e., Al 6351- T6. Table 2 shows the mechanical
Trial No. Speed (rpm) Feed (mm/rev) DOC (mm)
1 1 1 1 2 1 2 2 3 1 3 3 4 2 1 2 5 2 2 3 6 2 3 1 7 3 1 3 8 3 2 1 9 3 3 2
Trial No. Speed
(rpm)
Feed (mm/rev)
DOC
(mm) Ra -1 Ra -2 Ra -3
Ra (Avg) (µm)
1 500 0.1 0.2 0.85 0.82 0.97 0.87
2 500 0.4 0.5 2.61 2.54 2.4 2.56
3 500 0.7 0.8 0.73 0.74 0.6 0.69
4 1000 0.1 0.5 3.56 3.85 3.66 3.69
5 1000 0.4 0.8 4.07 3.06 3.46 3.45
6 1000 0.7 0.2 2.7 2.87 2.96 2.78
7 1500 0.1 0.8 3.88 3.54 3.43 3.60
8 1500 0.4 0.2 3.91 3.61 3.73 3.66
Degrees of Freedom and Total Minimum number of Experiments to be conducted. Table 6 shows the standard L9 Orthogonal Array (OA). Table 7 shows the L9 OA with observed values for each parameter.
3.1 Regression Model for Surface Roughness:
Using Minitab Software the Regression Model has been developed for the above Experiment. The regression equation is
Ra(µm) = 1.69 + 0.00146 Speed (rpm) – 1.92 Feed (mm/rev) + 0.24 DOC (mm)
Table 8: General Linear Model for Surface Roughness Ra
Factor Type Levels Values Speed Fixed 3 500, 1000, 1500
Feed Fixed 3 0.1, 0.4, 0.7
DOC Fixed 3 0.2, 05, 0.8
Table 9: Analysis of Variance (ANOVA) for Surface Roughness Ra
Source DOF Seq SS Adj SS Seq MS F P Rank Speed 2 6.093 6.093 3.047 2.98 0.251 1
Feed 2 4.309 4.309 2.155 2.11 0.322 2
DOC 2 0.031 0.031 0.016 0.02 0.985 3
Error 2 2.043 2.043 1.021
Total 8 12.477 S = 1.01063 R-Sq = 83.63% R-Sq(adj) = 34.51%
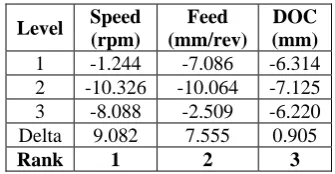
Table 10: Response Table for Signal to Noise Ratios Smaller is better
Level Speed (rpm)
Feed (mm/rev)
DOC (mm)
1 -1.244 -7.086 -6.314
2 -10.326 -10.064 -7.125
3 -8.088 -2.509 -6.220
Delta 9.082 7.555 0.905
1500 1000 500 0.0 -2.5 -5.0 -7.5 -10.0 0.7 0.4 0.1 0.8 0.5 0.2 0.0 -2.5 -5.0 -7.5 -10.0 Speed (rpm) M e a n of S N r a ti os Feed (mm/rev) DOC (mm)
Main Effects Plot for SN ratios
Data Means
Signal-to-noise: Smaller is better
Graph 1: S/N ratio values for Surface Roughness
4.
Conclusion:Following are the conclusions drawn based on the test conducted on Al 6351- T6 alloy during Turning operation with Uncoated Carbide Insert.
i) From the results obtained a Regression Model has been developed for Surface Roughness. From
this equation we can predict the value of Surface Roughness if the values of Cutting Speed, Feed and Depth of Cut are known.
ii) From ANOVA Table 9 and Response Table 10 for Signal to Noise ratios, based on the ranking it
can be concluded that Speed has a greater influence on the Surface Roughness followed by Feed. Depth of Cut had least influence on Surface Roughness.
iii) The validation experiment confirmed that the error occurred was less than 2.0 % between equation
and actual value.
iv) The optimal settings of process parameters for optimal Surface Roughness are:
Speed (500 rpm), Feed (0.7 mm/rev), and DOC (0.8 mm).
This research gives us how to use Taguchi’s parameter design to obtain optimum condition with lowest cost, minimum number of experiments and Industrial Engineers can use this method. The research can be extended for other materials using Tool Nose Radius, Lubricant, Material Hardness etc as parameters.
References
[1] E.J.A Armarego and R.H Brown, The machining of metals prentice Hall, 1969
[2] R.C Brewer and R. Rueda , “A Simplified Approch to the optimum selection of machining parameters ", Engines Digest
vol.24,NO.9,PP 133-150
[3] R.M Sundaram, “An application of Goal programming technique in metal cutting”,Int.j.prod.Res.,vol.16,NO5,1978,PP375-382
[4] P.G Petropoulos, “optimum selection of machining rate variable by Geometric programming ”,Int .J .prod .Res,vol.11,NO,4,1973 PP
305-314
[5] A.Mital, M.Mehta, “surface roughness Prediction models for fine turning”, International journal of production research 26 (1988)
[7] R.Azouzi,M.Guillot, “on-line optimization of the turning using an inverse process neuro controller translation” ASME , journal of manufacturing science and engineering 120 (feb)(1998)101-107
[8] Sullivan L.P, Qual program,(1987)76-79
[9] Barker.T.B , Engineering quality by design ,(Marcel Dekker ,Inc, newyork ),1990
[10] Ryan Thomas P, Qual prog , (1988) 34-36
[11] Benton W C, Int J Prod Res , 29(1991) 1761-1770
[12] Daetz D ,Qual Progr ,20(1987) 54-61
[13] Taguchi G,Quality engineering in production systems ,(M C Graw-Hill ,Newyork), 1989
[14] Lin Paul K H, sullivan L P & Taguchi G ,Qual progr,(1990) 55-59.
[15] Barker T B, Qual Progr,(1986) 33-42.
[16] Byrne D.M & Taguchi S, Qaul progr,(1987) 19-26.
[17] Ross philip J, Taguchi techniques for quality engineering (M C Graw-Hill book company, Newyork), 1996.
[18] Kackar R.N ,J Qual Technol ,17(1985) 176-188.
[19] Roy Ranjit .K ,A primer on Taguchi method ,(van Nostrand Reinhold ,Newyork),1990.
[20] Singh H & Kumar P,Indian .J. Eng Mater sci,11(2004)19-24
[21] Singh H & Kumar P,productivity,44(2003) 43-49.
[22] Singh H & Kuamr P,productivity,(in press).
[23] H Singh, “optimization of machining parameter for turned parts through Taguchi’s technique” , Ph .D. Thesis,Kurukshetra university
,Kurukshetra,India,2000.
Author’s Profile