Iran J Public Health, Vol. 46, No.5, May 2017, pp.682-692
Original Article
An Efficient Predictive Model for Myocardial Infarction Using
Cost-sensitive J48 Model
Atefeh DARAEI, *Hodjat HAMIDI
Dept. of Information Technology, Faculty of Industrial Engineering, K.N. Toosi University of Technology, Tehran, Iran
*Corresponding Author: Email: [email protected]
(Received 02 Aug 2016; accepted 17 Dec 2016)
Introduction
Acute Coronary Syndrome (ACS) is a type of ischemic heart diseases that include Myocardial Infarction (MI). It occurs when the coronary ar-teries, narrowed by atherosclerosis, abruptly de-crease the blood flow (1). Cholesterol and lipid sediment progressively collects throughout the arteries. This commonly occurs in individuals with genetic susceptibility to atherosclerosis, high blood pressure, an inactive lifestyle, and in those who are overweight or have obesity. The areas with sediment build-up experience the growth of fibrous tissue and calcification, causing the for-mation of lipid atherosclerosis plaques. Atheros-clerosis plaques reduce lumens in the vessels and diminish or block blood flow (2).
MI occurs immediately after creation of throm-bosis at sites previously afflicted with atheroscle-rosis. When coronary artery blood flow ceases after blockage, a small amount of blood will col-lect in the surrounding vessels. This process is known as MI (1-2). MI is considered as a main cause of death worldwide (3). Cardiovascular dis-eases are responsible for 30% of deaths world-wide (4) and 40% of deaths in Iran. Among the cardiovascular diseases, MI, commonly known as heart attack (5), is the most common (6).
Data mining is the process of exploring the pat-terns and knowledge from large datasets (7). Classification, in data mining, finds models that predict the class label for data and predict labels
Abstract
Background: Myocardial infarction (MI) occurs due to heart muscle death that costs like human life, which is higher
than the treatment costs. This study aimed to present an MI prediction model using classification data mining me-thods, which consider the imbalance nature of the problem.
Methods: We enrolled 455 healthy and 295 myocardial infarction cases of visitors to Shahid Madani Specialized
Hos-pital, Khorramabad, Iran, in 2015. Then, a hybrid feature selection method included Weight by Relief and Genetic algorithm applied on the dataset to select the best features. After selection of the features, the metacost classifier ap-plied on the sampled dataset. Metacost made a cost sensitive J48 model by assigning different costs ratios for misclas-sified cases; include 1:10, 1:50, 1:100, 1:150 and 1:200.
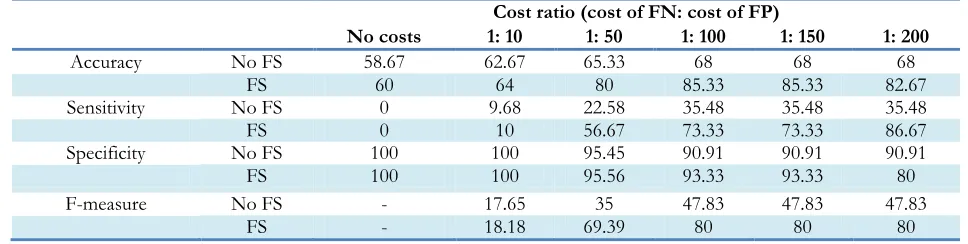
Results: After applying the model on the imbalanced dataset, the cost ratio 1:200 led to the best results in comparison to not using feature selection and cost sensitive model. The model achieved sensitivity, F-measure and accuracy of 86.67%, 80% and 82.67%, respectively.
Conclusion: Experiments on the real dataset showed that using the cost-sensitive method along with the hybrid
fea-ture selection method improved model performance. Therefore, the model considered a reliable Myocardial Infarction prediction model.
for unclassified data to distinguish the data be-longing to each class (8). Traditional classification algorithms decrease classification error by placing instances in true classes.
Heart disease prediction models using data min-ing methods, such as K-NN (9), SVM (10), ANN (11), NB (12), Decision Tree (13), and Random Forest (14) have been ran a lot, but the researches in predicting MI is very limited. A model was proposed utilized neural network for predicting acute MI in patients, who referred to emergency with chest pain (15). The dataset con-sisted of 2204 and 40 features, in which 1843 cases had not experienced MI. Finally, sensitivity and specificity of the model were obtained 94.5% and 95.9%, respectively. A c4.5 tree was used for predicting different types of heart diseases, such as MI (16). The data used in this study were the information obtained from 1200 cases, in 416 cases had MI. A c4.5 decision tree was used, rule set classification, Neuro-Fuzzy, Bayesian Net-work, SVM and time series modeling to predict MI (17). The accuracy and sensitivity of MLP were achieved 89.7% and 90.17%, respectively. In addition, four algorithms were used, namely Naïve Bayes, Decision Tree, MLP and Rule-based Classification, to predict heart disease (18). They applied the algorithms on a heart disease dataset from UCI repository. The best accuracy is obtained using Naïve Bayes that is equal to 84.14%. Masethe and masethe (19) utilized five classification algorithms, J48, Bayesian Network, Naïve Bayes, Classification and Regression Tree and REPTREE, for predicting MI. The data used for this study included 90 MI cases and 18 with-out MI. After comparing the results, J48, NB, and CART achieved an accuracy of 99.07%. An ECG classification model was proposed for de-tecting MI in (20). Two methods, SVM and MLP were applied to data. The accuracies obtained for SVM and MLP were 90.17% and 82.14%, respec-tively. A model was presented in (21) for detect-ing MI and location, which uses K-NN and SVM which is applied to PTB dataset. The dataset in-cluded 290 cases, where 148 of them had MI. Accuracy, sensitivity, and specificity for SVM were 96%, 93% and 99%, respectively.
Traditional classification methods obtained prop-er accuracy, but they have been applied on almost balanced datasets. In these methods, the number of cases with disease is equal to the number of healthy cases and even more than healthy cases. Generally, if the ratio of smaller class to prevail-ing class is 1:100, 1:1000 or larger, it can be con-sidered as an imbalance problem (22). Since the results in data mining prediction problems tend to larger classes influenced by the prevailing class, the results of these predictions cannot be consi-dered appropriate. The cost sensitivity was not considered in the models, but for MI prediction, misclassification of a healthy instance only entails additional laboratory costs or angiography side effects, while misclassification of an MI case as healthy could incur costs that involve missing the opportunity for timely use of medicines and treatments and even loss of life. Therefore, the contribution of this study is considering the im-balanced nature of MI dataset using a cost-sensitive classification model to predict MI. Moreover, a hybrid feature selection method, which uses a weighting method and Genetic algo-rithm along with the cost sensitive model are another considered the other contribution, to make more improvement in the performance. A cost-sensitive model has not been presented for prediction of MI in previous works. The goal of the present study was to determine how a cost-sensitive model could be constructed and em-ployed for MI prediction.
Materials and Methods
Data Description
Dataset obtained from Shahid Madani Specia-lized Hospital of Khorramabad, Iran, in 2015. This dataset included the information obtained from750 patients of the mentioned hospital, in which 295 cases were patients with MI and 455 cases were healthy. Dataset included 92 regular features and 1 label feature. These features were demographic, examinations, symptoms, laborato-ry tests, main coronalaborato-ry arteries, and ECG fea-tures, namely Age, Body Mass Index (BMI), Sex, Hypertension (HTN), Diabetes (DM), Smoking, Family History (FH), Obesity, Chronic Renal Failure (CRF), Cerebrovascular Accident (CVA), Thyroid, Airway disease, Hyperlipidemia (HLP), Troponin I, C-reactive protein (CRP), Total Cho-lesterol, White Blood Cells (WBC), Congestive Heart Failure (CHF), Fasting Blood Sugar (FBS), Creatinine (Cr), Lactate dehydrogenase (LDH), Creatine phosphor-kinase (CPK), Triglyceride (TG), Low-density Lipoprotein (LDL), High-density Lipoprotein (HDL), Blood Urea Nitrogen (BUN), Erythrocyte Sedimentation Rate (ESR), Hemoglobin (Hb), Lymphocyte, Platelet, Ejec-tion FracEjec-tion (EF), Potassium (K), Sodium (Na), Systolic Blood Pressure (SBP), Diastolic Blood Pressure (DBP), Heart rate, Edema, Fatigue and weakness, Lung rales, Typical Chest-Pain (C.P), Distribution of pain to arms and neck, Dyspnea, Atypical Pain (C.P), Non-anginal Chest-Pain (C.P), Exertional Chest-Chest-Pain (C.P), Left An-terior Descending Artery (LAD), Right Coronary Artery (RCA), Left Coronary Artery (LCA), T inversion leads (I, II, III, avR, avL, avF, V1, V2, V3, V4, V5, V6), ST Depression leads (I, II, III, avR, avL, avF, V1, V2, V3, V4, V5, V6), ST Ele-vation leads (I, II, III, avR, avL, avF, V1, V2, V3, V4, V5, V6) and Poor R Progression leads (V1, V2, V3, V4, V5, V6). For each ECG-related fea-ture, the leads of the features are considered as separate features.
Preprocessing
Real data are usually incomplete and inconsistent (8). The data cleaning method used in the present
study was handling missing values. Moreover, for data transformation task, normalization method applied to the data, in which features’ values were scaled in a smaller range, like [0, 1].
All procedures performed in studies involving human participants were in accordance with the ethical standards of the institutional and/or na-tional research committee and with the 1964 Hel-sinki declaration and its later amendments or comparable ethical standards.
Feature Selection
Feature selection is a popular method for data reduction, in which irrelevant features of the data is removed. Eliminating the redundant features not only results in more efficiency (23) but also simplifies the understanding and interpretation of the problem (8). Hybrid methods might lead to better performance compared to individual me-thods (24). Using Evolutionary Algorithms for feature selection results in better accuracy of the classification algorithm (25).
In this study, a hybrid feature selection used to achieve the best subset of features in order to improve the performance. Genetic algorithm (GA) is one of the evolutionary algorithms in-spired from nature and tries to find optimized solutions for problems (26). GA has an iterative process, which selects the best ones. By applying crossover and mutation operators afterward, a new child population, with the same size, is gen-erated (27). The other part was “Weight by Re-lief” operator, in Rapidminer software. Weight by Relief assesses the quality of features for their power in recognizing the cases with the same class and different classes, which are adjacent. It measures the relevance between features by cal-culating the relevance between features and com-paring the values of the feature for the nearest example in the same class and in a different class (28).
J48 Decision Tree
trained classified cases. In decision trees, the leaves represent the classes (29-30).
Cost-sensitive Learning
In the real world, the cost of wrong labeling in some fields, like medical problems, varies for dif-ferent classes. For example, the cost of false clas-sification of a patient as a healthy person is much more than misclassification a healthy person. As-sign costs to classifiers is one of the most effec-tive methods for handling imbalanced datasets (31). In cost-sensitive algorithms, the cost of false classification of a positive instance as negative
and the cost of false classification of a negative instance as positive is different (32). Therefore, misclassification cost plays an important role in some critical problems (33).
In cost-sensitive classification, a cost matrix con-sidered, as shown in Table 1 C (0, 1), C (1, 0), C (0, 0) and C (1, 1) were the costs of False Nega-tive, False PosiNega-tive, True Negative and True Posi-tive, respectively. Cost-sensitive classification used for classification of imbalanced datasets, in which the class with much fewer cases, consi-dered as positive and the other class with much more cases, called negative (34).
Table 1: Cost matrix in cost sensitive methods
Cost Matrix Actual Negative Actual Positive
Predicted Negative C(0, 0) C(0, 1) Predicted Positive C(1, 0) C(1, 1)
Metacost
Domingo in (35) declares the purpose of Metacost as adapting the traditional cost-sensitive classifiers. The traditional classifiers were error-based, but Metacost gives different costs to them (36). This method merges a traditional algorithm in a process that minimizes the cost. This way, the algorithm is changed to a cost-sensitive algo-rithm. In these methods usually, higher cost is given to FN compared to FP (37).
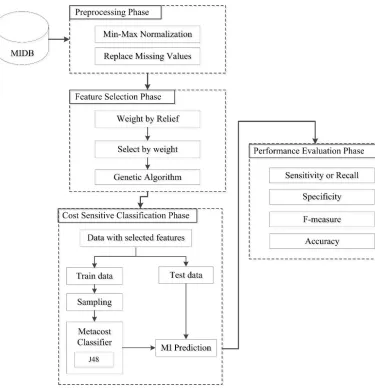
Proposed Methodology
The proposed method employed weight by relief and GA for feature selection. Metacost applied in classification phase, which made J48 cost sensi-tive (Fig. 1).
Phase 1: preprocessing
After collecting the data, the missing values re-placed with the average of the other feature val-ues. The data then normalized using min-max normalization (8). The range for normalization was [0, 1].
Phase 2: Feature Selection
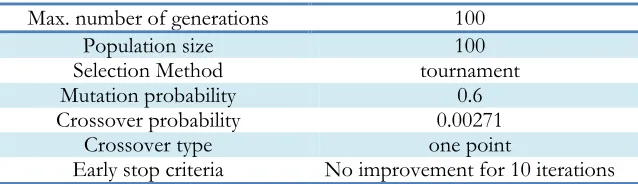
First, the operator Weight by Relief applied to the normalized features. Then “Top P%” selec-tion used at P=0.7, meaning that features with weights in the top 0.7 selected. In the second step, GA applied to the features selected in the previous step and selected the final group of best features (Table 2). The method, presented in (38), used to obtain the probability of mutation using the relation 1/(4 × no. of features).
Phase 3: Cost-Sensitive Classification
Table 2: Parameter setting for GA
Max. number of generations 100
Population size 100
Selection Method tournament Mutation probability 0.6 Crossover probability 0.00271
Crossover type one point
Fig. 1:Structure of proposed model
For cost-sensitive classification, first, the data divided into training and testing sets. The training data comprised 90% of the data and the remain-ing 10% used as test data. In Iran, MI occurs at a rate of 14 per 1000 individuals (39). Initially, the MI cases in the dataset were similar to the num-ber of healthy cases; thus, the MI cases sampled at a ratio of 0.014 for MI and 1 for healthy cases. Metacost with embedded J48 then applied for classification. Metacost used to make the J48 al-gorithm cost-sensitive. For J48 alal-gorithm, the default setting parameters selected in Rapidminer. For Metacost, the maximum number of iterations set to 100. Since the performance of the models is affected by different costs (40), the cost for false positive (FP) set to one, but costs of 10, 50,
100, 150 and 200 considered for false negative (FN).
Phase 4: Performance Evaluation
Many measures exist for evaluating classification measures. Accuracy is the ratio of correctly classi-fied cases. It calculated using Equation [1] as:
TP TN Accuracy
TP TN FP FN
[1]
Accuracy was not appropriate for evaluating im-balance datasets (8); thus, sensitivity (or recall), specificity and F-measure (8) used to evaluate Metacost classification performance.
the rate of correct diagnosis of disease (41). Spe-cificity provides the ratio of negative instances that are correctly classified and demonstrates the tendency to detect healthy instances. Sensitivity and specificity obtained using Equations [2] and [3] as:
TP Sensitivity
TP FN
[2]
TN Specificity
TN FP
[3]
The F-measure is the average of the recall and precision measures. It obtained using Equation [4] as:
2*precision recall*
F measure
precision recall
[4] Which precision obtained using Equation [5] as:
TP Precision
TP FP
[5]
Results
Experimental Results
Rapidminer (ver. 7.1.001) used to implement the model. After selecting the top 70% of the data, this operator selected 64 features. GA then se-lected the 62 best final features namely Troponin I, ST Elevation I, ST Elevation avL, ST Elevation
avF, ST Elevation III, ST Elevation II, ST Eleva-tion V2, ST ElevaEleva-tion V4, ST ElevaEleva-tion V3, ST Elevation V1, T inversion V3, T inversion III, T inversion V2, T inversion avF, T inversion V6, T inversion avL, T inversion V5, T inversion V1, T inversion V4, T inversion II, T inversion I, Poor R Progression V4, Poor R Progression V2, Poor R Progression V3, ST Depression V3, ST De-pression V2, ST DeDe-pression V1, ST DeDe-pression III, ST Depression avR, ST Depression V4, ST Depression avF, Non-anginal C.P, HLP, Distri-bution to arms and neck, SBP, Typical C.P, RCA, LAD, LCX, DM, Sex, EF, FH, Lymphocyte, Dyspnea, LDL, TG, Fatigue and weakness, Smoker, Atypical C.P, HDL, LDH, Age, Lung rales, CRP, BUN, Total cholesterol, HTN, Exer-tional C.P, CPK, DBP.
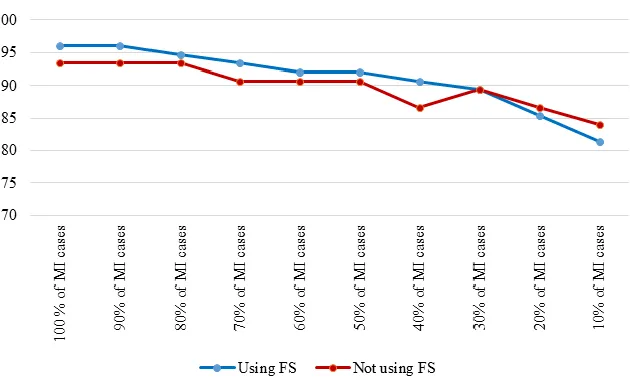
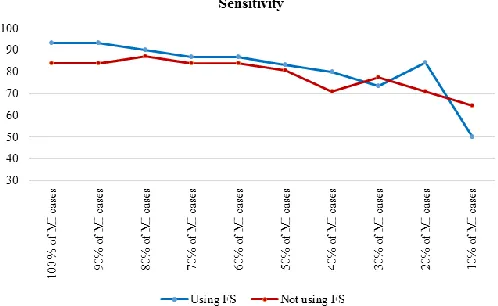
To assess the effect of the size of the positive class on model performance, the results of the J48 decision tree for the cost-insensitive state presented. In this case, all healthy cases used, but the number of MI cases gradually reduced. Table 3 shows the results of cost insensitive J48 deci-sion tree, before and after feature selection. For easier understanding, the accuracy and sensitivity, respectively, during the decrease for the dataset are shown in Fig. 2, 3.
Fig. 3:Sensitivity of cost insensitive J48 in decreasing Mi cases
The proposed MI prediction model tested for the new dataset in which there were 7 MI cases. Table 4 shows the results of performance analysis of model implementation. Although accuracy was
not the main performance criterion, the other criteria’s results also provided. Fig. 4-6 show the trends for sensitivity and F-measure before and after feature selection.
Fig. 4:Accuracy of proposed cost sensitive model
Fig. 6:Accuracy of proposed cost sensitive model
Table 3:Performance of cost insensitive J48 in decreasing MI cases
No FS FS
Accuracy
(%) Sensitivity (%) Specificity (%) Accuracy (%) Sensitivity (%) Specificity (%)
100 % of MI cases 93.33 83.87 100 96 93.33 97.78
90% of MI cases 93.33 83.87 100 96 93.33 97.78
80% of MI cases 93.33 87.10 97.73 94.67 90 97.78
70% of MI cases 90.67 83.87 95.45 93.33 86.67 97.78
60% of MI cases 90.67 83.87 95.45 92 86.67 95.57
50% of MI cases 90.67 80.65 97.73 92 83.33 97.78
40% of MI cases 86.67 70.97 97.73 90.67 80 97.78
30% of MI cases 89.33 77.42 97.73 89.33 73.33 100
20% of MI cases 90.67 80.65 97.73 84 66.67 95.56
10% of MI cases 84 64.52 97.73 80 50 100
Table 4:The results of the proposed cost sensitive J48 model
Cost ratio (cost of FN: cost of FP)
No costs 1: 10 1: 50 1: 100 1: 150 1: 200
Accuracy No FS 58.67 62.67 65.33 68 68 68
FS 60 64 80 85.33 85.33 82.67
Sensitivity No FS 0 9.68 22.58 35.48 35.48 35.48
FS 0 10 56.67 73.33 73.33 86.67
Specificity No FS 100 100 95.45 90.91 90.91 90.91
FS 100 100 95.56 93.33 93.33 80
F-measure No FS - 17.65 35 47.83 47.83 47.83
FS - 18.18 69.39 80 80 80
Discussion
Feature selection improved performance im-provement; however, Fig. 2 and 3 indicated that the effect of feature selection diminished, as the number of positive cases decreased. The accuracy and sensitivity of the model were higher than fea-ture selection when 20% and 10% of the MI
achieved a high F-measure score by increasing the cost, which indicated that both the precision and robustness of the model increased.
Feature selection combined with a cost-sensitive model significantly improved the accuracy, sensitivity, and F-measure. A high specificity score was desirable, but an increase in costs de-creased specificity. Although the increase in costs for FN improved performance, increasing the costs did not always improve the performance. In implementation of J48, after assigning a cost ratio of 1:250 to the model, the sensitivity, specificity and accuracy scores were 100%, 0%, and 40%, respectively. In this case, despite very appropriate sensitivity, the specificity was zero, which cannot be considered good performance of the model. Based on the importance of trade-off between sensitivity and specificity, the implementation of cost-sensitive J48 at a cost ratio of 1:200 pro-vided the best model. At last, the cost-insensitive models could not predict MI cases in the imba-lanced datasets, while the appropriate sensitivity of the proposed model indicated satisfactory pre-diction. A limitation of the present study was the unavailability of the features of Q-wave and Rhythm in the dataset. Future research will ex-pand the model with hybrid classification algo-rithms.
Conclusion
Feature selection improved the performance of both cost-insensitive and cost-sensitive models. Moreover, making J48 cost-sensitive improved performance over traditional classifiers and achieved a better trade-off between sensitivity and specificity. The advantage of the present model is enhancement of sensitivity for MI pre-diction, which means the model has higher ten-dency to predict MI cases correctly.
Ethical considerations
Ethical issues (Including plagiarism, informed consent, misconduct, data fabrication and/or fal-sification, double publication and/or submission,
redundancy, etc.) have been completely observed by the authors.
Acknowledgements
We thank the personnel of Shahid Madani Spe-cialized Hospital for assistance with collecting the data. We would like to thank Dr. Kooshki for assistance with medical fields, and Dr. Mokfi and Dr. Alizadehsani for their guidance and sugges-tions that greatly improved the manuscript. The authors declare that he has no conflict of interest.
References
1. Longo D, Fauci A, Kasper D, Hauser S, Jame-son J, Loscalzo J (2011). Harrison's principles of internal medicine. 18th ed. McGraw-Hill
Educa-tion, New York, pp: 1798-2035.
2. Hall J, Guyton A (2015). Guyton and Hall textbook of medical physiology. 13th ed. Elsevier,
Philadel-phia, PA, pp.: 109-152.
3. Mohamadpoor T, Nabavinia MS, Gholoobi A, Alavi MS, Meshkat Z (2012). Enteroviruses in Acute Myocardial Infarction. Iran J Public Health, 41(8):71-74.
4. Oliver MF, Opie LH (2014). Management of acute myocardial infarction. Lancet, 383(9915):409-410.
5. Patel V, Upaganlawar A, Zalawadia R, Balara-man R (2010). Cardioprotective effect of me-latonin against isoproterenol induced myo-cardial infarction in rats: a biochemical, elec-trocardiographic and histoarchitectural evalu-ation. Eur J Pharmacol, 644(1): 160-168. 6. Harper K, Armelagos, G (2010). The changing
disease-scape in the third epidemiological transition. Int J Environ Res Public Health, 7(2): 675-697.
7. Gorunescu F (2011). Data Mining: Concepts, models and techniques (Vol. 12). Springer-Verlag Berlin Heidelberg, pp.: 45-56.
8. Han J, Jian P, Kamber M (2012) Data mining: con-cepts and techniques. Elsevier, Haryana, India, pp.: 84-370.
Proceedings of the 49th Annual Convention of the Computer Society of India (CSI). Eds, Satapathy, Raju, Govardhan and Mandal. 1st ed, Springer
International Publishing, pp.: 371-384. 10. Bashir S, Qamar U, Khan F, Javed M (2014).
MV5: A Clinical Decision Support Frame-work for Heart Disease Prediction Using Ma-jority Vote Based Classifier Ensemble. Arab J Sci Eng, 39(11): 7771-7783.
11. Bashir S, Qamar U, Khan F (2015). BagMOOV: A novel ensemble for heart disease prediction bootstrap aggregation with multi-objective optimized voting. Australas Phys Eng Sci Med, 38(2):305-323.
12. Kumar, Sahoo G (2015). Classification of Heart Disease Using Naïve Bayes and Genetic Al-gorithm. In: Computational Intelligence in Data Mining. Eds, Jain, Behera, Mandal and Moha-patra. 1st ed. Springer India, pp.: 269-282.
13. Bashir S, Qamar U, Khan F (2016). A Multicrite-ria Weighted Vote-Based Classifier Ensemble for Heart Disease Prediction. Computational In-telligence, 32(4): 615-645.
14. Masetic Z, Subasi A (2016). Congestive heart failure detection using random forest classifi-er. Comput Methods Programs Biomed, 130:54-64. 15. Baxt W, Shofer F, Sites F, Hollander J (2002). A
neural computational aid to the diagnosis of acute myocardial infarction. Ann Emerg Med, 39(4):366-373.
16. Karaolis M, Moutiris J, Pattichis C (2008). As-sessment of the risk of coronary heart event based on data mining. In: 8th IEEE Interna-tional Conference on BioInformatics and BioEngineer-ing, 2008. BIBE 2008. IEEE, Athens, pp.: 1-5. 17. Srinivas K, Rani B, Govrdhan A (2010).
Applica-tions of data mining techniques in healthcare and prediction of heart attacks.
IJCSE, 2(2):250-255.
18. Srinivas K, Raghavendra Rao G, Govardhan A (2010). Analysis of coronary heart disease and prediction of heart attack in coal mining re-gions using data mining techniques. In: 5th In-ternational Conference on Computer Science and Edu-cation (ICCSE), IEEE, Hefei, pp.: 1344 – 1349.
19. Masethe D, Masethe A (2014). Prediction of heart disease using classification algorithms. In: World Congress on Engineering and Computer Science (WCECS 2014), San Francisco, USA, pp.: 22-24.
20. Bhaskar N (2015). Performance Analysis of Support Vector Machine and Neural Net-works in Detection of Myocardial Infarction.
Procedia Comput Sci, 46:20-30.
21. Sharma L, Tripathy R, Dandapat S (2015). Mul-tiscale Energy and Eigenspace Approach to Detection and Localization of Myocardial In-farction. IEEE Trans Biomed Eng, 62:1827-1837.
22. Sun Y, Kamel M, Wong A, Wang Y (2007). Cost-sensitive boosting for classification of imbalanced data. Pattern Recogn, 40(12):3358-3378.
23. Tallón-Ballesteros A, Hervás-Martínez C, Ri-quelme J, Ruiz R (2013). Feature selection to enhance a two-stage evolutionary algorithm in product unit neural networks for complex classification problems. Neurocomputing, 114:107-117.
24. Inbarani H, Azar A, Jothi G (2014). Supervised hybrid feature selection based on PSO and rough sets for medical diagnosis. Comput Me-thods Programs Biomed, 113(1):175-185.
25. Uğuz H (2011). A two-stage feature selection method for text categorization by using in-formation gain, principal component analysis and genetic algorithm. Knowl-Based Syst, 24(7):1024-1032.
26. Inbarani H, Bagyamathi M, Azar A (2015). A novel hybrid feature selection method based on rough set and improved harmony search.
Neural Comput Appl, 26(8):1859-1880. 27. Tan K, Yu Q, Heng C, Lee T (2003).
Evolutio-nary computing for knowledge discovery in medical diagnosis. Artif Intell Med, 27(2):129-154.
28. Min S, Lee J, Han I (2006). Hybrid genetic algo-rithms and support vector machines for bankruptcy prediction. Expert Syst Appl, 31(3):652-660.
29. Pashaiasl M, Khodadadi K, Kayvanjoo AH, Pa-shaei-asl R, Ebrahimie E, Ebrahimi M (2016). Unravelling evolution of Nanog, the key tran-scription factor involved in self-renewal of undifferentiated embryonic stem cells, by pat-tern recognition in nucleotide and tandem re-peats characteristics. Gene, 578(2):194-204. 30. Ramya M, Lokesh V, Manjunath T, Hegadi R
31. Wang B, Japkowicz N (2009). Boosting support vector machines for imbalanced datasets.
Knowl Inf Syst, 25(1):1-20.
32. Sammut C, Webb G (2011). Encyclopedia of ma-chine learning. Springer, New York, pp.:231-233.
33. Elkan C (2001). The Foundations of Cost-sensitive Learning. In: Proceedings of the Seven-teenth International Joint Conference on Artificial In-telligence, Seattle, WA, pp.: 973-978.
34. Japkowicz N, Stephen S (2002). The class imbal-ance problem: a systematic study. Intell Data Anal, 6(5): 429–450.
35. Domingos P (1999). MetaCost: A general me-thod for making classifiers cost-sensitive. In:
Proceedings of the Fifth ACM SIGKDD Interna-tional Conference on Knowledge Discovery and Data Mining, pp. 155–164.
36. Hu Y, Feng B, Mo X, Zhang X, Ngai EW, Fan M, Liu M (2015). Cost-sensitive and ensem-ble-based prediction model for outsourced
software project risk prediction. Decis Support Syst, 72:11-23.
37. King M, Abrahams A, Ragsdale C (2015). En-semble learning methods for pay-per-click campaign management. Expert Syst Appl, 42(10):4818-4829.
38. Daliri M (2012). A Hybrid Automatic System for the Diagnosis of Lung Cancer Based on Ge-netic Algorithm and Fuzzy Extreme Learning Machines. J Med Syst, 36(2):1001-1005. 39. Gaziano TA, Bitton A, Anand S,
Abrahams-Gessel S, Murphy A (2010). Growing Epi-demic of Coronary Heart Disease in Low- and Middle-Income Countries. Curr Probl Cardiol, 35(2):72-115.
40. Zhao H (2007). Instance weighting versus thre-shold adjusting for cost-sensitive classifica-tion. Knowl Inf Syst, 15(3):321-334.