INTRODUCTION
Ephedra is one of the oldest known drugs, having been used by the Chinese for at least 5000 years [1]. It contains alka-loids of the ephedrine (E)-type which act as sympathomimet-ics. The pharmacological and toxicological effects depend on the individual E alkaloid type, its enantiomeric form and recep-tor binding characteristics. Ephedrine stimulates the heart rate, increases blood pressure, promotes bronchodilatation, and exhibits pronounced effects on the central nervous system (CNS) by binding to adrenergic receptors. Pseudoephedrine (PE) acts similarly, yet, with fewer CNS effects [2]. Many plants, which have a stimulatory effect on the CNS, synthe-size substances that contain phenylethylamine or xanthine structures that are able to enhance catecholaminergic effects
and/or to act on adrenoreceptors [3]. In the past, E alkaloids were used in the treatment and/or prophylaxis of various conditions such as asthma, nasal congestion, and hypoten-sion caused by spinal anesthesia and urinary incontinence. Today, there is a rising interest for the application of Ephedra in enhancing performance and appetite suppression [4]. Contrary to most other herbal supplements, Ephedra prod-ucts carry a remarkable health risk, which is aggravated by their misuse and/or abuse. According to the Food and Drug Administration (FDA) assessment in 2004, food supplements containing E-type alkaloids represent an unacceptable health risk, bearing in mind the conditions of use. Consequently, FDA banned all over the counter drugs containing ephedrine. Reviews of human case reports described adverse cardiovas-cular and cerebrovascardiovas-cular events as possibly associated with the use of dietary supplement preparations containing E-type alkaloids [2]. The World Anti-Doping Agency prohibited E, PE and methylephedrine as stimulants. Additionally, E and PE are worldwide monitored as precursors for the chemical synthesis of the methamphetamine. Apart from consumer abuse, there is also manufacturer abuse, which is reflected in
*Corresponding author: Emin Sofić,
Department of Chemistry, Faculty of Science, University of Sarajevo, Sarajevo, Bosnia and Herzegovina, and Department of Pharmacoinformatics and Pharmacoeconomics, Faculty of Pharmacy, University of Sarajevo, Sarajevo, Bosnia and Herzegovina. Tel: +387 33 279 897. E-mail: [email protected]
Submitted: 18 May 2015 / Accepted: 11 June 2015
Chemical composition of various
Ephedra
species
Saida Ibragic1, Emin Sofić1,2*
1Department of Chemistry, Faculty of Science, University of Sarajevo, Sarajevo, Bosnia and Herzegovina, 2Department of Pharmacoinformatics and Pharmacoeconomics, Faculty of Pharmacy, University of Sarajevo, Sarajevo, Bosnia and Herzegovina
ABSTRACT
The medicinal significance of Ephedra is based on the sympathomimetic properties of ephedrine (E) alkaloids. Pharmacological effects depend on the phytocomposition of individual Ephedra species. The aim of this study was to measure the total alkaloids content (TAC), total pheno-lics content (TPC), and total flavonoids content (TFC) and determine their relationship in dry herb of Ephedra major, Ephedra distachya subsp. helvetica, Ephedra monosperma, Ephedra fragilis, Ephedra foeminea, Ephedra alata, Ephedra altissima and Ephedra foliata. Nowadays, medicinal use of Ephedrae herba is limited, but the abuse of its psychostimulants is rising. In this study, TAC, TPC and TFC were determined using spectrophotometric methods. For the first time, ultra-performance liquid chromatography with ultraviolet detection (UPLC-UV) was used for separation and quantification of E-type alkaloids of various Ephedra species. The highest TPC and TFC were found in E. alata (53.3 ± 0.1 mg Gallic acid equivalents/g dry weight, 2.8 mg quercetin equivalents/g dry weight, respectively). The total content of E and pseudoephedrine determined by UPLC-UV varied between 20.8 mg/g dry weight (E. distachya subsp. helvetica) and 34.7 mg/g dry weight (E. monosperma). The variable content and ratio between secondary metabolites determined in different Ephedra species reflects their metabolic activities. Utilization of UPLC-UV unveiled that this technique is sensitive, selective, and useful for separation and quantifica-tion of different alkaloids in complex biological matrixes. The limit of detecquantifica-tion was 5 ng. Applicaquantifica-tion of UPLC-UV can be recommended in quick analyses of E-type alkaloids in forensic medicine and quality control of pharmaceutical preparations.
KEYWORDS: Ephedra; alkaloids; phenolics; flavonoids; spectrophotometry; ultra-performance liquid chromatography with ultraviolet detection
spiking of Ephedrae herba or its preparations with synthetic E alkaloids. Therefore, the identity and origin of the alkaloids in herbal preparations is often questionable and analytical methods which ensure and verify safety and quality control are of high importance and require improvements. The phy-tochemical composition of various Ephedra species is not completely elucidated. Secondary metabolites originating from Ephedra species comprise alkaloids, amino acids and derivatives, volatiles, and phenolic compounds [5]. Ephedra species contain alkaloids of biological relevance: E, PE, nore-phedrine, norpseudoenore-phedrine, methylenore-phedrine, and meth-ylpseudoephedrine. Beside the E-type alkaloids, ephedroxane, and macrocyclic spermidines called Ephedradine A-D, have been found in some Eurasian Ephedra species [5]. Other phy-tochemical compounds include kynurenates, citric, malic and oxalic acid [6], saponins, crystals of calcium oxalate, and trace minerals. According to several reports, volatile compounds present in this plant are mainly represented by terpenoids and may be used as chemotaxonomic markers [7-9]. Phenolic compounds and their most important subgroup flavonoids are aromatic compounds widely distributed in the plant king-dom. They are present in the phytochemical composition of Ephedra, however, to our best knowledge, literature lacks data on their total contents in the majority of the Ephedra species used in this study. Therefore, the aim of the study is to determine the total alkaloids content (TAC), total phenolics content (TPC) and total flavonoids content (TFC) and their ratio in different Ephedra species using spectrophotometric methods; to quantify E and PE, as well as to separate individual E-type alkaloids using ultra-performance liquid chromatogra-phy with ultraviolet detection (UPLC-UV). Additionally, the objective is to recommend and justify UPLC-UV as a method for quick analyses in forensic medicine in cases when it is nec-essary to prove the presence or absence of E-type alkaloids. Possessing Ephedra species, which are avoid of E alkaloids is not considered illicit as opposed to species, which contain E alkaloids. The quantitative data can be used in quality con-trol of herbal and synthetic drugs containing E alkaloids which is essential for ensuring their safety and efficacy.
MATERIALS AND METHODS
Plant materials
Dried aerial parts of the listed Ephedra species were used to determine the TAC, TPC and TFC using spectrophotomet-ric methods; and to separate individual E-type alkaloids and quantify E and PE by UPLC-UV:
• Ephedra fragilis Desf. (Botanical Garden of the University of Vienna, Austria) IPEN number: XX-0-WU-EPH130013; garden reference number 22102.
• Ephedra major Host (Botanical Garden of the University of Vienna, Austria; identified by I. Racz and F. Lauria) IPEN number: XX-0-WU-EPH120009; garden reference number 23026.
• Ephedra distachya subsp. helvetica (C.A. Mey.) Asch. & Graebn. (Botanical Garden of the University of Vienna, Austria) IPEN number: XX-0-WU-EPH130012; garden reference number 22015.
• Ephedra foeminea Forssk. (Botanical Garden of the University of Vienna, Austria; identified by I. Racz and F. Lauria) IPEN number: XX-0-WU-EPHE120010; garden reference number 23028.
• Ephedra monosperma J.G. Gmel. ex C.A. Mey. (Botanical Garden of the University of Vienna, Austria) IPEN number: XX-0-WU-EPH1300014; garden reference number 22104.
• Ephedra alata Decne. (Botanical Garden of the University of Hamburg, Germany; identified by Finckhi Staudinger), garden reference number: 500392, 2002; proj-ect Biota Maroc 01LL0601A.
• Ephedra altissima Desf. (Botanical Garden of the University of Hamburg, Germany; identified by Finckhi Staudinger), garden reference number: 500044, 2001; project Biota Maroc 01LL0601A.
• Ephedra foliata Boiss. ex C.A. Mey. (Botanical Garden of the University of Hamburg, Germany; identified by Finckhi Staudinger), garden reference number: 500882, 2002; project Biota Maroc 01LL0601A.
Determination of TPC
Total phenolics were determined by Folin–Ciocalteau reagent using the method by Slinkard and Singleton [10].
Chemicals
Methanol (min. 99.5%, p.a.), glacial acetic acid (min. 99%, p.a.), ethanol 96%, and sodium carbonate decahydrate (p.a.) were purchased from Alkaloid Skopje, Macedonia. Water, Chromasolv®Plus (High-performance liquid chromatography
[HPLC] grade, Sigma-Aldrich, USA), gallic acid monohydrate (>98%, for HPLC, FlukaChemika, Germany), Folin-Ciocalteau reagent (Semikem, Bosnia and Herzegovina).
Preparation of the standard solution
Gallic acid (50 mg) was dissolved in 300 µl 96% ethanol and diluted with purified water (HPLC grade) to 100 ml. The stock solution was further diluted (0.5, 1, 2, 3, 4, 5 µg/ml) to prepare a standard curve.
Sample preparation
4 ml of purified water (HPLC grade), and 1.5 ml glacial ace-tic acid. The mixture was shaken several times and heated in a water bath for 30 minutes, then centrifuged at 15000 rpm, for 20 minutes at 15°C. The supernatants were used for the analysis.
Procedure
Sample or standard (2 ml), diluted 1/10 from the above given concentrations, were mixed with 10 ml 1/10 diluted Folin–Ciocalteau reagent. The solution was left to stand for 0.5-8 minutes before adding 8 ml Na2CO3 (75 g/l). After
standing for 30-45 minutes at room temperature, the absor-bance of the solution was measured at 743 nm (Ultraviolet-Visible [UV/VIS] spectrophotometer Perkin Elmer Precisely LAMBDA 25, CA, USA).
Determination of TFC
The aluminum chloride colorimetric method was used for flavonoids determination [11].
Chemicals
Aluminum hexahydrate (p.a. and for HPLC) and potas-sium acetate (min 99%, p.a.) were purchased from Kemika, Croatia; potassium chloride (p.a. DestilacijaTeslic, Bosnia, and Herzegovina), quercetin anhydride (Sigma-Aldrich, USA), distilled water.
Preparation of the standard solution
Quercetin standard (30 mg) was dissolved in 100 ml water (HPLC grade). This stock solution was used to prepare serial dilutions (0.3, 0.2, 0.1, 0.08, 0.05, 0.025, and 0.0125 mg/ml) for constructing the standard curve.
Sample preparation
Samples are prepared in the same way as described in determination of total phenolics.
Procedure
Each of the plant extracts was separately mixed with 1.5 ml of methanol, 0.1 ml of 10% aluminum chloride, 0.1 ml of 1 M potassium acetate, and 2.8 ml of distilled water. It remained at room temperature for 30 minutes; the absorbance of the reaction mixture was measured at 434 nm (UV/VIS spectro-photometer Perkin Elmer Precisely LAMBDA 25, CA, USA).
Determination of TAC
The determination of total alkaloids is based on the reac-tion with ninhydrin, a strong oxidative agent that reacts with amino acids and yields a violet-blue product, which has the maximum absorption at 570 nm.
Chemicals
Ninydrin (p.a., Kemika, Croatia), E standard (>99.9%, BASF, Germany), sodium carbonate decadhydrate (p.a., Alkaloid Skopje, Macedonia), ethanol (96%, Semikem, Bosnia and Herzegovina), water (HPLC grade, Panreac, Spain), hydro-chloric acid (37%, p.a. Carlo Erba Reagents, Italy), sodium hydroxide (min 99%, Semikem, Bosnia and Herzegovina), dichlormethane (min 99.8%, HPLC grade, Merck, Germany), methanol Chromasolv (HPLC grade, Sigma Aldrich, Germany).
Preparation of working solutions and the
standard curve
On analytical balance 2 g of ninhydrin was weighed, then dissolved in 3 ml ethanol, diluted with water to 100 ml, adjusted to pH 7.8-7.9 with 1% Na2CO3. The E standard was prepared by dissolving 5 mg of the standard in 25 ml water. The standard curve had a concentration range between 0.01 and 0.04 mg/ml and was prepared by following this proce-dure: 100 µl ninhydrin solution was added on a series of vol-umes of the E standard solution (60, 80, 100, 120, 140, 160, 180, 200 µl), heated in a water bath at 100-110°C for 10 minutes, immediately diluted with water to 1 ml. Absorbance was mea-sured at 570 nm.
Sample preparation
On analytical balance 1 g of finely ground dried plant mate-rial was weighed, put into an Erlenmeyer flask, added 20 ml of hydrochloric acid (6.2%, v/v). The mixture was sonicated for 15 minutes. The solid residue was allowed to settle and filtrated. The pH of the remaining solution was adjusted to about 12 with sodium hydroxide solution (20%, w/v) and transferred to a sep-aration funnel. Ephedrine alkaloids were extracted by adding 20 ml of dichloromethane. The lower layer was collected and evaporated to dryness on a warm water bath (50-60°C). Next day, the residue was dissolved in 500 µl of methanol.
Procedure
First, 100 µl of the methanolic sample solution (in different dilutions to fit into the standard curve) was mixed with 100 µl ninhydrin solution, then heated in a water bath at 105-110°C for 10 minutes and immediately diluted with water to 1 ml. Absorbance was measured at 570 nm (UV/VIS spectropho-tometer Perkin Elmer Precisely LAMBDA 25, CA, USA).
Separation of Ephedrine-type alkaloids and
quantification of E and PE by UPLC-UV
Chemicals
Acetonitrile Optigrade® (for HPLC), sodium lauryl sulfate
were purchased from Promochem, tetrahydrofuran (for HPLC, LiChrosolv) and o-phosphoric acid (85%, p.a.) from Merck KGaA, E-hydrochloride, and PE-hydrochloride stan-dards from BASF, water (Chromasolv®Plus, for HPLC,
Sigma-Aldrich, USA).
Instrumentation and chromatographic
conditions
The UPLC-UV analysis was performed using and modi-fying the parameters published by Gurley et al. [12]. A com-ponent UPLC system (Acquity UPLC H-Class) consisted of a pump, vacuum degasser, reservoir of the mobile phase, a thermostatedauto sampler, a thermostated column compart-ment, PDA eλ UV absorbance detector operated at 208 nm. A C-8 column (Acquity UPLC BEH C8, 150 × 2.1 mm; 1.7 µm) was operated with a mobile phase consisting of acetonitrile, tetrahydrofuran, and water (38:5:57, v/v/v). Sodium lauryl sulfate, an ion-pairing agent, was added to the mobile phase to achieve a final concentration of 5 mM. The mobile phase was delivered at a flow-rate of 0.3 ml/minute. Column tem-perature was maintained at 37°C, the pressure was around 9000 psi, the injection volume was 5 µl and the run time was 7.0 minutes. Detector output was recorded and chromato-grams were analyzed by the software Acquity UPLC Console for system UPLC, Empower 2.0, Waters Corporation, USA.
Standard preparation
E-hydrochloride standard (5.12 mg that equal to 4.192 mg E standard) was dissolved in 50 ml methanol. From that solution, 10 ml were taken and diluted with methanol up to 20 ml. PE hydrochloride was weighed (5.43 mg that equal to 4.453 mg PE standard) and prepared in the same way. The obtained stan-dard curve for E had R2 = 0.999, and the standard curve for PE
had R2 = 0.998.
Validation of quantification
E and PE calibration standards were used for the validation of the quantification. Standard curves were obtained by using the area of the peak and the concentration of the correspond-ing standard. Analyte concentrations are expressed as mg/g dry weight. The retention times (tR) were 3.623 minutes for the
PE standard, and 3.743 minutes for the E standard. The limit of detection was 5 ng.
Sample preparation
The extracting solution consisted of 0.716 g sodium lauryl sulfate, 58.2 ml acetonitrile, 119 µl phosphoric acid and 91 ml water (HPLC grade). Dry and finely grounded plant material (100 mg) was suspended in 5 ml of that solution, allowed to stand for 20 minutes at room temperature and then sonicated for 25 minutes. The extracts were centrifuged, 10000 rpm for
5 minutes, supernatants filtrated (membrane filter, 0.25 µm) and stored at –20°C before analysis.
RESULTS
TPC, TFC and TAC in
Ephedra
species
The TPCs were determined from the linear equation of a standard curve (R2 = 0.999) prepared with Gallic acid
(Figure 1). The TPC compounds were expressed as mg GAE/g dry weight. Results of the TFC were expressed as mg QE/g dry weight and established using the standard curve (R2 = 0.9961)
prepared with quercetin. The constructed standard curve (R2 = 0.9876) for the measurement of TAC plotted the
absor-bance of ninhydrin versus its concentration. Results of TAC are expressed as mean ± SD.
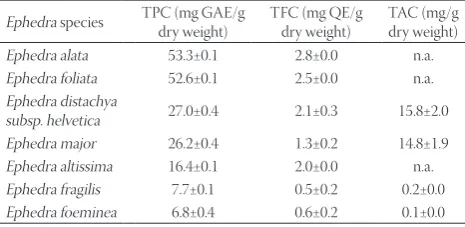
Results of TPC, TFC and TAC measurements are pre-sented in Table 1. Among the investigated Ephedra species, the highest TPC and TFC were found in E. alata (53.3 ± 0.1 mg GAE/g dry weight and 2.8 ± 0.0 mg QE/g dry weight, respec-tively). The lowest TPC was found in E. foeminea (6.8 ± 0.4 mg GAE/g dry weight), while the lowest TFC was in E. fragilis (0.5 ± 0.2 mg QE/g dry weight). Results showed that, depend-ing on the species, a high TPC value was accompanied by a high TFC value, whereas a low TPC value was accompanied by a low TFC value (Figure 2). The TAC in the herb of inves-tigated Ephedra species varied between 0.1 ± 0.0 mg/g dry
FIGURE 1. A standard curve for the determination of total phe-nolics content.
TABLE 1. TPC, TFC and TAC in Ephedra species
Ephedra species TPC (mg GAE/g dry weight) TFC (mg QE/g dry weight) TAC (mg/g dry weight)
Ephedra alata 53.3±0.1 2.8±0.0 n.a. Ephedra foliata 52.6±0.1 2.5±0.0 n.a. Ephedra distachya
weight and 15.8 ± 0.0 mg/g dry weight. The highest content was found in E. distachya subsp. helvetica, while the lowest content was in E. foeminea. Ephedra distachya subsp. hel-vetica and E. major have a higher content of TAC, TPC and TFC as opposed to E. foeminea and E. fragilis. By comparing the ratio between the secondary metabolites, it can be con-cluded that species with a higher TAC are richer in TPC and TFC, as well. The TAC of E. alata, E. altissima and E. foliata was not determined in this study due to insufficiency of pro-vided plant materials, however, they may be expected to con-tain a high TAC as they have an expressed metabolic activity toward the synthesis of secondary metabolites which can be seen from their high TPC and TFC values.
Separation and quantification of authentic
standards of E and PE using UPLC-UV
The contents of E and PE were calculated using the peak area of their standards (Figure 3). The results are presented in Table 2. The obtained chromatograms of E. monosperma as the species with highest E and PE content is presented in Figure 4, while the chromatogram of E. foeminea as the only species in this study that does not contain E and PE is pre-sented in Figure 5.
Among the analyzed species, E is the dominant alkaloid in E. major, E. fragilis and E. distachya subsp. helvetica. Ephedra monosperma was the only species with a higher PE content. E and PE were not detected in E. foeminea. The limit of detection was 5 ng.
DISCUSSION
Identification of Ephedra species can be difficult because of their simple morphological characteristics and easy adap-tation to the changes in their environment [13]. Quantitative data on the chemical composition of the alkaloids in E. herba are extremely variable, depending on factors such as the plant species, the amount of rainfall, soil characteristics, harvesting, storage conditions of the plant, and the analytical quantifica-tion method. For the biosynthesis of E alkaloids, plants use
phenylalanine as a precursor, but incorporate only seven of its carbon atoms. Phenylalanine is metabolized to benzoic acid, which is then acetylated and decarboxylated to form pyruvic acid. Transamination, results in the formation of cathinone. Reduction of one carbonlyl group leads to the formation of either norephedrine or norpseudoephedrine (called cathine).
FIGURE 2. Comparison of total phenolics and total flavonoids
content in Ephedra species.
FIGURE 3. Chromatogram of standards for pseudoephedrine
(PE) (0.34 µg) and ephedrine (E) (1.1 µg). PE: tR = 3.623 minutes; E: tR = 3.743 minutes.
FIGURE 4. A typical chromatogram of Ephedra
mono-sperma (pseudoephedrine tR = 3.619 minutes; ephedrine tR =
3.760 minutes).
FIGURE 5. A typical chromatogram of Ephedra foeminea (pseu-doephedrine and ephedrine were not detected).
TABLE 2. Contents of E and PE (mg/g dry weight) in Ephedra
species
Ephedra species
Contents of E and PE (mg/g dry weight)
E PE E+PE
Ephedra monosperma 9.5 25.2 34.7
Ephedra major 16.3 14.3 30.6
Ephedra fragilis 21.0 6.1 27.1
Ephedra distachya subsp. helvetica 11.4 9.4 20.8
Finally, N-methylation would provide E or PE [2]. The con-tent of alkaloids was first determined in East Asian Ephedra species. The Es are present in most Eurasian Ephedra species, but are more abundant in the Chinese species. American species are believed to be devoid of them [14]. The TAC is known for the following species: Ephedra equisetina Bunge, Ephedra gerardiana Wall Ex. Stapf, Ephedra intermedia Schrenk & C.A. Mey, Ephedra lepidosperma C.Y. Cheng, Ephedra likiangensis Florin, Ephedra lomatolepis Schrenk, E. monosperma J.G. Gmel. ex C.A. Mey, Ephedra regeliana Florin, Ephedra saxatilis (Stapf) Royle ex Florin, Ephedra sinica Stapf. The TAC in those species varies between 0.42 and 49 mg/g [2]. Hong et al. [15] determined and compared the TAC in E. sinica, E. equisetina, and E. intermedia and concluded that the content range for these species overlaps. However, the ratio E/total alkaloids and E/PE, as well as the E and ME content can be helpful for identification purposes. Ephedra californica S. Watson, Ephedra distachya L., E. major Host and Ephedra viridis Coville also belong to the Ephedra species containing E alkaloids [2]. Reportedly E alka-loids are present in: E. alata Decne., Ephedra botschantzevii Pachom., E. fragilis Desf., Ephedra pachyclada Boiss., and in very small amounts in Ephedra strobilacea Bunge and Ephedra transitoria Riedl [14,16].
Reports on the presence of E-type alkaloids in the Ephedra species used in this study are all in line with our results con-firming the presence of alkaloids, including E. foeminea. Claims regarding the E and PE contents in that species are contrary [14]. Results obtained by the spectrophotometric method confirmed the presence of E alkaloids in E. dista-cyha subsp. helvetica (15.8 ± 2.0 mg/g dry weight), E. major (14.8 ± 1.9 mg/g dry weight), E. fragilis (0.2 ± 0.0 mg/g dry weight) and E. foeminea (0.1 ± 0.0 mg/g dry weight). Caveney and Starratt [17] reported that E. fragilis may be the excep-tion in the Fragilis group having a high E content, which is in line with our results (21.0 mg/g dry weight) obtained by the UPLC-UV method. However, the results obtained by the spec-trophotometric showed a low TAC in that species. The reason could be incomplete extraction process. The lowest TAC was found in E. foeminea. The summed up content of E and PE, obtained by the UPLC-UV method, varies between 20.8 mg/g dry weight (E. distachya subsp. helvetica) and 34.7 mg/g dry weight (E. monosperma). In some species, E alone amounts up to 90% and PE up to 99% of total alkaloids. Based on that, the content of E and PE obtained by the UPLC-UV method can be used to roughly estimate the TAC. In this study, among the alkaloids only E and PE were quantified due to the avail-ability of standards. However, the UPLC-UV method proved to be adequate for successful quantification and separation of all six E-type alkaloids. The only species where PE is predomi-nant compared to E is E. monosperma. There are also species
that contain only PE but no E. Ephedrine is the dominant alkaloid in Ephedra sinica, Ephedra equisetina, E. mono-sperma and E. intermedia var. tibetica. Ephedra przewal-skii and E. lepidosperma are species with a very low content of E alkaloids [14].
The Ephedra genus is known for its alkaloids, hence, there are fewer studies about other phytocomponents of its species members. However, there is no doubt that phenolic compounds are constituents of E. herba [18]. These chemical compounds are natural pigments. Plant phenolics are mainly synthesized from phenylalanine and their most important role is in defending plants from pathogens. Flavonoids are aromatic compounds with anti-oxidative properties, pres-ent in over 70% plant species. Ephedra contains flavonoids (leucodelphinidin, leucopelargonine, leucoanthocyanidin, lucenine, vicenin-1, and vicenin-2), tannins, benzylmethyl-amine. Tannins, mainly proanthocyanidines, are constituents of many Ephedra species (e.g. in Eurasian species E. inter-media, E. przewalskii, E. alata, E. distachya, and E. fragi-lis; species of North America: E. californica, E. fasciculata, E. nevadensis, E. torreyana, E. trifurca, and E. viridis). Tannin deposits often induce the brown color of stems, which is helpful in species identification [19].
Literature data on TPC and TFC in individual Ephedra species is scarce. Harisaranraj et al. [20] have determined the TAC and TFC in E. vulgaris using gravimetry (1.24 mg/100 g dry weight and 1.48 mg/100 g dry weight, respectively). In the same species, they also determined the TPC (1.46 mg/100 g dry weight) by a spectrophotometric method. Recently, the focus of studies has been set toward characterization of individual phenolic constituents in different Ephedra species [21,22]. In this study, we determined the TPC and TFC in: E. dis-tachya subsp. helvetica, E. major, E. fragilis, E. foeminea, E. altissima, E. alata and E. foliata. Ephedra alata, and E. foliata had the highest TPC as well as the highest TFC. The lowest TPC and TFC values were detected in E. fragilis and E. foeminea, which are also poor in the TAC. Comparison of TAC, TPC and TFC indicates that E. alata and E. foliata belong to the Ephedra species with an increased metabolic activity yielding a higher content of secondary metabolites.
CONCLUSION
investigated species, E. distachya subsp. helvetica stands out as species with a high TAC, while E. alata has a high TPCs and TFC. The employed methods yielded a set of qual-itative and quantqual-itative parameters that can help to ascertain the identity of the plant material. Quantitative analyses have become crucial and most common approaches in the quality control of herbal preparations and plant ground materials. The described UPLC-UV method can be utilized to confirm the presence or absence of E alkaloids and employed in different analyses ranging from pharmacognosy and phytochemistry to forensic medicine. The determined content and presence/ absence of specific E alkaloids determines the pharmacologi-cal and toxicologipharmacologi-cal effects and reflects metabolic pathways occurring in different Ephedra species. By comparing the ratio between the secondary metabolites, it may be concluded that species with a high TAC are expected to be rich in TPC and TFC, as well.
DECLARATION OF INTERESTS
The authors declare no conflict of interests.
ACKNOWLEDGEMENTS
The authors are grateful to the Botanical Garden of the University of Vienna and the Botanical Garden of the University of Hamburg (project Biota Maroc 01LL0601A) which have kindly provided and identified the plant materials for this study.
REFERENCES
[1] Dewick MP. Medicinal Natural Products: A Biosynthetic Approach. 2nd ed. West Sussex, England: John Wiley and Sons; 2002. p. 383. [2] EFSA ANS Panel (EFSA Panel on Food Additives and Nutrient
Sources), 2013. Scientific opinion on safety evaluation of Ephedra
species in food. EFSA J 2013;11(11):3467, 79 pp.
[3] Carlini EA. Plants and the central nervous system. Pharmacol Biochem Behav 2003;75(3):501-512.
[4] Barnes J, Anderson AL, Phillipson JD. Herbal Medicines. 3rd ed.
London: Pharmaceutical Press; 2007.
[5] Abourashed EA, El-Alfy AT, Khan IA, Walker L. Ephedra in
perspective – A current review. Phytother Res 2003;17(7):703-712. [6] Mills S, Bone K. The Essential Guide to Herbal Safety. St. Louis,
MO: Elsevier Inc.; 2005.
[7] Miyazawa M, Minamino Y, Kameoka H. Volatile com-ponents of Ephedra sinica stapf. Flavour Fragr J 1997;12(1):15-17. DOI: http://dx.doi.org/10.1002/ (SICI)1099-1026(199701)12:1<15:AID-FFJ604>3.0.CO;2-5.
[8] Tellez MR, Khan IA, Schaneberg BT, Crockett SL, Rimando AM, Kobaisy M. Steam distillation-solid-phase microextraction for the detection of Ephedra sinica in herbal preparations. J Chromatogr A 2004;1025(1):51-56.
[9] Wang Q, Yang Y, Zhao X, Zhu B, Nan P, Zhao J, et al. Chemical varia-tion in the essential oil of Ephedrasinica from Northeastern China. Food Chem 2006;98(1):52-58. DOI: http://dx.doi.org/10.1016/j. foodchem.2005.04.033.
[10] Slinkard K, Singleton VL. Total phenol analyses: Automation and comparison with manual methods. Am J Enol Vitic 1977;28:49-55. [11] Chang CC, Yang MH, Wen HM, Chern JC. Estimation of total
fla-vonoid content in vegetables by two complementary colorimetric methods. J Food Drug Anal 2002;10:178-82.
[12] Gurley BJ, Wang P, Gardner SF. Ephedrine-type alkaloid content of nutritional supplements containing Ephedra sinica (Ma-huang) as determined by high performance liquid chromatography. J Pharm Sci 1998;87(12):1547-1553.
[13] Kitani Y, Zhu S, Omote T, Tanaka K, Batkhuu J, Sanchir C, et al. Molecular analysis and chemical evaluation of Ephedra plants in Mongolia. Biol Pharm Bull 2009;32(7):1235-1243.
[14] Caveney S, Charlet DA, Freitag H, Maier-Stolte M, Starratt AN. New observations on the secondary chemistry of world Ephedra
(Ephedraceae). Am J Bot 2001;88(7):1199-1208.
[15] Hong H, Chen HB, Yang DH, Shang MY, Wang X, Cai SQ, et al. Comparison of contents of five ephedrine alkaloids in three official origins of Ephedra herb in China by high-performance liquid chro-matography. J Nat Med 2011;65(3-4):623-628. DOI: http://dx.doi. org/10.1007/s11418-011-0528-8.
[16] Hegnauer R. Ephedraceae. In: Chemotaxonomy of plants, Vol. VII. Basel: Birkhauser Verlag; 1986. p. 546-553.
[17] Caveney S, Starratt A. Glutamatergic signals in Ephedra. Nature 1994;372:509. DOI: http://dx.doi.org/10.1038/372509a0.
[18] Kustrak D, Ramic A. Ephedra species and their alkaloids. Farm Glas 1994;50(12):321-336.
[19] Freitag H, Maier-Stolte M. Ephedra L. In: Tutin TG, editor. Flora Europaea. Vol I. Cambridge: University Press; 1993.
[20] Harisaranraj R, Suresh K, Saravanababu S. Evaluation of the chem-ical composition Raufolwia serpentina and Ephedra vulgaris. Adv Bio Res 2009;3(5-6):174-178.
[21] Cottiglia F, Bonsignore L, Casu L, Deidda D, Pompei R, Casu M, et al. Phenolic constituents from Ephedra nebrodensis. Nat Prod Res 2005;19(2):117-23.
[22] Amakura Y, Yoshimura M, Yamakami S, Yoshida T, Wakana D, Hyuga M, et al. Characterization of phenolic constituents from