Original Research Article
A study on prevalence of chronic kidney disease and its risk factors
among adults in selected slums of Chennai
K. Kokila, K. Chellavel Ganapathi*
INTRODUCTION
Increasing affluence and sedentary lifestyle along with changing pattern of demographics has led to raising trend in non- communicable diseases worldwide, even in developing countries like India. Chronic kidney disease (CKD) is a silent epidemic. It is attributed by better nutrition, decreasing incidence of communicable diseases and improved life expectancy.1 Different methodologies were used for studying the prevalence of CKD and this poses a difficulty in estimating the true prevalence.2
Formulae to calculate estimated glomerular filtration rate (eGFR), age related decrease in GFR and microalbuminuria these all can overinflate the overall CKD prevalence. Glomerular filtration rate is considered the best overall index of kidney. “SEEK (screening and early evaluation of kidney disease) India cohort” estimated CKD prevalence 17.2% using community and hospital based screening camp approach, modification of diet in renal disease (MDRD- 3) equation eGFR <60 ml/min/1.73 m2 or urine protein ≥1+.3 The true incidence and prevalence of CKD with in a population are very
ABSTRACT
Background: Chronic kidney disease (CKD) is a silent epidemic. The true prevalence of CKD with in a population are very difficult to estimate, since early to moderate CKD were usually asymptomatic. ESRD in the consequence of CKD is one of the most expensive diseases to treat.Only way is to prevent it and Hence this was conducted to estimate the prevalence of CKD and its associated risk factors among adults in selected slums of Chennai.
Methods: This is a cross sectional study done from May 2013 to June 2014 in selected slums of Chennai. The study population includes adult males and females. Multi stage sampling method used. Sample size covered was 400. A semi structured questionnaire used as tool. Based on the serum creatinine eGFR calculated using modified MDRD study equation and CKD prevalence was identified. The data was entered in MS excel and analyzed using SPSS version 21.
Results: Total of 400 participants involved. Females were predominant in the study. Among them, 67 (16.8%) were diagnosed as CKD patients and Stage 1, 4.0% had stage 2, 3.6% had stage 3, 1.3% had stage 4 and 0.5% had stage 5 at the time of diagnosis.
Conclusions: This study revealed prevalence of CKD among slum population was 16.8%. This study showed that old age, uncontrolled hypertension, uneducated, Diabetes with poor control, overuse of analgesics, H/o smoking, obesity, alcoholism, passive smoking, family H/o CKD and proteinuria were significant risk factor for CKD among study subjects. Slum population with risk factors should be regularly screened for CKD.
Keywords: CKD, Adults, Slum, Diabetes, Hypertension
Department of Community Medicine, Government Mohan Kumaramangalam Medical College, Salem, Tamil Nadu, India
Received: 13 December 2018
Revised: 09 January 2019
Accepted: 10 January 2019
*Correspondence:
Dr. K. Chellavel Ganapathi,
E-mail: [email protected]
Copyright: © the author(s), publisher and licensee Medip Academy. This is an open-access article distributed under the terms of the Creative Commons Attribution Non-Commercial License, which permits unrestricted non-commercial use, distribution, and reproduction in any medium, provided the original work is properly cited.
difficult to estimate, since early to moderate CKD were usually asymptomatic. Non-availability of population based screening programs lead to delay in diagnosis of CKD.3 End stage renal disease (ESRD) in the consequence of CKD is one of the most expensive diseases to treat currently.3 Only way is to prevent it rather than try to treat it. Hence, this present study was designed and performed to estimate the prevalence of CKD and its risk factors in selected slums of Chennai.
Objectives of the study
This study was conducted to estimate the prevalence of chronic kidney disease (CKD) and its associated risk factors among adults in selected slums of Chennai.
METHODS
This is a community based cross sectional study done from May 2013 to June 2014 in selected slums of Chennai, Tamil Nadu, India. The study population includes adult males and female aged more than 18 years. After obtaining approval from the Commissioner, Corporation of Chennai and Institutional Ethics Committee, data collection started. After getting informed consent, relevant information collected by one to one interview using questionnaire in the local language at their homes. Those who are bed-ridden were excluded as they could not be mobilized for blood and urine examination, pregnant women; those who had any acute illness like diarrhea, fever, those who were taking drugs that affect serum creatinine were excluded. Sample size covered was 400 and the Calculated Sample size was 394. Z 1-/2=1.96 at 95% confidence interval, p=prevalence of CKD 17.2%, q=100-17.2=82.8%, d=absolute precision of 5%, design effect of 1.5.
N = = 328
Allowing a 20% non-response rate=66. The sample size is calculated by using prevalence of CKD 17.2% in SEEK India study.3 First stage was a simple random sampling technique, followed by a cluster sampling. With the cluster size of 20, number of clusters needed= sample size/cluster size= 400/20= 20 clusters.
A pre-tested semi structured questionnaire adapted and modified from the SEEK study.3 This contains 2 parts, First part includes socio demographic particulars and contact details and the second part consists history regarding exposure to risk factors. The questionnaire was pretested among 50 adults in a slum and based on the observations, necessary modifications were made. Following the interview of the participant with the questionnaire, measurements of height, weight, waist and hip circumference, blood pressure, blood samples and urine samples for glucose (random), serum creatinine and urine dipstick were made among the participants of the study.
Based on the serum creatinine eGFR calculated using modified MDRD study equation and CKD prevalence was identified. Throughout the study the privacy of the participants ensured. The interview was conducted and also measurements were taken in their own house. The data was entered into a MS excel sheet and analyzed using SPSS version 21. Chi square tests and regression were used and p<0.05 was considered to be significant.
RESULTS
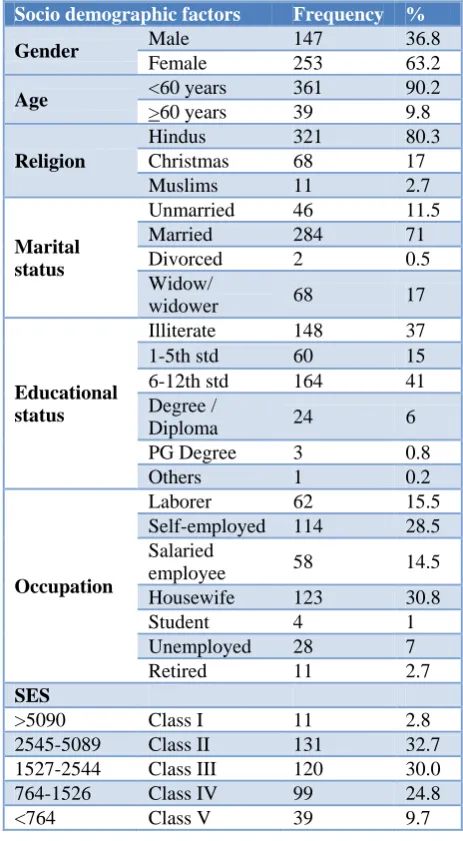
This cross sectional study estimated the prevalence of chronic kidney disease and its risk factors among 400 study participants. Among them, as per Table 1, majority belongs to 20-29 yrs (32.5%) followed by 22.8% in 40-49 yrs, 21.3% in 30-39 yrs, 13.6% in 50-59 yrs, 9.8% >60 yrs. Females were predominant in the study with 63.2% compared to males (36.8%) and Hindus were 80.3%, Christians 17% and Muslims 2.7%.
Table 1: Socio demographic details of the study participants.
Socio demographic factors Frequency %
Gender Male 147 36.8
Female 253 63.2
Age <60 years 361 90.2
>60 years 39 9.8
Religion
Hindus 321 80.3
Christmas 68 17 Muslims 11 2.7
Marital status
Unmarried 46 11.5
Married 284 71
Divorced 2 0.5
Widow/
widower 68 17
Educational status
Illiterate 148 37 1-5th std 60 15 6-12th std 164 41 Degree /
Diploma 24 6
PG Degree 3 0.8
Others 1 0.2
Occupation
Laborer 62 15.5
Self-employed 114 28.5 Salaried
employee 58 14.5 Housewife 123 30.8
Student 4 1
Unemployed 28 7
Retired 11 2.7
SES
Among study participants, 6th-12th std 41%, illiterate 36.5% followed by degree/diploma 6%, primary education (5%), and other (1.6%). Socioeconomic classification was done based on modified B.G. Prasad scale, 2.8% belonged to class I, 32.7% in class II, 30% in class III, 24.8% in class IV and 9.7% in class V.
Table 2: Stage wise distribution of CKD among study participants.
Stages of CKD Number Percentage (%)
Normal 333 83.2
Stage 1 30 7.5
Stage 2 16 4.0
Stage 3a 9 2.2
Stage 3b 5 1.3
Stage 4 5 1.3
Stage 5 2 0.5
Total 400 100
Among study participants, 67 (16.8%) were diagnosed as CKD patients. Table 2 shows that among all the newly
diagnosed CKD patients 7.5% had stage 1, 4.0% had stage 2, 3.6% had stage 3, 1.3% had stage 4 and 0.5% had stage 5 at the time of diagnosis.
In study population, 57 (14.3%) had proteinuria and about 50 (12.5%) had haematuria, 39 (9.8%) had leucocyturia with nitrate positivity (UTIs).
Prevalence of modifiable and non- modifiable factors risk factors was shown in Table 3. CKD prevalence also increases gradually i.e. from 6.2% among 20-29 years to 29.1% in 50-59 yrs, 25.6% among more than 60 years age group which was statistically significant. Among CKD patients, 50% (6) of the vegetarian and 15.7% (61) of the mixed diet had chronic kidney disease which was statistically significant. Among women those who not attained menopause 19 (12.1%) and who attained menopause 23 (24%) had CKD. The difference was statistically significant. Women who had attained menopause 2.288 times increased odds of getting CKD than menstruating females.
Table 3: Distribution of CKD risk factors among study participants.
Risk factors Male Female Total
No % No % No %
Diet Veg 3 2 9 3.6 12 3
Mixed 144 98 244 96.4 388 97
H/o smoking Smoker 68 46.3 - - 68 17
Non-smoker 79 53.7 - - 332 83
H/o alcohol Yes 107 72.8 - - 107 26.8
No 40 27.2 253 100 293 73.2
H/o diabetes Yes 12 8.2 43 17 55 13.8
No 135 91.8 210 83 345 86.2
H/o HTN Yes 19 12.9 52 20.6 17 17.7
No 128 87.1 201 79.4 329 82.3
H/o over usage of NSAIDS Yes 44 29.9 116 45.8 160 40
No 103 70.1 137 54.2 240 60
H/o AYUSH medicines intake Yes 4 2.7 8 3.2 12 3
No 143 97.3 245 96.8 388 97
H/o high blood cholesterol Yes 5 3.4 22 8.7 27 6.8
No 142 96.6 231 91.3 373 93.2
H/o heart disease Yes 15 10.2 13 5.1 28 7
No 132 89.8 240 94.9 373 93
H/o past urinary problem
Yes 11 7.5 50 19.8 61 15.3
No 136 92.5 203 80.2 339 84.7
H/o 1st degree relatives with CKD
Yes 17 11.6 20 10.3 43 10.8
No 130 88.4 227 89.7 357 89.2
Menopause (among females) Menstruating 157 62.1
Attained menopause 96 37.9
Among those having CKD, newly diagnosed hypertensives in screening were 52 (13%), 71 (17.8%) had history of (h/o) hypertension. Thus prevalence of hypertension was 30.8%. Among CKD proportion, 25.4% of known hypertensives had CKD when compared with
uncontrolled BP. About 36.4% of uncontrolled hypertension patients developed CKD and the association is statistically significant. Those who had uncontrolled BP 3.417 times higher the chance of getting CKD than others.
Newly diagnosed cases of diabetes in screening were 20 (5.0%), 55 (13.8%) had history of diabetes. Thus prevalence of diabetes was 75 (18.8%). About 36.0% of diabetics developed CKD when compared with non-diabetics, among whom 13.3% developed CKD. The association was statistically significant. Those who had diabetes, 4.008 times higher chance of getting CKD than others. Among known diabetes 50.1% had good glycemic control.
About 44.4% of uncontrolled diabetics developed CKD when compared with those who had good glycemic control 14.7% developed CKD. The association was statistically significant.
About 46% of the males were current and ex-smokers. Among them 32.4% (22) were found to have CKD. The prevalence of CKD is high among smokers and 12.116 times higher the chance of getting CKD (p<0.01). There were 72.8% (107) subjects who consumed alcohol, among them 21.5% (23) were having CKD. Out of 40 (27.2%) who did not consume alcohol, 2 (5%) were found to have CKD. The difference was statistically significant.
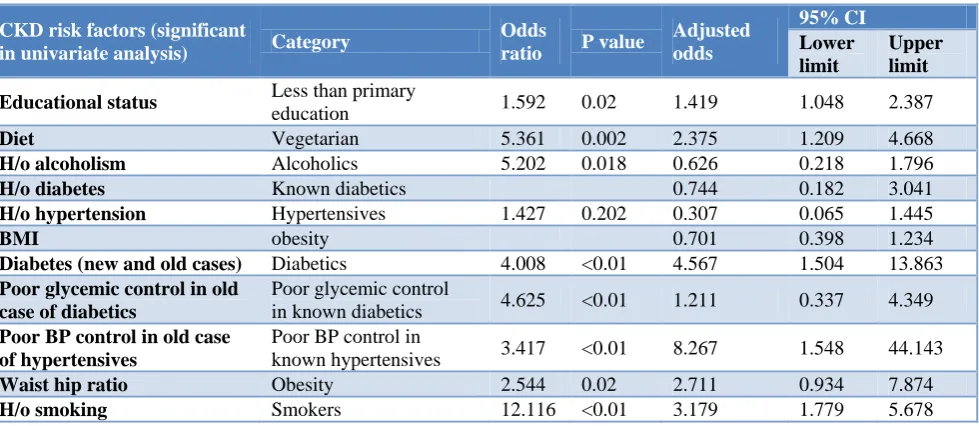
Table 4: Logistic regression analysis of the factors associated with CKD.
CKD risk factors (significant
in univariate analysis) Category
Odds
ratio P value
Adjusted odds
95% CI
Lower limit
Upper limit
Educational status Less than primary
education 1.592 0.02 1.419 1.048 2.387
Diet Vegetarian 5.361 0.002 2.375 1.209 4.668
H/o alcoholism Alcoholics 5.202 0.018 0.626 0.218 1.796
H/o diabetes Known diabetics 0.744 0.182 3.041
H/o hypertension Hypertensives 1.427 0.202 0.307 0.065 1.445
BMI obesity 0.701 0.398 1.234
Diabetes (new and old cases) Diabetics 4.008 <0.01 4.567 1.504 13.863
Poor glycemic control in old case of diabetics
Poor glycemic control
in known diabetics 4.625 <0.01 1.211 0.337 4.349
Poor BP control in old case of hypertensives
Poor BP control in
known hypertensives 3.417 <0.01 8.267 1.548 44.143
Waist hip ratio Obesity 2.544 0.02 2.711 0.934 7.874
H/o smoking Smokers 12.116 <0.01 3.179 1.779 5.678
About 63.5% (254) were overweight. Among those who had over weight 51 (20.1%) had CKD. The difference was statistically significant. Out of 215 (53.7%) who were having normal waist circumference 12.1% (26) subjects were having CKD, whereas out of 185 (46.3%) subjects having Waist circumference >80 cm in female >90 cm in male; 41% (22.2) were having CKD which shows significant association between waist circumference and CKD. Those who had abdominal obesity 2.070 time higher the chance of getting CKD. Out of 87 (34.4%) who were having normal waist hip ratio 8 (9.2%) subjects were having CKD, whereas out of 166 (65.6%) subjects having Waist circumference >0.85 in female >0.90 in male; 34% (20.5) were having CKD which shows there was significant association between waist hip ratio and CKD. Those who had waist circumference >0.85 in female >0.90 in male, 2.544 times higher the chance of getting CKD.
Around 45.8% (116 females) and 29.9% (44males) of subjects have history of regular intake of analgesics, of whom 22.4% (26 females) and 15.9% (7 males) had CKD when compared with subjects who did not use any
analgesic drugs, among whom 11.7%of females and 17.5% of males developed CKD. The association was statistically significant for females. Those who had over use of NSAIDs among females 2.185 times higher chance of getting CKD.
Binary logistic regression analysis showed that, after adjusting for the risk factors which were significantly associated with CKD in univariate analysis, factors like Education (less than primary education), diabetes, un controlled hypertension, diet and H/o smoking were found to be significantly associated in multivariate analysis as shown in the Table 4.
DISCUSSION
GFR declines by 1 ml/min/1.732m2 after the age of 30 yrs in healthy person.4 The decrease in kidney function might be due to the changes in the kidney structure associated with aging.5 In this study, mean eGFR among males was significantly higher (100.45 ml/min/1.73 m2) than the mean eGFR of females (88.65 ml/min/1.73 m2). The mean eGFR is highest among 20-29 yrs (105.75 ml/min/1.73 m2), and gradually decreasing as the age advances (>60 yrs had 67.76 ml/min/1.73 m2). A study by Prem et al among 3398 healthy central govt. employees reported mean eGFR was 98+ 25.25 ml/min/1.73m2) by using MDRD equation.6 As per Singh et al, mean eGFR of 84.27±76.46 ml/min/1.73 m2 among CKD group while non CKD group had 116.65 ml/min/1.73 m2.3
In another study the prevalence of early stages I, II, III of CKD was 15.04%. The criteria used for defining CKD was MDRD formula and microalbuminuria based on KDOQI guidelines.6 In large US population based studies like NHANES II and III estimated the prevalence 10.03% and 13.07% in 1988-94 and 1999-2004 accordingly.7 In a south Asian ethnic people of Britain were mostly 1st generation migrants from India showed 8.7% prevalence of microalbuminuria. In a study from Delhi and adjoining area by Singh et al shown prevalence of late stages of CKD (3,4&5) 4.2% using original MDRD equation.8 In contrast the present study estimated 6.3% using modified MDRD equation. But the SEEK study showed 5.9% which was almost similar to the present study.3 A study by Kidney help trust from Chennai by Mani et al showed the prevalence of eGFR <80 ml/min/1.73 m2 0.86-1.39% from 2 different rural population which is much lower than the present study, because they have subjected those who had abnormal urine findings to blood investigation (serum creatinine).9
Prevalence of CKD was highest among 60 years and above (25.6%) and lowest among 20–29 years (6.2%) in this study. It also observed that increasing age was significantly associated with CKD (p-value is <0.01). This finding is consistent with Singh et al showed old age was significantly associated with CKD (p=0.0001), Singh et al concluded that as the age increases median eGFR decrease and prevalence of low eGFR increase and Varma et al showed age >40 yrs with OR= 1.86 (CI 1.42-4.43) which was statistically significant (p-value-<0.001).3,6,8 Though the younger age group had a lesser prevalence compared to older age it is of public health importance as the younger age will be continuously exposed to the risk factors.
This study shows higher prevalence of CKD among females than males (37.3% vs. 62.7%) similar to Singh et aland contrast to the SEEK study where males had higher prevalence.2,8 This study shows majority of the study population belongs to the middle income group as per BG Prasad scale- Class II, III, and IV (32.8%, 30% and 24.8%). This is due to change in trend from
communicable to non-communicable diseases in developing countries.
There were no female smokers and alcoholics in this study. There were 46.3% (68) subjects who are smoking, among them 32.4% (22) were found to have CKD. There is significant association between smoking and CKD, Singh et al showed similar result that current smoker has association with CKD i.e. OR=1.885, 95% CI-1.100-2.339 with significant p-value among both the sex.8 Among 107 male who consumed alcohol, 23 (21.5%) had CKD. This study observed significant association between alcoholism and CKD similar to Singh et al study.8
In this study, among those who had diabetes (75), 36% (27) had CKD than non-diabetics (13.3%). This association is highly significant (p-value=0.000). This is very similar to SEEK study by Singh et al and Singh et al.3,8 Hypertension is a most important predictor of kidney damage and promotes rapid decline of GFR. Among 71 known hypertensive patients 18 patients (25.4%) had CKD than 14.9% among not a known hypertensive. Known hypertensives and uncontrolled hypertensives had significant association with CKD (p<0.05) in the present study. Singh et al, Varma et aland Singh et al showed similar results among hypertensives (p<0.05).3,6,8
Obesity is a risk factor for hypertension and diabetes, which is leading causes for CKD. This study shows, 42.8% had a normal BMI while 29.5% of the patients were pre-obese and 21.3% were obese. In the US and most of the developed nations, the obesity epidemic was considerably major threat to the health outcome progress made in the past several decades.3 In a recent study confirmed that there is a 3 times increased risk of developing CKD among people with obesity.10 Among 67 CKD patients, 85.1% (57) had proteinuria than those do not had proteinuria (10) 2.9% which was statistically significant (p=0.00). Singh et al study revealed that 79.6% which is slightly lower than the present study (85.1%).3 Singh et al study revealed OR= 6.806 (95% CI=3.632-12.754) with significant p value.8
Those who attained menopause had higher prevalence (24%) than menstruating women (12.1%) which is statistically significant (p=0.01). Salve, Mahajan et al concluded in their study that post-menopausal groups are high risk groups.11 Educational status, diet, marital status and abdominal obesity has significant association with CKD (<0.05). Among females, analgesic intake, H/o heart disease and h/o high blood cholesterol has significant association.
CONCLUSION
cholesterol, proteinuria (dipstick >1+), smoking habit, alcoholics, obesity and history of overuse of NSAIDs. Other risk factors like diet, alcoholism among males, passive smoking, and proteinuria had significant association with CKD. Slum population with risk factors (like hypertension, diabetes, smoking, alcoholism) should be regularly screened for chronic kidney disease. Prevalence of CKD was found out using serum creatinine and urine dipstick for protein. But they are not subjected to detailed clinical and laboratory examination due to economic constraints. Since this study included only slum population, these results could not be generalized to the whole population. The cut off level for eGFR and urine protein levels were basically derived from US and Europe based studies. This may not be approximate to different racial, geographic or ethnic group of people and for all age groups. Hence further large scale and multicentric studies needed.
Funding: No funding sources Conflict of interest: None declared
Ethical approval: The study was approved by the Institutional Ethics Committee
REFERENCES
1. Prabahar MR, Chandrasekaran V, Soundararajan P. Epidemic of chronic kidney disease in India-what can be done? Saudi J Kidney Dis Transplant. 2008;19(5):847.
2. Rajapurkar MM, John GT, Kirpalani AL, Abraham G, Agarwal SK, Almeida AF, et al. What do we know about chronic kidney disease in India: first report of the Indian CKD registry. BMC Nephrol. 2012;13(1):10.
3. Singh AK, Farag YM, Mittal BV, Subramanian KK, Reddy SR, Acharya VN, et al. Epidemiology and risk factors of chronic kidney disease in India-results from the SEEK (Screening and Early Evaluation of Kidney Disease) study. BMC Nephrol. 2013;14(1):114.
4. Price CP, Finney H. Developments in the assessment of glomerular filtration rate. Clin Chim Acta Int J Clin Chem. 2000;297(1-2):55–66. 5. Lamb EJ, O’Riordan SE, Delaney MP. Kidney
function in older people: pathology, assessment and management. Clin Chim Acta Int J Clin Chem. 2003;334(1-2):25–40.
6. Varma PP, Raman DK, Ramakrishnan TS, Singh P, Varma A. Prevalence of early stages of chronic kidney disease in apparently healthy central government employees in India. Nephrol Dial Transplant. 2010;25(9):3011–7.
7. Coresh J, Astor BC, Greene T, Eknoyan G, Levey AS. Prevalence of chronic kidney disease and decreased kidney function in the adult US population: Third national health and nutrition examination survey. Am J Kidney Dis. 2003;41(1):1–12.
8. Singh NP, Ingle GK, Saini VK, Jami A, Beniwal P, Lal M, et al. Prevalence of low glomerular filtration rate, proteinuria and associated risk factors in North India using Cockcroft-Gault and Modification of Diet in Renal Disease equation: an observational, cross-sectional study. BMC Nephrol. 2009;10(1):4. 9. Mani MK. Prevention of chronic renal failure at the
community level. Kidney Int. 2003;63:S86–S89. 10. Ejerblad E. Obesity and Risk for Chronic Renal
Failure. J Am Soc Nephrol. 2006;17(6):1695–702. 11. Salve H, Mahajan S, Misra P. Prevalence of chronic
kidney diseases and its determinants among perimenopausal women in a rural area of North India: A community-based study. Indian J Nephrol. 2012;22(6):438–43.