Development of a Computer-Aided Application for
Analyzing ECG Signals and Detection of Cardiac
Arrhythmia Using Back Propagation Neural Network -
Part I: Model Development
Akinlolu A. Ponnle
Department of Electrical and Electronics Engineering, Federal University of Technology,
Akure, Nigeria
Oludare Y. Ogundepo
Information and Computer Technology Unit, Federal University of Petroleum Resources,
Effurun, Nigeria
Department of Electrical and Electronics Engineering, Federal University of Technology,
Akure, Nigeria
ABSTRACT
Electrocardiogram (ECG) is a graphic recording of the electrical activity produced by the heart. The accuracy of any electrocardiogram waveform extraction plays a vital role in helping a better diagnosis of any heart related illnesses. We present a computer-aided application model for detection of cardiac arrhythmia in ECG signal, which consists of signal pre-processing and detection of the ECG signal components adapting Pan-Tompkins and Hamilton-Tompkins algorithms; feature extraction from the detected QRS complexes, and classification of the beats extracted from QRS complexes using Back Propagation Neural Network (BPNN). The application model was developed for ECG signal classification under ‘Normal’ or ‘Abnormal’ heartbeats to detect cardiac arrhythmia in the ECG signal. The model was trained with standard arrhythmia database of Massachusetts Institute of Technology Division of Health Science and Technology/Beth Israel Hospital (MIT-BIH), and taking into account the Association for the Advance of Medical Instrumentation (AAMI) standard. The performance of the developed application model for classification of ECG signals was investigated using the MIT-BIH database. The accuracy of detection and extraction of the signal components and features (based only on the MIT-BIH database used) shows that the developed application model can be employed for the detection of heart diseases in patients.
Keywords
Electrocardiogram (ECG), QRS complex, cardiac arrhythmia, back propagation neural network, classification accuracy
1.
INTRODUCTION
Biomedical signals are observations of physiological activities of organisms, ranging from protein sequences, tissue and organ images, to neural and cardiac rhythms. Biomedical signals are obtained by electrodes that record the variations in electrical potential generated by physiological processes. Each physiological process is associated with certain types of signals that reflect their nature and activities. Observing these signals and comparing them to their known norms, diseases or disorders can often be detected. When such measurements are observed over a period of time, a one dimensional time-series is obtained which is called a physiological signal. Arrhythmia is a generalized term used to denote any disturbances in the
heart's rhythm. Cardiac Arrhythmia is an abnormal rate of muscle contractions in the heart. These abnormalities of heart may cause sudden cardiac arrest or cause damage to heart. Proper diagnosis of arrhythmia requires an electrocardiogram.
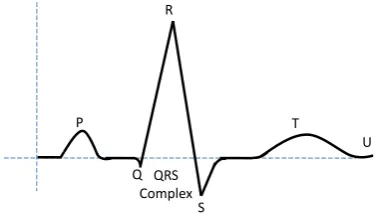
An electrocardiogram is a graphic recording of the electrical activity produced by the heart. Electrical activity radiates from the heart in all directions. The ECG signal is recorded by properly pasting a certain number of electrodes on the body [1]. A typical ECG signal of one heart beat is shown in Figure 1.
Figure 1: A stylized ECG signal of one heart beat.
The heart provides the driving force for the circulation of blood. It contains four-chambered pump with two atria for collection of blood and two ventricles for pumping out of blood. The resting or filling phase of a cardiac chamber is called diastole; the contracting or pumping phase is called systole. A normal ECG pattern consists of P wave, QRS complex, and T wave. The QRS complex, in turn, includes three separate waves: Q, R and S. All these are generated when the cardiac impulse goes through the ventricles. The P wave depends on electrical currents generated when the atria depolarize before contraction, and the QRS complex is produced by currents arising when the ventricles depolarize prior to contraction. Therefore, P wave as well as the components of the QRS complex corresponds to depolarization waves. The T wave, which is caused by currents arising when the ventricles recover from the depolarization state, is known as the repolarization wave.
By interpreting the details in the ECG waveform, a wide range of heart conditions can be diagnosed. Therefore, the quality of the signal is extremely important. Signal processing
P
Q R
S
T
U
is performed in the vast majority of systems for ECG analysis and interpretation. It is used to extract some characteristic parameters [2], [3]. Now a days, biomedical signal processing has been towards quantitative or the objective analysis of physiological systems and phenomena via signal analysis [4], [5].
Many researchers have worked towards reduction of noise in ECG signal [6], [7]. In recent times, a number of techniques have been developed to detect ECG features such as amplitude and time intervals as well as frequency domain representations [8], [9], [10]. Also, several researchers have developed various methodologies and algorithms for analyzing and classifying ECG signal. These methods include Digital Signal Processing, Knowledge-based System, Rule-based system, Fuzzy Logic System, Artificial Neural Network, and Hybrid System [11]. Other methods include Genetic Algorithm, Support Vector Machines, Self Organizing Map, Wavelet-Domain Hidden Markov Models, Bayesian and other methods with each method having its own advantages and disadvantages [12], [13].
An approach for effective feature extraction from ECG signal was described by Saxena et al., (1997). Their approach used an efficient composite method developed for data compression; signal retrieval and feature extraction with error-back propagation (EBP) artificial neural network (ANN). Their approach showed that the composite method can be used for efficient data management and feature of extraction of ECG signals in many real-time applications [14].
As reported by Upasani and Kharadkar, (2012), Silipo and Marchesi (1998) showed that ANN’s approach is capable of dealing with the ambiguous nature of the ECG signal when tested and compared with the most traditional ECG analysis on appropriate databases [11], [15]. Castro et al, (2000) put forth a novel approach for ECG feature extraction with an algorithm, based on an optimal mother wavelet [16]. Saxena et al. (2002) used a modified combined wavelet transforms technique. It involves Quadratic Spline Wavelet (QSWT) for QRS detection, and the Daubechies Six Coefficient (DU6) wavelet for P and T detection [17].
Owis et al., (2002) used blind source separation techniques which are Principal Component Analysis (PCA) and Independent Component Analysis (ICA) for classification of ECG signals. The features were classified by using Minimum Distance classifier, Nearest Neighbor classifier, and Bayes Minimum Error classifier. Highest accuracy of 84.4% was achieved with the nearest neighbor classifier [18]. Povinelli et al., (2002) used phase space based method with ANN to identify life threatening arrhythmias. Average accuracy of 93.75% over all classes capable of detecting and classifying was reported [19]. Alexakis et al., (2003) used time interval and morphological features to classify ECG into normal and arrhythmic. The classification used ANN and Linear Discriminant Analysis (LDA). Data from Diabetic Clinic of the Royal Hallamshire Hospital in Sheffield was used. The ANN used (multilayer perceptron neural network) gave more accurate results and average accuracy of 85.07% was achieved [20]. Ramli and Ahmad (2003) used signal analysis technique for feature extraction. The technique is cross-correlation analysis based [21]. Xu and Liu (2004) described an algorithm using Slope Vector Waveform (SVW) for ECG QRS complex detection and RR interval evaluation [22].
Zhao and Zhan (2005) used wavelet transform and support vector machines with Gaussian kernel for classification of different ECG heart rhythm. The results of computer simulations to determine the performance of the proposed approach reached the overall accuracy of 99.68% [23]. Mahmoodabadi et al (2005) used Daubechies Wavelets Transform for ECG feature extraction. They achieved sensitivity of 99.18% and positive predictivity of 98% [24]. Tayel and El-Bouridy (2006, 2008) used a technique for ECG intensity image classification by extracting their feature using wavelet transformation and feed forward back propagation neural network. The ANN uses adaptive learning rate with momentum term algorithm as a supervised classifier. Classification accuracy of 92% was achieved for the wavelet decomposition, and 95% for edge detection [25], [26]. Hadhoud et al., (2006) used FFT, Autoregressive Modeling (AR) and Principal Component Analysis (PCA) for feature extraction, and Feed Forward Multilayer Neural Network (FFMNN) as classifier. Highest accuracy of 92.7% was achieved with the PCA [27]. De Chazal and Reilly (2006) used morphology and heart beat interval with Linear Discriminate (LD) as classifier. Average accuracy of 85.9% was achieved [28].
Tadejko and Rakowski (2007) presented the classification performance of an automatic classifier of ECG for the detection of abnormal beats with feature sets based on ECG morphology and RR-intervals. Configuration adopted a Kohonen self-organizing maps (SOM) for analysis of signal features and clustering. Also, it was used with learning vector quantization (LVQ) algorithms using the data from the records recommended by ANSI/AAMI EC57 standard [29]. Alan and Nikola (2007) applied Chaos Theory to ECG feature extraction [30]. Sufi et al (2008) formulated a new ECG obfuscation method for feature extraction and corruption detection [31]. Chouhan and Mehta (2008) used adaptive quantized threshold for detection of QRS complexes. Detection rate of 98.56% and positive predictivity of 99.18% were achieved [32]. Jen and Hwang (2008) formulated an approach using Cepstrum Coefficient method for feature extraction from long term ECG signals, and artificial neural network (ANN) for classification. MIT-BIH database was used, and accuracy of diagnosis was 97.5% [33]. Ubeyli (2009) used Lyapunov exponents and wavelet coefficients with ANN as classifier. Average accuracy of 93.9% was achieved [34].
Fatemian and Hatzinakos (2009) used new wavelet based framework for ECG feature extraction. Identification rate of 99.61% was achieved [35]. Pedro et al. (2010) used Wavelet Transform (WT) with state of the art Continuous Density Hidden Markov Models (CDHMMs) for ECG classification. They used MIT-BIH database for experimental results [36].
of features which is a combination of S-transform (ST) and wavelet transform (WT) based features along with temporal features. The extracted feature set is independently classified using multilayer perceptron neural network (MLPNN). MIT-BIH database was used and average accuracy of 97.5% was achieved [39].
The aim of this work is to develop a cost-effective computer – aided application to analyze ECG signals with a view to detecting cardiac arrhythmia. In this paper, the specific objective is to develop a model consisting of method of pre-processing and apply analytical methods (DSP with knowledge-based) for feature extraction taking into account QRS estimation, amplitude and time variability of ECG signals; and use back-propagation neural network for classification and diagnosis of cardiac arrhythmia. Back-propagation neural network (BPNN) is a nonlinear multilayer network used for training a set of inputs with their corresponding targets. When new inputs that were not part of the training set are simulated with the trained object, the new input gives an output similar to the correct output for input vectors used in training that are similar to the new input being presented. BPNN has been shown in the literature to be very good for pattern recognition, and ECG interpretation [40]. The developed model processes each signal and detects the beats as normal or abnormal. We evaluate measurement and detection accuracy of the developed model using the MIT-BIH database [41], and taking into account the AAMI standard [42].
2.
MATERIALS AND METHODS
The development of the model for the application can be divided into the following stages: ECG Signal Pre-processing, Feature Detection, Feature Extraction, and Feature Classification using BPNN. For the signal pre-processing and feature detection, we made use of Pan-Tompkins and Hamilton-Tompkins algorithms [43], [44], and adapted them to suit our application. The algorithms are more popular in QRS detection methods. For the feature classification by BPNN, we adopted MATLAB in-built Levenberg-Marquardt (LM) algorithm [45], [46], [47]. The model accepts and works on already digitally acquired ECG signal, and MATLAB software was used to both implement and evaluate the application model, using MIT-BIH database [41]. Figure 2 shows the block diagram representation of the developed ECG beat classifier.
Figure 2: Block diagram of the ECG beat classifier.
2.1
MIT-BIH Arrhythmia Database
To enable test and comparison of developed algorithms by researchers, common databases are used. The Massachusetts Institute of Technology Division of Health Science and Technology’s (MIT/BIH) arrhythmia database contains 48 records, each containing two-channel ECG signals for 30 minutes duration selected from 24-hr recordings of 47
individuals [41]. Many of these databases were developed at MIT and at Boston’s Beth Israel Hospital (MIT-BIH), and a website where it can be found is called Physionet [48], [49]. There are 116,137 numbers of QRS complexes in the database. Each recording includes two leads; the modified limb lead II and one of the modified leads V1, V2, V4 or V5. Continuous ECG signals are band pass-filtered at 0.1–100 Hz and then digitized at 360 Hz. Twenty-three of the recordings (numbered in the range of 100–124) are intended to serve as a representative sample of routine clinical recordings and 25 recordings (numbered in the range of 200–234) contain complex ventricular, and supra-ventricular arrhythmias. The database contains annotation for both timing information and beat class information verified by independent experts. Each signal record consists of a period of about 30:06 minutes which is equivalent to 60000 samples.
Some records are labeled as ‘normal’, and some records are labeled ‘abnormal’. Among the ‘normal’ records used are records 100, 101, 103, 105, 106, 109, 111, 112, 113, 115, 116, 119, 122, and 124. Among the ‘abnormal records used are records 215, 220, 221, 222, 223, 228, 230, 232, 233 and 234.
2.2
ECG Signal Preprocessing
Usually while ECG data is being taken, different types of noise are added to the ECG signal such as electrode motion, power-line interferences, baseline wander, muscles noise etc., and corrupt the original signal. In order to get rid of the noise, a proper filter must be designed [50], [51]. Since very fine features present in an ECG signal may convey important information, it is important to have the signal as clean as possible.
A digital ECG signal is read by MATLAB, and is then normalized. The ECG data is then sampled (or re-sampled) at a frequency of 360 Hz (frequency used in the MIT/BIH records). The proposed ECG signal preprocessing model is shown in Figure 3. The preprocessing stages consist of low pass filtering, high pass filtering, differentiation, Hilbert transform, squaring and moving average. The low pass and high pass filters are cascaded to form a band pass filter.
Figure 3: Block diagram of the proposed ECG signal preprocessing stage
A Butterworth low pass filter (LPF) is used to eliminate noise such as the electromagnetic interference and 50Hz power line noise. The adopted designed LPF is of order 6, a cutoff frequency of 11 Hz and a sampling frequency of 360 Hz. The difference equation representing the LPF [43], [44] is
) ( ) ( ) ( ) ( ) ( )
(n 2yn1yn2 xn 2xn6 xn12
y (1)
The IIR LPF was designed in MATLAB and the designed filter object was then used to filter the input ECG signal.
The output of the LPF is passed into the high pass filter (HPF) to eliminate motion artifacts. The adopted designed HPF has a cutoff frequency of 5Hz, and the difference equation is given [43], [44] as
) ( ) ( ) ( ) ( ) ( )
(n y n1xn xn1 xn5 xn10
y (2)
Pre-processing Components
Detection
Features Extraction
Feature Classifier
BPNN Normal Beats
Abnormal Beats Input ECG
Signal
LPF HPF Differentiation
Squaring Bandpass Filter
Moving Average Filter Input ECG
Signal Hilbert
Transform
The filtered ECG signal is then differentiated to give the slope information by accentuating QRS complexes relative to P and T wave. The differentiator also helps to overcome baseline wandering in the signal. The adopted difference equation used to design the differentiator [43], [44] is
) ( ) ( ) ( ) ( )
( 2 1 4 2 5
8y n xn xn xn xn (3) After the differentiation of the ECG signal, Hilbert Transform is applied to the signal to find the location of R-peak in the ECG signal. The output of the Hilbert transform is squared in order to emphasize the higher frequency component and attenuates the lower frequency component. This helps to suppress the P and T waves.
The squared signal is then passed into the moving average filter (MAF) to produce a waveform with smoothed features by performing moving window integration. The difference equation designed for the MAF is given as
N
n x N
n x N n x n
y( ) [ ( 1)] [ ( 2)]... [ ] (4) where N is the length of the MAF, i.e. N-point MAF. In our developed application, we used 3 for the value of N.
2.3
Detection of the ECG Signal
Components
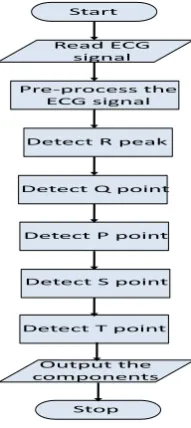
The next step after preprocessing of the ECG signal is the detection of the R, Q, S, P and T points on the signal waveform. These points were first detected before extracting the features needed for training the neural network object. The flow chart of Figure 4 represents the steps of obtaining the points. This was achieved by taking a beat out of the ECG waveform. The beats are extracted using 128 samples centered on R points. Pan-Tompkins and Hamilton-Tompkins algorithms were adapted for this operation to suit our application [43], [44].
Figure 4: Flow Chart of Detection of the ECG signal components.
Basically in our application, the detection of the points consists of the following steps, which is illustrated in Figure 5.
Figure 5: Detection of the ECG signal components.
a. Locate the maximum amplitude in the signal beat; this is the R peak. The point at which the R peak is detected is the R point Rp.
b. Shift some steps to the left of R peak, that is Rp - t1, and locate the minimum amplitude; this is the Q point Qp. t1 is the number of steps taken until the signal to the left of R begins to rise i.e. changes direction.
c. Shift some steps to the left of Qp, that is Qp - t2, and locate the maximum amplitude; this is the P point Pp. t2 is the number of steps taken until the signal to the left of Qp begins to fall i.e. changes direction.
d. Shift some steps to the right of Rp, that is Rp + t3, and locate the minimum amplitude; this is the S point Sp. t3 is the number of steps taken until the signal to the right of Rp begins to rise i.e. changes direction.
e. Shift some steps to the right of Sp, that is Sp + t4, and locate the maximum amplitude; this is the T point Tp. t4 is the number of steps taken until the signal to the right of Sp begins to fall i.e. changes direction.
In our adapted algorithms, we made the determination of t1, t2, t3 and t4 to be adaptive within some predefined time intervals with respect to some pre-determined values based on knowledge of standard normal ECG waveform; as for example, there could be possibility of false peaks to occur due to noise or otherwise between Sp and Tp. The step size was made equal to the sampling interval of the signal.
2.4
Features Extraction from the ECG
Signal
After all the ECG signal components (QRS complex, T wave and P wave) have been detected, the features used for classification were extracted from the ECG signal components. The features are of these categories: (1) Temporal (Pre-RR interval, Post-RR interval, Mean RR interval and Beat Ratio); and (2) Morphology (QRS duration). The QRS duration is calculated as the time difference between Sp and Qp. The standard QRS duration is between 80 and 120 milliseconds.
Pre-RR interval (RR1) is obtained by calculating the period between an R peak and the previous R peak; while the Post-RR interval (Post-RR2) is obtained by calculating the period between the R peak and the next R peak. Mean RR interval is obtained by calculating the mean of all the R-R periods within the ECG signal waveform. The standard RR duration is
Stop Output the components Detect T point
Detect S point Detect P point Detect Q point Detect R peak Pre-process the
ECG signal Read ECG
signal Start
Pp
Qp Rp
Sp
Tp
2
t
Qp Spt4
1
t Rp
3
between 0.4 and 1.2 seconds. The Beat Ratio (BR) is calculated as
2 1
RR RR
BR (5)
If BR > 0.9, the beat is considered to be “Normal”; but if BR < 0.9, the beat is considered to be “Abnormal” – which implies that a disease has been detected. The steps taken in extracting the features are shown in Figure 6. Furthermore, a weighting factor was included in the features that gives a ‘1’ to R-R intervals greater than 0.8 seconds and a ‘-1’ to R-R intervals less than 0.8 seconds.
Figure 6: Extraction of features from the ECG signal.
2.5
Back Propagation Neural Network
(BPNN)
In our developed application, we adopted the MATLAB in-built Levenberg-Marquardt (LM) algorithm for the BPNN. The LM algorithm was independently developed by Kenneth Levenberg and Donald Marquardt. It provides a numerical solution to the problem of minimizing a non-linear function [45], [46], [47]. In the field of ANN, the algorithm is suitable for training small and medium-sized problems.
In this application, the inputs to the BPNN are the features extracted. The features of the beats in the first 30 seconds of each ECG signal were extracted for training the neural network object. The MIT-BIH ECG signal records were used for the training. The simulation parameters of the BPNN are presented in Table 1. Seven records (100, 103, 106, 111, 113, 116 and 119) were selected from the set of normal records, while five records (215, 221, 223, 230 and 233) were selected from the set of abnormal records. The Normal beats are assigned a target of ‘1’, while the Abnormal beats are assigned a target of ‘0’. Whenever a new beat is tested with the BPNN object, the object is expected to classify correctly the beat as ‘1’ or ‘0’.
Table 1: The BPNN Simulation Parameters
Parameter Value
Architecture 3-layer (1 input, 1 hidden and 1
output)
Transfer Function {tansig, purelin}
Training Function Levenberg-Marquardt (trainlm) Training Epoch 500
Performance Function Mean-Squared Error (MSE) Performance Goal 1e-6
2.5.1
Training of the Neural Network
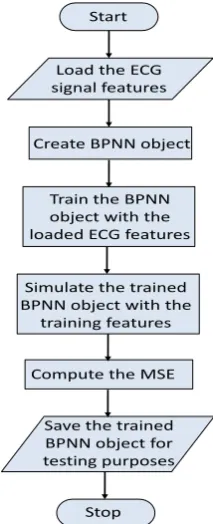
The features extracted from the selected ECG records were used to train a created BPNN object for the ECG signal classification purpose. A large number of features were utilized from each record. A matrix of the training inputs was formed and each column of the matrix represents a record, while each row represents a feature vector. A 3-layer feed-forward BPNN with 5 hidden neurons was first created in MATLAB, and then the features’ inputs and targets were used to train the created BPNN object. The created BPNN object is then saved for testing new ECG records for classification purpose. Figure 7 shows the processes involved in the BPNN training stage.
2.5.2
Classification of the ECG Signals using
BPNN
For the classification of an ECG signal, the features (Pre-RR interval, Post-RR interval, Mean RR interval, Beat Ratio, and QRS duration) are first extracted from the signal waveform after preprocessing. This is followed by simulating the extracted features with the BPNN object in MATLAB. If the target output of the simulation is ‘1’, it implies that Normal beats were detected throughout the entire ECG signal waveform tested. However, if the target output gives ‘0’, an Abnormal beat has been detected in the ECG signal waveform.
Figure 7: The BPNN Training Stage. Stop
Output features for BPNN training Check presence/ absence of P wave
Calculate QRS duration Calculate Beat
Ratio Calculate RR intervals, mean and
standard deviation Load signal components (R peak, Q, P, S and T)
Start
Stop Save the trained BPNN object for testing purposes Compute the MSE Simulate the trained BPNN object with the
training features Train the BPNN object with the loaded ECG features
Create BPNN object Load the ECG signal features
3.
RESULTS AND DISCUSSION
3.1
ECG Signal Pre-Processing
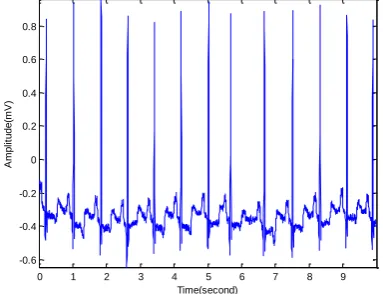
Waveforms of various pre-processing of the ECG signals are shown in Figures 8 – 14. An original ECG signal from MIT/BIH database is shown in Figure 8. The amplitude is in millivolts.
Figure 8: An Original ECG signal (Source: MIT/BIH database)
The ECG signal after normalization is displayed in Figure 9. The normalization process makes the ECG signal waveform amplitude to vary between +1mV and -1mV. This normalization is also required by MATLAB before further processing.
Figure 9: The ECG signal after normalization
The ECG signal after high pass filter is displayed in Figure 10.
Figure 10: The ECG signal after high pass filtering.
The high pass filter cuts off the lower frequency components of the ECG signal. The signal has already passed through the low pass filter before the high pass filter. So the signal displayed in Figure 10 is in effect, a band pass filtered signal.
The ECG signal after differentiation is displayed in Figure 11. The differentiator helps to obtain information on slope and overcome baseline drift problem, also to accentuate QRS complexes relative to P & T wave.
Figure 11: The ECG signal after differentiation.
The ECG signal after Hilbert transform is displayed in Figure 12. The Hilbert transforms process helps to locate R-peaks.
Figure 12: ECG signal after performing Hilbert Transform
The ECG signal after squaring, and averaging by the Moving Average Filter is displayed in Figure 13. The squaring process emphasizes the higher frequency components and attenuates the lower frequency component. The averaging process acts as a smoother and a moving window integrator.
Figure 13: The ECG signal after squaring and averaging (3 – step moving average)
0 1 2 3 4 5 6 7 8 9
-0.6 -0.4 -0.2 0 0.2 0.4 0.6 0.8
Time(second)
A
m
p
lit
u
d
e
(m
V
)
Original ECG Signal
0 1 2 3 4 5 6 7 8 9
-1 -0.8 -0.6 -0.4 -0.2 0 0.2 0.4 0.6 0.8 1
Time(second)
A
m
p
lit
u
d
e
(m
V
)
ECG Signal after Normalization
0 1 2 3 4 5 6 7 8 9 10
-0.7 -0.6 -0.5 -0.4 -0.3 -0.2 -0.1 0 0.1 0.2 0.3
Time(second)
A
m
p
lit
u
d
e
(m
V
)
ECG Signal after Highpass Filtering
0 1 2 3 4 5 6 7 8 9 10
-0.1 -0.08 -0.06 -0.04 -0.02 0 0.02 0.04 0.06 0.08
Time(second)
A
m
p
lit
u
d
e
(m
V
)
ECG Signal after Differentiation
0 1 2 3 4 5 6 7 8 9 10
0 0.01 0.02 0.03 0.04 0.05 0.06 0.07 0.08 0.09
Time(second)
A
m
p
lit
u
d
e
(m
V
)
ECG Signal after Hilbert transform
0 1 2 3 4 5 6 7 8 9 10
0 1 2 3 4 5 6x 10
-3
Time(second)
A
m
p
lit
u
d
e
(m
V
)
3.2
Feature detection
Figure 14 shows a single beat waveform of the ECG signal indicating the detected PQRST points; and Figure 15 shows the detected PQRST points within 3 R-R intervals.
Figure 14: A single beat waveform of an ECG signal indicating the detected PQRST points.
Figure 15: Detection of PQRST within 3 R-R intervals.
It can be observed that the PQRST points are well detected in Figure 14. Also in Figure 15, within 3 R-R intervals, the PQRST points are all detected, but while all the 3 R points are detected in time, they are not accurately detected in amplitude especially the second and the third R points from left to right.
3.3
Performance Evaluation
The performance of the classifier is estimated using Classification Accuracy (Acc), which measures the overall system performance over all classes of beats. It is the ratio of correctly classified patterns to the total number of patterns classified, and is expressed as
100
FN FP TN TP
TN TP Acc(%)
(6) where TP is the number of true positives detected (i.e. normal ECG classified as normal); FP is the number of false positives (i.e. abnormal ECG classified as normal); FN is the number of false negatives (i.e. normal ECG classified as abnormal); and TN is the number of true negatives (i.e. abnormal ECG classified as abnormal).
This evaluation was done after development of a GUI, and the complete application was installed on a computer. The details of this are in Part II of this paper.
4.
CONCLUSION
Automatic classification of ECG signal helps in recognizing heart diseases with less time. A computer-aided application model for the classification of ECG signals was developed and has been investigated using the MIT-BIH database. The model is based on some existing algorithms from literature, which were adapted. The developed system model involves the extraction of some morphological features of an ECG signal and simulating it with a trained BPNN object. The accuracy of detection of signal components and features extraction, show that the developed computer-aided application model can be employed for the detection of heart diseases in patients. Upon implementation on a computer with a GUI, it can serve as a means of diagnosis of condition of a patient’s heart from his/her ECG signal at a low cost. The completion and installation of the application is reported in Part II of this paper.
5.
REFERENCES
[1] Clark J.W. 1998, The Origin of Biopotentials, Medical Instrumentation: Application and Design, 3rd Edition, Edited by J.G. Webster, John Wiley and Sons, Inc., New York, NY Chap. 4, pp. 123-124.
[2] Ince T., Kiranyaz S., and Gabbouj M. 2009, A Generic and Robust System for Automated Patient-Specific Classification of ECG Signals, IEEE Transactions on Biomedical Engineering, Vol. 56, pp. 1415-1426.
[3] Kohler B.U., Henning C., and Orglmeister R. 2002, The Principles of Software QRS Detection, IEEE Engineering in Medicine and Biology Magazine, Vol. 21, Issue 1, pp. 42–57.
[4] Correia S., Miranda J., Silva L. and Barreto A. 2009, LabVIEW and MATLAB for ECG Acquisition, Filtering and Processing, In Proceedings of 3rd International Conference on Integrity, Reliability and Failure (IFR2009), Porto/Portugal, 20-24 July 2009, paper ref: S0228_A0402.
[5] Padma T., Latha M.M., and Ahmed A. 2009, ECG Compression and LabVIEW Implementation, Journal of Biomedical Science and Engineering, Vol. 2, pp 177-183.
[6] Afonso V. X., Tompkins W.J., Nguyen T.Q. and Luo S., 1999, ECG Beat Detection using Filter Banks, IEEE Transactions on Biomedical Engineering, Vol. 46, pp.192–202.
[7] Lee J. W. and Lee G. K 2005, Design of an Adaptive Filter with a Dynamic Structure for ECG Signal Processing. International Journal of Control, Automation, and Systems, Vol. 3, No. 1, pp. 137-142.
[8] Li C., Zheng C., and Tai C. 1995, Detection of ECG Characteristic Points using Wavelet Transforms, IEEE Transactions on Biomedical Engineering, Vol. 42, No. 1, pp. 21-28.
[9] Prasad K. and Sahambi J.S. 2003, Classification of ECG Arrhythmias using Multi-Resolution Analysis and Neural Networks, IEEE Transactions on Biomedical Engineering, Vol. 1, pp. 227-231.
6.4 6.5 6.6 6.7 6.8 6.9 7 7.1 7.2
-1 -0.8 -0.6 -0.4 -0.2 0 0.2 0.4 0.6 0.8 1
Time (second)
A
m
p
li
tu
d
e
(
m
V
)
One beat of an ECG signal
Filtered ECG R Q S T P
0.5 1 1.5 2 2.5 3 3.5
-1 -0.8 -0.6 -0.4 -0.2 0 0.2 0.4 0.6 0.8 1
Time (second)
A
m
p
li
tu
d
e
(
m
V
)
QRS detection in 3 RR intervals
[10] Martinez J.P., Almieda R., Olmos S., Rocha A.P. and Laguna P. 2004, A Wavelet based ECG Delineator: Evaluation on Standard Databases, IEEE Transactions on Biomedical Engineering, Vol. 51, No. 4, pp. 570-581.
[11] Upasani D.E and Kharadkar R.D. 2012, Automated ECG Diagnosis, IOSR Journal of Engineering, Vol. 2 (5), pp. 1265-1269.
[12] Karpagachelvi S., Arthanari M., and Sivakumar M. 2010, ECG Feature Extraction Techniques: A Survey Approach, International Journal of Computer Science and Information Security, Vol. 8, No. 1, pp. 76-80.
[13] Gupta K.O., and Chatur P.N. 2012, ECG Signal Analysis and Classification using Data Mining and Artificial Neural Networks, International Journal of Emerging Technology and Advanced Engineering, Vol. 2, Issue 1, pp. 56-60.
[14] Saxena S.C., Sharma A., and Chaudhary S.C. 1997, Data Compression and Feature Extraction of ECG Signals, International Journal of Systems Science, Vol. 28, No. 5, pp. 483-498.
[15] Silipo R., and Marchesi C. 1998, Artificial Neural Networks for Automatic ECG Analysis, IEEE Transactions on Signal Processing, Vol. 46, pp. 1417-1425.
[16] Castro B., Kogan D., and Geva A. B. 2000, ECG Feature Extraction using Optimal Mother Wavelet, The 21st IEEE Convention of the Electrical and Electronic Engineers in Israel, pp. 346-350.
[17] Saxena S.C., Kumar V., and Hamde S.T. 2002, Feature Extraction from ECG Signals using Wavelet Transforms for Disease Diagnostics, International Journal of Systems Science, Vol. 33, No. 13, pp. 1073-1085.
[18] Owis M.I., Youssef A.B.M., and Kadah Y.M. 2002, Characteristics of Electrocardiogram Signals based on Blind Source Separation, IEEE Transactions on Medical and Biological Engineering and Computing, Vol. 40, Issue 5, pp. 557-564.
[19] Povinelli R.J., Roberts F.M., Ropella K.M. and Johnson M.T. 2002, Are Non-Linear Ventricular Arrhythmia Characteristics Lost, as Signal Duration Decreases?, IEEE Conference on Computers in Cardiology, 22-25 Sept., 2002, pp. 221-224.
[20] Alexakis C., Nyongesa H.O., Saatchi R., Harris N.D., Davies C., Emery C., Ireland R.H. and Heller S.R. 2003, Feature Extraction and Classification of Electrocardiogram (ECG) Signals related to Hypoglycaemia, Conference on Computers in Cardiology, IEEE 2003, pp. 537-540.
[21] Ramli A.B. and Ahmad P.A. 2003, Correlation Analysis for Abnormal ECG Signal Features Extraction, 4th National Conference on Telecommunication Technology, NCTT 2003 Proceedings, pp. 232-237.
[22] Xu X., and Liu Y. 2004, ECG QRS Complex Detection Using Slope Vector Waveform (SVW) Algorithm, Proceedings of the 26th Annual International Conference of the IEEE EMBS, pp. 3597-3600.
[23] Zhao Q., and Zhan L. 2005, ECG Feature Extraction and Classification Using Wavelet Transform and Support
Vector Machines, International Conference on Neural Networks and Brain, ICNN&B ’05, Vol. 2, pp. 1089-1092.
[24] Mahmoodabadi S.Z., Ahmadian A., and Abolhasani M.D. 2005, ECG Feature Extraction using Daubechies Wavelets, Proceedings of the 5th IASTED International Conference on Visualization, Imaging and Image Processing”, pp. 343-348.
[25] Tayel M.B., and El-Bouridy M.E. 2006, ECG Images Classification Using Feature Extraction Based on Wavelet Transformation and Neural Network, ICGST International Conference on Artificial Intelligence and Machine Learning (AIML’06), 13-15 June 2006, pp. 101-103.
[26] Tayel M.B. and El-Bouridy M.E. 2008, ECG Images Classification using Artificial Neural Network based on Several Feature Extraction Methods, IEEE International Conference on Computer Engineering and Systems, ICCES2008, 25-27 Nov., 2008, Cairo, pp. 113-115.
[27] Hadhoud M.M.A., Eladawy M.I., and Farag A. 2006, Computer Aided Diagnosis of Cardiac Arrhythmias, IEEE International Conference on Computer Engineering and Systems, 5-7 Nov., 2006, Cairo, pp. 262-265.
[28] De Chazal P. and Reilly R.B. 2006, A Patient-Adapting Heartbeat Classifier using ECG Morphology and Heartbeat Interval Features, IEEE Transactions on Biomedical Engineering, Vol. 53, No.12, pp. 2535-2543.
[29] Tadejko P., and Rakowski W. 2007, Mathematical Morphology Based ECG Feature Extraction for the Purpose of Heartbeat Classification, 6th International Conference on Computer Information Systems and Industrial Management Applications, CISIM '07, 28-30 June 2007, Poland, pp. 322-327.
[30] Alan J. and Nikola B. 2007, Feature Extraction for ECG Time-Series Minimg based on Chaos Theory, Proceedings of 29th International Conference on Information Technology Interfaces, ITI2007, 25-28 June 2007, Croatia, pp. 63-68.
[31] Sufi F., Mahmoud S., and Khalil I. 2008, A New ECG Obfuscation Method: A Joint Feature Extraction and Corruption Approach, International Conference on Information Technology and Applications in Biomedicine, ITAB 2008, May 2008, China, pp. 334-337.
[32] Chouhan V.S. and Mehta S.S. 2008, Detection of QRS Complexes in 12-Lead ECG using Adaptive Quantized Threshold, IJCSNS International Journal of Computer Science and Network Security, Vol. 8, No. 1, pp. 155-163.
[33] Jen K. and Hwang Y. 2008, ECG Feature Extraction and Classification Using Cepstrum and Neural Networks, Journal of Medical and Biological Engineering, Vol. 28, No. 1, pp. 31-37.
[34] Ubeyli E.D. 2009, Statistics over Features of ECG Signals, Expert Systems with Applications, Vol. 36, No. 5, pp. 8758-8767.
International Conference on Digital Signal processing, 5-7 July 2009, Santorini-Hellas, pp. 1-6.
[36] Pedro R. G., Soares F.O., Correia J.H., and Lima C.S. 2010, ECG Data-Acquisition and Classification System by Using Wavelet-Domain Hidden Markov Models, 32nd Annual International Conference of the IEEE Engineering in Medicine and Biological Society, Aug. 31-Sept. 4 2010, Buenos Aires, Angetina, pp. 4670-4673.
[37] Jadhav S. M., Nalbalwar S. L., and Ashok A. G. 2011, Modular Neural Network based Arrhythmia Classification System using ECG Signal Data, International Journal of Information Technology and Knowledge Management, Volume 4, No. 1, pp. 205-209.
[38] Kohli S.S., Makwana N., Mishra N., and Sagar B. 2012, Hilbert Transform Based Adaptive ECG R-Peak Detection Technique, International Journal of Electrical and Computer Engineering (IJECE), Vol. 2, No. 5, pp. 639-643.
[39] Das M.K. and Ari S. 2014, ECG Beats Classification Using Mixture of Features, International Scholarly Research Notices, Vol. 2014, Article ID: 178436, pp. 1-12.
[40] Parganiha K. and Singh P.K. 2014, ECG Interpretation using Back Propagation Neural Networks, International Journal of Electronics and Communication Engineering and Technology, Vol. 5, Issue 4, pp. 19-24.
[41] MIT-BIH Database distribution, Massachusetts Institute of Technology, 77 Massachusetts Avenue, Cambridge,
MA, 02139, 1998.
http://www.physionet.org/physiobank/database/mitdb/
[42] Association for the Advancement of Medical Instrumentation, 1994, American National Standard for Ambulatory Electrocardiographs, Publication ANSI/AAMI EC38-1994.
[43] Pan J. and Tompkins W.J. 1985, A Real Time QRS Detection Algorithm, IEEE Transactions on Biomedical Engineering. BME-32(3), pp. 230-236.
[44] Hamilton P.S., and Tompkins W.J. 1986, Quantitative Investigation of QRS Detection Rules using the MIT/BIH Arrhythmia Database, IEEE Transactions on Biomedical Engineering. BME-33, pp. 1157-1165.
[45] Levenberg K. 1944, A Method for the Solution of Certain Problems in Least Squares, Quarterly of Applied Mathematics, Vol. 2, pp. 164-168.
[46] Marquardt D. 1963, An Algorithm for Least Squares Estimation of Non-linear Parameters, SIAM Journal on Applied Mathematics, Vol. 11(2), pp. 431-441.
[47] Hagan M.T. and Menhaj M. 1994, Training Feed-Forward Networks with the Marquardt Algorithm, IEEE Transactions on Neural Networks, Vol. 5, No. 6, pp. 989-993.
[48] Goldberger A.L., Amaral L.A., Glass L., Hausdorff J.M., Ivanov P.C., Mark R.G., Mietus J.E., Moody G.B., Peng C.K., and Stanley H.E. 2000, Physiobank, Physiotoolkit, and Physionet: Components of a New Research Resource for Complex Physiologic Signals, Circulation, Vol. 101, No. 23, pp. e215-e220.
[49] PhysioBank Archive Index,
http://www.physionet.org/physiobank/database/
[50] Chavan M. S., Agarwala R. A. and Uplane M.D. 2008, Design and Implementation of Digital FIR Equiripple Notch Filter on ECG Signal for removal of Power Line Interference, WSEAS Transaction on Signal Processing, Volume 4, Issue 4, pp. 221-230.