Comparative Analysis of different types of Malaria
Diseases using First Order Features
Ajala, Funmilola. A
Department of ComputerScience,
LAUTECH, Ogbomoso, Nigeria
Fenwa, Olusayo. D
Department of ComputerScience,
LAUTECH, Ogbomoso, Nigeria
Aku, Micheal. A
Department of ChemicalEngrg,
LAUTECH, Ogbomoso, Nigeria
ABSTRACT
Malaria is majorly caused by three parasitic organisms namely, P. malaria, P. vivax, P. falciparum. Physician (Micro-biologists, Laboratory technicians, Medical Practitioners, and medical experts) examines erythrocytes under light microscope to study the color and morphological changes toward malaria diagnosis. Assessment accuracy depends on the physician-pathological understanding. To help physicians in cases where they may be wrong, developing a computer assisted malaria parasite detection tool has helped modern pathological services where a physician is able to get assistance in order to quickly make better decision toward malaria diagnosis. Segmentation of medical images helps in identifying features that are needed for clinical diagnosis. First order features always give accurate information about the medical image and useful for identification and analysis. In this work, first order features which entails the mean, median, mode, standard deviation, energy, Skewness, kurtosis, area, entropy were extracted from the infected malaria images. The corresponding results show a significant steady value which could be useful during classification of medical images. The work is ongoing, the aim of the work is to classify the malaria parasite and to come up with a diagnostic system that will be able to diagnose tissue and blood cell based diseases like malaria, Ebola etc.
General terms
Malaria diseases, Parasitic organism
Keywords
Plasmodium, Segmentation, Energy, Kurtosis, Skewness, Entropy
1.
INTRODUCTION
Malaria is a parasitic disease caused by Plasmodium species viz. Plasmodium falciparum (P. falciparum), Plasmodium vivax (P. vivax), Plasmodium malariae (P. malariae) and Plasmodium. ovale (P. ovale). This parasite exhibits a complex life cycle involving an insect vector (mosquito) and a vertebrate host (human). Malaria is common in Asian and Sub African populations and is responsible for 1.5–2.7 millions of death per year. In the Indian population, the infected rate is higher in P. vivax infection cases than that of P. falciparum. It has been discover that 50–60% of malaria patients are infected by P. vivax while 40–50% are infected by P. falciparum in India [1]. Studies of malaria in sub-Saharan Africa have been focused on a single parasite species, Plasmodium falciparum, because of its predominance among clinical cases, and its association with severe disease and mortality. Three other species are widespread in Africa but generally thought to be uncommon among clinical malaria cases: Plasmodium malariae, Plasmodium ovalecurtisi and Plasmodium ovalewallikeri [2,3]. However recent cross-sectional population-based studies in Malawi, Uganda, Equatorial
Guinea and Angola, using Polymerase Chain Reaction (PCR) for parasite detection and species discrimination, have shown that these three species are found in between 1% and 17% of tested individuals, regardless of whether malaria symptoms were present [4]. In each of these studies, the majority of these occurrences were as co-infections with P. falciparum. [5] Advancement in computer technology has encouraged the researchers to develop software for assisting doctors in making decision without consulting the specialist directly, the development of this software exploits the potential of human intelligent such as reasoning, decision making, learning by experience and many others. In this paper, certain characteristics of malaria diseases using first order features were identified, and this can be used to perform statistical classification of different types of malaria disease.
2.
LITERATURE REVIEW
Malaria is a serious infectious disease caused by a peripheral blood parasite of the genus Plasmodium. According to the World Health Organization, it causes more than 1 million deaths arising from approximately 300 to 500 million infections every year [6]. It is a serious global health problem and rapid, precise determination of parasitemia is necessary for malaria research and in clinical settings. Many recent research efforts have been focused on new approaches to control the spread of malaria [7]. However, the manual recognition method is time consuming and effortful especially in situation where large number of samples require reliable analysis. Therefore, fast and efficient methods are required for detection of malaria parasites in order to avoid the untrue diagnosis of malaria [8].
sample. Malaria diseases using first order feature is carried out in this work and comparative analysis is made based on those features. These features include (i) Mean, (ii) Standard Deviation (iii) Skewness, (iv) Kurtosis, (v) Energy and (vi) Entropy. In this work, these features were extracted from each of the corresponding malaria diseases and then they were compared.
3.
METHODOLOGY
3.1
Image Acquisition / Database
The images that were used for the analysis were collected locally. The pixel values typically correspond to light intensity
in one or several spectral bands (gray images or colour images), but can also be related to various physical measures, such as depth, absorption or reflectance of sonic or electromagnetic waves, or nuclear magnetic resonance. a database that contains images for the three malaria parasite images was created and manipulated using Matlab environment and algorithms. Figure 1(a), (b), (c) show tissue images infected with P. falciparum, P.vivax and P.malaria respectively.
(a) (b) (c)
Figure 1: Infected tissue cell images (a) P. falciparum cell (b) P. vivax (c) P. malaria cell
3.2
Image Pre-processing
This involves filtering, selecting, randomizing, conversion to gray-scale, resizing and removal of objects that could affect the proper processing of the images. Before a computer vision method can be applied to image data in order to extract some
specific piece of information, it is usually necessary to process the data in order to ensure that it satisfies certain assumptions implied by the method. The gray scale results were presented in figure 2.
(a) (b) (c)
Figure 2: Preprocessed grayscale images for infected tissue cell (a) P. falciparum cell (b) P. vivax (c) P. malaria cell
3.3
First Order Feature
The following are the various first order features, which include the mean, area, standard deviation, correlation, kurtosis, entropy, energy and principal component analysis.
i Area
The area of an image is the calculation of the pixel values in the image. Pixel values give useful information in an image which is necessary in the analysis of the images.
ii Mean
µ = (1) where n is the number of sample and is the pixel value in vector form
iii Standard Deviation
= (2) Where n is no image sample
iv Energy
The energy is calculated by the equation 1 below:
(3)
where, i, j is the number of vectors found in the pixel locating each image.
v Entropy
Entropy is defined in equation 4 as:
(4)
vi Skewness
This is a measure of the degree of histogram asymmetry around the mean.
The skewness of a distribution is defined in equation 3 as
where µ is the mean of x, σ is the standard deviation of x, and
E(t) represents the expected value of the quantity t.
vii Kurtosis
This is a measure of the histogram sharpness.
(6)
viii Principal Component Analysis: This was done using standard algorithm
4.
RESULTS AND DISCUSSION
This section gives the detail of the result for the work.
4.1
User Interface Design
In figure 3, the system interface developed for analyzing and getting corresponding statistics for images was developed on MATLAB 7.10a. In the interface, the type of malaria diseases is selected and the statistics’ button is selected. This generates the values for each of the malaria diseases viz are P. falciparum, P. vivax and P. malariae
Figure 3: User interface
4.2
Discussion of Results
The results of the different malaria diseases are discussed categorically (i.e. based on each of them). These results are peculiar and agreeable to each of the disease type. The result in table 1 and figure 4 shown is for ten images of the falciparum diseased cells, the values of the area of the image cell ranges from 3000 to 5000. In Table 2 and figure 5 , it is seen that for the area of cell images called P. falciparum, the area is sparsely distributed, and has lied between a certain pixel values of 29000 to 50000, but in terms of standard deviation, its values seems to be coherent and consistent even though there is a little error of tolerance. In Table 3 and figure 6, some peculiarity features of the P. vivax malaria diseases are notable:
i The Area of Pixels: The area of pixels in malaria diseases called P. vivax, are consistent within the range of 56000 and 60000; these consistency is a major identifier and characteristics nature of the image cell.
ii The Standard Deviation: The standard deviation seems to be consistent and no deviation was observed, and it is coherence was consistent.
iii The mean:The values of the mean are also consistent with each other and also identifiable and measurable
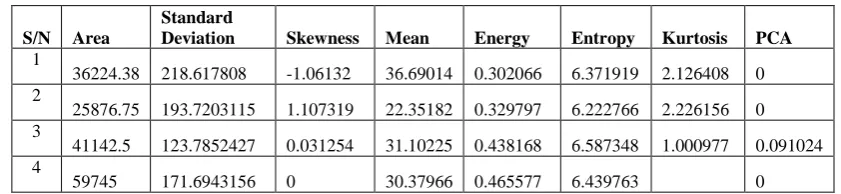
In figure 6, the statistical distribution of diseases infected with P. malaria are shown above.
i Standard Deviation: The values of the standard deviation gotten, seems to be consistent and coherent, within the ranges of 20000 to 25000 pixels.
ii Mean: The value of the mean seems not to be consistent.
iii Area: The values of the area gotten are also inconsistent and varies with varying images
As shown in figure 7, it is observed that the areas of the pixels of the P. vivax show more consistency than that of P. falciparum which is a major disease in Africa. Its pixel value ranges from 5000 to 6000 while for the P. falciparum, and P. malaria, its pixel values are inconsistent.
Table 1: P. Falciparum Results
S/N Area
Standard
Deviation Skewness Mean Energy Entropy Kurtosis PCA
1
36224.38 218.617808 -1.06132 36.69014 0.302066 6.371919 2.126408 0 2
25876.75 193.7203115 1.107319 22.35182 0.329797 6.222766 2.226156 0 3
41142.5 123.7852427 0.031254 31.10225 0.438168 6.587348 1.000977 0.091024 4
5
58121.88 172.6036275 -1.85327 23.44342 0.528646 6.071018 4.4346 -0.01791 6
50070.75 187.3461405 -0.88918 22.41925 0.213459 5.094442 1.790643 0 7
64916 185.0778453 0 21.3728 0.733874 5.090425 0 8
51485.13 190.9870656 -1.17895 26.43771 0.44988 6.236525 2.389917 0 9
29173.25 167.50236 -5.38816 26.76869 0.335998 6.768417 30.03226 0 10
46313 179.1134186 -1.03881 69.78849 0.094545 7.490831 2.079129 -0.01783
Figure 4: Statistical Distribution of P. falciparum
Table 2: Statistical Distribution of P. Vivax
S/ N
Area
Standard
Deviation Skewness Mean Energy Entropy Kurtosis PCA
1
57878.63 200.1954 - 76.10553 0.165683 6.182439 - 0 2
58315.13 197.096 - 73.48569 0.133635 6.414192 - 0 3
58050.63 198.8765 - 74.59358 0.134804 6.40885 - 0 4
58150.13 202.182 - 71.92386 0.147891 6.30527 - 0 5
54720.75 197.4585 - 75.08685 0.102284 6.532126 - 0 6
54417 194.5126 - 75.4002 0.082203 6.684628 - 0 7
57455.5 194.8261 - 71.05711 0.180132 6.700451 - 0 8
58192 189.6271 - 72.05866 0.134204 6.736853 - 0 9
56240.63 191.2715 - 73.33925 0.130787 6.837997 - 0 10
56148.5 194.4744 - 75.55794 0.113761 6.687059 - 0 0
10 20 30 40 50 60 70 80
1 2 3 4 5 6 7 8 9 10
P i x e l
V a l u e s
Number of Images
Statistical Distribution of P. falciparum
Area
Figure 5: Statistical Distribution of P. vivaxe
Table 3: Statistical Distribution of P. Malaria
S/N
Area
Standard
Deviation Skewness Mean Energy Entropy Kurtosis PCA
1
37941 208.1495 -0.25198 29.39706 0.255393 6.640496 1.063492 0 2
38455.5 200.6915 0.046888 38.69377 0.23019 6.819656 1.002198 0 3
37242.25 203.5533 -0.15673 38.43091 0.242649 6.910828 1.024564 -0.03121 4
25948.38 199.4099 0.694713 35.99288 0.158771 6.857048 1.482627 0 5
25942.13 199.4118 0.676256 37.04457 0.175479 6.843171 1.457322 0 6
28987.5 203.6322 0.973067 38.53382 0.154278 6.863512 1.94686 0 7
30039.88 216.327 -0.33263 30.97793 0.346682 6.283714 1.110644 0 8
40831.25 229.1101 0.316386 22.60403 0.365121 5.926335 1.1001 0 9
40251.5 240.9784 -2.38035 17.11304 0.482231 4.953018 6.666077 0 10
40213.13 226.5132 -0.34894 30.7383 0.33824 5.95749 1.121761 0
Figure 6: Statistical Distribution of P. malaria
0 10 20 30 40 50 60 70 80
1 2 3 4 5 6 7 8 9 10
P i x e l
V a l u e s
Number of Images
Statistical Distribution of P. Vivaxe
Area
Standard Deviation Mean
0 5 10 15 20 25 30 35 40 45
1 2 3 4 5 6 7 8 9 10
P i x e l
V a l u e s
Number of Images
Statistical Distribution of P. Malaria
Area
Figure 7: Statistical Distribution of Area among the three types of Diseases
4.3
Histogram Equalization of Malaria Parasite
The resulting graphical display of the histogram equalization of the P. falciparum disease as shown in figure 5 above shows an empty status from values 0 to 148, and a steepy rise from 0 to 700 at the point between 150 and 200 and it later descends to point 700. This is shown in figure 8(a). The resulting graphical display of the histogram equalization of the P. vivax disease is shown in figure 8(b) below, shows an initial start from point o with intensity height of 250 and then a decrease
to intensity height 0 at point 20, an empty status is observed from point 20 to 80 where a gradual steepy rise is observed, which later falls and rise to a final halt of 250. The resulting graphical display of the histogram equalization of the P. malaria disease as shown in figure 8(c) below shows an initial empty status from point 0, but rises to intensity height of 600 at point 180, descends back to 200 at point 350, rises back to 800 at point 240 and falls back to 0 at point 250.
(a) (b) (c)
Figure 8: Histogram Equalization of Malaria Parasite (a) P. falciparum (b) P. vivax (c) P. malaria
5.
CONCLUSION
Malaria is a parasitic disease caused by Plasmodium species viz. Plasmodium falciparum (P. falciparum), Plasmodium vivax (P. vivax), Plasmodium malariae (P. malariae) and Plasmodimovale (P. ovale).Medical images have been of high significance over the years, as medical experts are looking for ways to improve analysis on images especially through the use of X-rays, CT scans and MRI scans. Advancement in technology has helped medical practitioners in achieving most of their desires in identifying binary objects and other
components in medical images which X-rays, CT scans and MRI scans cannot detect easily.
In this work, a comparative analysis was made on the three major types of Malaria diseases viz: P. malaria, P. falciparum, P. vivax. These analyses were based on first order features which include area, mean, standard deviation, kurtosis, Skewness, entropy and energy. Comparative analysis was carried out between the three types and it is seen that the P. vivax, has a consistent rage of pixel values in terms of area, than other diseased types of malaria, which can be useful as a major criterial in developing a classification system.
0 10000 20000 30000 40000 50000 60000 70000
1 2 3 4 5 6 7 8 9 10
Statistical Distribution of Area among Three
types of Malaria Disease
P. Malaria
P. falciparum
6.
FUTURE WORK
The work is ongoing; the aim of the work is to classify the malaria parasite and to come up with a classification diagnostic system that will be able to diagnose tissue and blood cell based diseases like malaria, BVC, Ebola etc.
7.
REFERENCES
[1] Chakraborty, C., Maiti, A. K., Pal, M., Ghosh, M., and Das, D.K (2012). Machine learning approach for automated screening of malaria parasite using light microscopic images. Journal of Microbiology. vol. 45 (2013), Page 97-106.
[2] Alves de Brito, C. F., Sousa, T. N., and Neto, A.M. (2013). “Omics”in the study of the major parasitic diseases malaria and schistosomiasis. Journal of Infection, Genetics and Evolution. 19(2013), pp 258-273.
[3] Savkare, S.S., and Narote, S.P. (2012). Automatic System for Classification of Erythrocytes Infected with Malaria and Identification of Paradites’s Life Stage. 2nd International Conference on Communication, Computing & Security.Procedia Technology vol. 6 (2012) 405 – 410
[4] Lee, S. J., Seo, E., and Cho, Y. (2013). Proposal for a new therapy for drug-resistant malaria using Plasmodium synthetic lethality inference. International Journal for Parasitology :Drugs and Drug ResistanceVol. 3(2013), pp 119-128.
[5] Sutherland, C. J.,Dinko,B, Oguike, M. C., Larbi, J. A. Bousema, T.(2013). Persistent detection of Plasmodium falciparum, P. malariae, P. ovalecurtisiand P. ovalewallikeri after ACTtreatment of asymptomatic Ghanaianschool-children. International Journal for Parasitology:Drugs and Drug Resistance. Vol. 3(2013), pp45-50.
[6] Tek, F. B., Dempster, A.G.,Kale, I. (2010). Parasite detection and identification for automated thin blood filmmalaria diagnosis. Computer Vision and Image Understanding,vol.114 (2010) 21–32.
[7] Tan, K. S.W., Sio, S. W. S., Sun, W., Kumar, S., Bin, W. Z. Tan, S. S. Ong, S. H. Kikuchi, H., and Oshima, (2007). MalariaCount: An image analysis-based program for the accurate determination of parasitemia Y. Journal of Microbiological Methods. vol. 68 (2007). pp 11–18
[8] Abdul-Nasir, A.S., Mashor, M. Y., and Mohamed, Z. (2013).Colour Image Segmentation Approach for Detection of MalariaParasites Using Various Colour Models and k-Means Clustering.WSEAS transactions on Biologyand Biomedicine. 10(1):41-54
[9] Brito-Loeza,C., Soberanis-Mukula, R., Uc-Cetina,V., Ruiz-Pi˜nab, H. (2013). An Automatic algorithm for the detection of Trypanosomacruzi parasites in blood sample images. Computer methods and programs in biomedicine. Vol. 112 (2013), pp 633–639.
[10]Tek, F. B.,Dempster, A. G., andKale, I. (2009). Computer vision for microscopy diagnosis of malaria. Malaria Journal. vol (8) 153
[11]Diaz, G. Gonzalenz, F. A., Romero, E. (2009). A semi-automatic method for quantification and classification of erythrocytes infected with malaria parasites in microscopic images, Journal of Biomedical Informatics 42, Science Direct, pp 296 307.
[12]Ross, N.E., Pritchard, C.J., Rubin, D.M. and Duse, A.G. (2006) Automated image processing method for the diagnosis and classification of malaria on thin blood smears. Medical & Biological Engineering & Computing, 44, 427-436
[13]Makkapati, V. V., Rao, R. M. (2009). Segmentation of malaria parasites in peripheral blood smear images, IEEE International Conference on Acoustics, Speech and Signal Processing.1361-1364.
[14]Raviraja, S., Bajpai, G., and Sharma, S. (2007). “Analysis of Detectingthe Malarial Parasite Infected Blood Images Using Statistical Based Approach”, IFMBE Proceedings, 3rd Kuala Lumpur International Conference on Biomedical Engineering. vol. 15, part 12, pp. 502-505,
[15]David A. F. and Jean P. (2003). Computer Vision: A Modern Approach, Pearson Education.
[16]Toha, S. and Ngah, U. K. (2007) Computer aided medical diagnosis for the identification of Malaria parasites. In: International Conference on Signal Processing, Communications and Networking (ICSCN '07), Chennai, India.
[17]Kumar, A., Choudhary, A., Tembhare, P. U., Pote, C. R. (2012). Enhanced Identification of Malarial Infected Objects using Otsu Algorithm from Thin Smear Digital Images. International Journal of Latest Research in Science and Technology. Vol.1(2) Page No159-163.