___________________ Abstract
The aim of this paper is to apply genetic algorithm (GA) to the solution of the environmental economic power dispatch problem. The environmental economic power dispatch is a multi-objective optimization problem. Fuel cost is considered as one of the objectives. The other objective is emissions such as SO2 or NOx or a combination of both. A trade-off relation between fuel cost and emissions can be formed through a pareto optimal front. Valve point opening and prohibited operating zones add non-smoothness and non-convexities to the objective functions. Evolutionary algorithms can efficiently solve such non-smooth and non-convex problems. Solutions need to be diversified and distributed among the whole range of the pareto optimal front. This allows operators to trade-off between fuel cost and emissions in feasible optimal regions. Applying genetic algorithm with diversity enhancement proves its effectiveness. Application of the algorithm on three and six unit systems is demonstrated.
Keywords: Genetic algorithms, Evolutionary programming, Environmental economic power dispatch, Non-convex functions, Non-smooth functions
1. Introduction
The environmental economic power dispatch is a multi-objective optimization problem. Fuel cost is considered as one of the objectives. Emissions such as SO2 and NOx are the other objectives. The multi objectives are traditionally combined into a single objective through weighting factors. Many researchers solved the smooth and convex environmental economic power dispatch problem by classical optimization methods based on linear and non-linear programming techniques [1, 2]. However, prohibited operating zones (POZ) and valve point loading create non-smooth and non-convex objective functions. This causes difficulties in solving the economic power dispatch problem by classical methods. Evolutionary algorithms are efficiently used to solve non-smooth and non-convex environmental economic power dispatch problems. Genetic algorithms (GA) for such problems has been used in [8, 12, 14, 22]. Others used particle swarm optimization (PSO) in [11, 13, 15, 16, 27]. Differential evolution (DE) is used in [17, 21, 26]. Artificial neural networks (ANN) are used in [5, 6]. Fuzzy set theory and interactive fuzzy satisfying methods are used in [3, 24, 26]. Stochastic methods are used in [1, 11]. A surrogate worth trade-off algorithm is used in [4]. Hybrid algorithms are used in [18, 19, 20, 23, 28, 30]. Evolutionary algorithms are used in [7, 9, 10]. A harmony search method is used in [25]. Hony bee mating is used in [24]. Backtracking search optimization is used in [29]. In this paper, a genetic algorithm with diversity enhancement is applied to solve the environmental economic power dispatch problem. The proposed method is applied to power systems of different scales that have been intensively
Jawad Talaq
Department of Electrical and Electronics Engineering, University of Bahrain, Bahrain
(Received 4 June 2018; accepted 20 September 2018)
the subject of research in literature. Simulation results are compared with results reported in literature. The results prove that the genetic algorithm based environmental economic dispatch (GAEED) with diversity enhancement technique is comparable with other successful evolutionary techniques to solving the non-smooth and non-convex environmental economic power dispatch problems.
2. Economic Emissions Power Dispatch
The economic emissions power dispatch (EEPD) involves the minimization of two objectives subject to equality and inequality constraints.
2.1. Objectives
The first objective is the total fuel cost. The fuel cost function is
NG k k C C 1 (1)
_min
2sin k k k
k k k k k k
k a b P c P e f P P
C (2)
The second objective is the total emissions. The emissions function is
NG k k E E 1 (3) ) exp( 2 k k k k k k k kk P P P
E (4)
2.2. Equality constraints
The equality constraints are simplified to total active power balance equation
0 1
D L
NG
k
k P P
P (5)
where PD is total power demand and PL is transmission losses.
0 1 2 T P B P B P B
PL (6)
2.3 Inequality constraints
These are minimum and maximum limits on power generation and prohibited operating zones.
NG k
P P
Pk_min k k_max 1,2,..., (7)
NG k NZ j P P
Pk U k k L k
j
j _ 1 1,.., , 1,..,
_ (8)
where Lj and Uj are lower and upper bounds of prohibited operating zone j.
3. Multi-objective Optimization
Two objectives may be combined through a weighting factor to form a single combined objective as given by (9) that can be optimized easily.
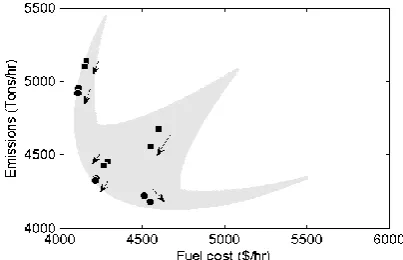
21 1 F F
Figure 2: Population sorting Figure 3: Crossover operation F1
F2
= 0 = 1
Figure 1: Pareto-optimal front Pareto-optimal
front
Feasible region
A trade-off relation is obtained if the weighting factor is adjusted for the whole range (0-1) as depicted in Figure 1. This is the pareto-optimal front which dominates all feasible solutions.
4. Genetic Algorithm Based Economic Emissions Power Dispatch
Genetic algorithms are population based searching techniques. It starts by initializing a population set known as parents. Parents undergo several operations to produce offspring. The process is continued for several generations. The produced offspring become the parents for the next generation. The basic operations are selection, crossover and mutation. Other operations to enhance the quality of the solutions can be included. Members of the population are known as chromosomes. Each chromosome consists of genes representing the variables of the problem. Variables are suitably coded for crossover and mutation. Real coding is implemented in this study. Each chromosome consists of the output power of the generators.
4.1 Selection
4.2. Crossover
The crossover operation aims to bring members closer to the pareto-optimal front. Members of the second group are moved closer to the first. Members of the first group are pushed away from the second. Members in the second group are mated with members in the first using (10).
2 index f2_par_1 -k f2_par_2 2 index f1_par_1 -k f1_par_2 min = index f_diff cross rand if k eachfor p
(10)
index k -P_par_1
P_par_2 = P_diff (11) P_diff k -P_par_1 =
P_par_1index index cross (12)
P_diff k
-P_par_2 =
P_par_2k k cross (13)
where f1_par_1 and f2_par_1 represent the objectives of the first group while f1_par_2 and f2_par_2 represent the objectives of the second group. Selected chromosome genes are adjusted through (12) and (13). kcross is a user defined parameter of a positive value less than
unity. The crossover operation for the population sorted in Figure 2 is shown in Figure 3.
4.3. Parents and offspring mating to enhance parents diversity
Parents diversity is enhanced by selecting the member from the parents with least distance from its neighbour. This member is replaced by a member that can be located between the two members with highest distance between them. The new member location is
m 3 j 2 k 1
new =k P +k P +k P
P (14)
where k1, k2 and k3 are weights having the sum of unity.
4.4. Parents and offspring combination
Parents and offspring are combined and sorted according to the non-dominance criterion to form a population of twice the original population number. The best Npop number of the
combination is selected to survive and proceed for mutation.
4.5. Mutation
Population members are selected for mutation with a mutation probability. The selected member is mutated using (15) and replaces the member that it most dominates using (16).
mutmut k
mut =P +k rand-0.5 ifrand p
P (15)
mut j 2 2 j pop P P f2_k -f2_mut f1_k -f1_mut max = f_diff N : 1 k f2_k f2_mut and f1_k f1_mut k with all for (16)4.6. Pareto-optimal front boundaries modification
k1 n1
bk1
temp1=P +k rand P -P
P and Ptemp2 =Pk2+kbrand
Pk2-Pn2
(17)
temp1
1
k1 2
temp1
2
k11 temp1
k1 P iff P f P andf P f P
P (18)
temp2
1
k2 2
temp2
2
k2 1temp2
k2 P iff P f P andf P f P
P (19)
where k1 represents the member of highest fuel cost and least emissions while k2 is the member of least fuel cost and highest emissions. Members n1 and n2 are the closest members.
4.7 Diversity Enhancement
Diversity enhancement is activated at the end of mutation. Each member is moved to the centre between its neighbours by replacing its variables by the mean of both as in (20).
1 2
5 .
0 n n
k P P
P (20)
4.8 Feasibility satisfaction
The power mismatch is determined when chromosomes are changed due to GA operations. Chromosomes are iteratively adjusted to satisfy the power balance using (21) and (22).
L D NG
j jk
k P P P
P
1
(21)
NG Pk
k k P
P (22)
where Pk is the power mismatch of chromosome k and Pjk are elements of vector Pk
representing the output power of generators. PL denotes the transmission losses defined by (6).
5. Simulation
The algorithm has been tested on two different systems. These systems consist of 3 and 6 units which have been the subject of intensive research in literature. The number of population used is 100 for all simulations. The crossover and mutation probabilities are set to 0.80 and 0.20 respectively.
5.1. 3-Units system
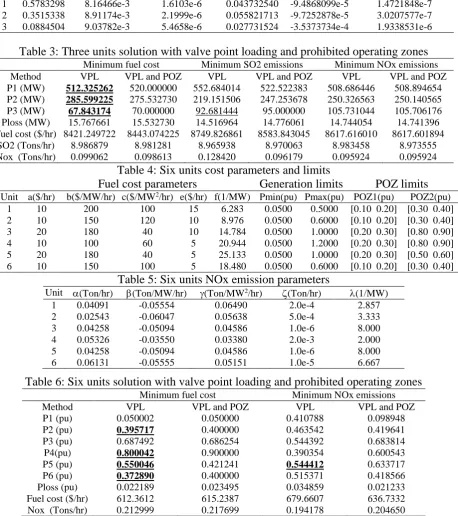
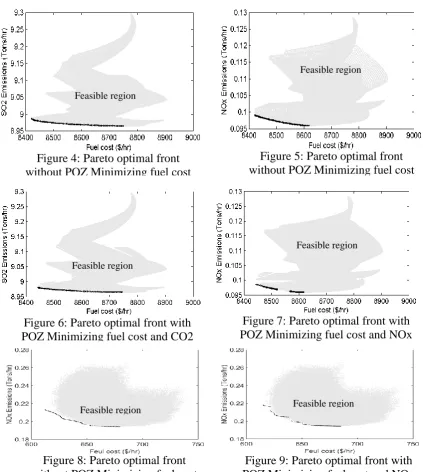
Fuel cost and emission parameters together with generation limits and prohibited zones are shown in Tables 1 and 2. Demand is 850.0 MW. Losses B-coefficients are in [10]. Two cases have been studied. One neglects prohibited zones (POZ) while the other includes them. Results are shown in Table 3 and Figure 4-7.
5.2. 6-Units system
Table 1: Three units cost parameters and operating limits
Fuel cost parameters Generation limits POZ limits Unit a($/hr) b($/MW/hr) c($/MW2/hr) e($/hr) f(1/MW) Pmin(MW) Pmax(MW) POZ1(MW) POZ2(MW)
1 561.0 7.9200 0.001562 200.0 0.0180 150.0 600.0 [200 210] [510 520] 2 310.0 7.8500 0.001940 200.0 0.0220 100.0 400.0 [180 190] [280 290] 3 78.0 7.9700 0.004820 60.0 0.0460 50.0 200.0 [60 70] [85 95]
Table 2: Three units emission parameters
SO2 emission parameters NOx emission parameters
Unit (Ton/hr) (Ton/MW/hr) (Ton/MW2/hr) (Ton/hr) (Ton/MW/hr) (Ton/MW2/hr)
1 0.5783298 8.16466e-3 1.6103e-6 0.043732540 -9.4868099e-5 1.4721848e-7 2 0.3515338 8.91174e-3 2.1999e-6 0.055821713 -9.7252878e-5 3.0207577e-7 3 0.0884504 9.03782e-3 5.4658e-6 0.027731524 -3.5373734e-4 1.9338531e-6 Table 3: Three units solution with valve point loading and prohibited operating zones
Minimum fuel cost Minimum SO2 emissions Minimum NOx emissions Method VPL VPL and POZ VPL VPL and POZ VPL VPL and POZ P1 (MW) 512.325262 520.000000 552.684014 522.522383 508.686446 508.894654 P2 (MW) 285.599225 275.532730 219.151506 247.253678 250.326563 250.140565 P3 (MW) 67.843174 70.000000 92.681444 95.000000 105.731044 105.706176 Ploss (MW) 15.767661 15.532730 14.516964 14.776061 14.744054 14.741396 Fuel cost ($/hr) 8421.249722 8443.074225 8749.826861 8583.843045 8617.616010 8617.601894
SO2 (Tons/hr) 8.986879 8.981281 8.965938 8.970063 8.983458 8.973555 Nox (Tons/hr) 0.099062 0.098613 0.128420 0.096179 0.095924 0.095924
Table 4: Six units cost parameters and limits
Fuel cost parameters Generation limits POZ limits Unit a($/hr) b($/MW/hr) c($/MW2/hr) e($/hr) f(1/MW) Pmin(pu) Pmax(pu) POZ1(pu) POZ2(pu)
1 10 200 100 15 6.283 0.0500 0.5000 [0.10 0.20] [0.30 0.40] 2 10 150 120 10 8.976 0.0500 0.6000 [0.10 0.20] [0.30 0.40] 3 20 180 40 10 14.784 0.0500 1.0000 [0.20 0.30] [0.80 0.90] 4 10 100 60 5 20.944 0.0500 1.2000 [0.20 0.30] [0.80 0.90] 5 20 180 40 5 25.133 0.0500 1.0000 [0.20 0.30] [0.50 0.60] 6 10 150 100 5 18.480 0.0500 0.6000 [0.10 0.20] [0.30 0.40]
Table 5: Six units NOx emission parameters
Unit (Ton/hr) (Ton/MW/hr) (Ton/MW2/hr) (Ton/hr) (1/MW)
1 0.04091 -0.05554 0.06490 2.0e-4 2.857
2 0.02543 -0.06047 0.05638 5.0e-4 3.333
3 0.04258 -0.05094 0.04586 1.0e-6 8.000
4 0.05326 -0.03550 0.03380 2.0e-3 2.000
5 0.04258 -0.05094 0.04586 1.0e-6 8.000
6 0.06131 -0.05555 0.05151 1.0e-5 6.667
Table 6: Six units solution with valve point loading and prohibited operating zones Minimum fuel cost Minimum NOx emissions
Method VPL VPL and POZ VPL VPL and POZ
P1 (pu) 0.050002 0.050000 0.410788 0.098948
P2 (pu) 0.395717 0.400000 0.463542 0.419641
P3 (pu) 0.687492 0.686254 0.544392 0.683814
P4(pu) 0.800042 0.900000 0.390354 0.600543
P5 (pu) 0.550046 0.421241 0.544412 0.633717
P6 (pu) 0.372890 0.400000 0.515371 0.418566
6. Conclusions
A genetic algorithm based environmental economic power dispatch with diversity enhancement (GAEED) is proposed in this paper. A genetic algorithm is an evolutionary algorithm that relies on mating between chromosomes to produce offspring. The operations of a genetic algorithm are selection, crossover and mutation. In this paper, a genetic algorithm is used to solve the multi-objective optimisation of the environmental economic power dispatch problem. Population of the genetic algorithm evolve to discover the pareto optimal front of the feasible solutions. The problem is non-smooth and non-convex due to
Figure 8: Pareto optimal front without POZ Minimizing fuel cost
and NOx emissions
Feasible region Feasible region
Figure 9: Pareto optimal front with POZ Minimizing fuel cost and NOx
emissions Figure 6: Pareto optimal front with
POZ Minimizing fuel cost and CO2 emissions
Feasible region
Figure 7: Pareto optimal front with POZ Minimizing fuel cost and NOx
emissions Feasible region Figure 4: Pareto optimal front
without POZ Minimizing fuel cost and SO2 emissions
Feasible region
Figure 5: Pareto optimal front without POZ Minimizing fuel cost
prohibited operating zones and valve point opening. A diversity enhancement aiming to diversify the solutions among the pareto optimal front to cover the whole front is proposed. The proposed algorithm has been simulated on three and six unit systems with transmission losses and non-smooth objective functions.
References
[1] Dhillon JS, Parti C, Kothari DP., Stochastic economic emission load dispatch, Electr Power Syst Res 1993, 26, 179-186
[2] Dhillon JS, Parti SC, Kothari DP., Multiobjective optimal thermal power dispatch, Int J Electr Power Energy Syst 1994, 16 (6), 383-389
[3] Hota P, Chakrabarti R, Chattopadhyay P. Economic emission load dispatch through an
interactive fuzzy satisfying method. Electr Power Syst Res 2000, 54, 151–157
[4] Dhillon JS, Kothari DP. The surrogate worth trade-off approach for multiobjective thermal
power dispatch problem. Electr Power Syst Res 2000, 56, 103–110
[5] Basu M. Fuel constrained economic emission load dispatch using hopfield neural networks,
Electr Power Syst Res 2002, 2, 63, 51– 57
[6] Balakrishnan S, Kannan PS, Aravindan C, Subathra P., On-line emission and economic load
dispatch using adaptive Hopfield neural network, Applied Soft Computing 2003, 2, 297–305
[7] Abido MA. A novel multiobjective evolutionary algorithm for environmental/economic power
dispatch, Electr Power Syst Res 2003, 65, 71–81
[8] Abido MA. A niched Pareto genetic algorithm for multiobjective environmental/ economic
dispatch, Int J Electr Power Energy Syst 2003, 25, 97–105
[9] Abido MA. Environmental/Economic Power Dispatch Using Multiobjective Evolutionary
Algorithms. IEEE Trans power syst 2003, 18, 4, 1529–1537
[10] AhKing RTF, Rughooputh HCS., Elitist multi-objective evolutionary algorithm for
environmental/economic dispatch., Cong Evolutionary Comp, 2003, 2, 1108–1114
[11] Lingfeng W, Chanan S., Stochastic economic emission load dispatch through a modified
particle swarm optimization algorithm. Electr Power Syst Res 2008, 78, 1466–1476
[12] Basu M., Dynamic economic emission dispatch using nondominated sorting genetic
algorithm-II. Int J Electr Power Energy Syst 2008, 30, 140–149
[13] S. Hemamalini, S., and Sishaj P Simon, Emission Constrained Economic Dispatch with
Valve-Point Effect using Particle Swarm Optimization, TENCON 2008 - 2008 IEEE Region
10 Conference, 19-21 Nov. 2008
[14] Osmana MS, Abo-Sinnab MA, Mousab AA. An ε-dominance-based multiobjective genetic
algorithm for economic emission load dispatch optimization problem, Electr Power Syst Res
2009, 79, 1561–1567
[15] Abido MA., Multiobjective particle swarm optimization for environmental/economic dispatch
problem., Electr Power Syst Res 2009, 79, 1105–1113
[16] Jiejin Cai, Xiaoqian Ma, Qiong Li, Lixiang Li, Haipeng Peng., A multi-objective chaotic
particle swarm optimization for environmental/economic dispatch. Energy Conversion and
Management 2009, 50, 1318–1325
[17] Wu LH, Wang YN, Yuan XF, Zhou SW., Environmental/economic power dispatch problem
using multi-objective differential evolution algorithm. Electr Power Syst Res 2010, 80, 1171–
1181
[18] Dun-wei Gong, Yong Zhang, Cheng-liang Qi., Environmental/economic power dispatch using a hybrid multi-objective optimization algorithm. Int J Electr Power Energy Syst 2010, 32, 607–614
[19] Aniruddha B, Pranab KC., Solving economic emission load dispatch problems using hybrid
[20] Aniruddha B, Chattopadhyay PK., Hybrid differential evolution with biogeography-based
optimization algorithm for solution of economic emission load dispatch problems., Expert
Systems with Applications 2011, 38, 14001–14010
[21] Lu Y, Zhou J, Qin H, Wang Y, Zhang Y., Environmental/economic dispatch problem of
power system by using an enhanced multi-objective differential evolution algorithm. Energy
Conversion and Management 2011, 52, 1175–1183
[22] Celal Y, Serdar O. Solution to scalarized environmental economic power dispatch problem by
using genetic algorithm., Int J Electr Power Energy Syst 2012, 38, 54-62
[23] Rahmat-Allah H, Moein P, Mohammad JM., Emission, reserve and economic load dispatch problem with non-smooth and non-convex cost functions using the hybrid bacterial
foraging-Nelder–Mead algorithm., Applied Energy 2012, 89, 443–453
[24] Ali Ghasemi., A fuzzified multi objective Interactive Honey Bee Mating Optimization for
Environmental/Economic Power Dispatch with valve point effect., Int J Electr Power Energy
Syst 2013, 49, 308-321
[25] Babak J, Vahid V., A modified harmony search method for environmental/economic load
dispatch of real-world power systems. Energy Conversion and Management 2014, 78,
661-675
[26] Manjaree P, Laxmi S, Manisha S., Environmental economic dispatch in multi-area power
system employing improved differential evolution with fuzzy selection. Applied Soft
Computing, 2015, 28, 498-510
[27] Vinay K J, Nikhil G, Niazi K R, Anil S., Modulated particle swarm optimization for economic
emission dispatch, Int J Electr Power Energy Syst, 2015, 73, 80-88
[28] Radosavljević J., A Solution to the Combined Economic and Emission Dispatch Using Hybrid
PSOGSA Algorithm, Appl Artificial Intellig, 2016, 30, 5, 445-474
[29] Chaib AE, Bouchekara HREH, Mehasni R, Abido MA., Optimal power flow with emission
and non-smooth cost functions using backtracking search optimization algorithm, Int J Electr
Power Energy Syst., 2016, 81, 64–77
[30] Neto JXV, Reynoso-Meza G, Ruppel TH, Mariani VC, Coelho LDS, Solving non-smooth economic dispatch by a new combination of continuous GRASP algorithm and differential
evolution, Int J Electr Power Energy Syst, 2017, 84, 13 – 24