Performance and Statistical Analysis of Chaotic Random
Bit Generator
S. M. Seeni Mohamed Aliar Maraikkayar
*, K. Rajakumar, R. Tamilselvi, M. Parisa Beham, A. Sabah
Afroze
Department of CSE, Sethu Institute of Technology, Virudhunagar, Tamil Nadu, India.
* Corresponding author. Tel.: 8883925991; email: [email protected] Manuscript submitted January 3, 2019; accepted March 16, 2019.
doi: 10.17706/ijcce.2019.8.2.83-92
Abstract: Medical Information transmitted through the internet and secured against any attacks is an international challenging fear. In the present scenario, a fabulous relation emerges between chaos and cryptography. Various features of chaotic systems such as initial state sensitivity, ergodicity, mixing properties and complexity in the structure produce deterministic pseudo randomness in the input data. Chaotic Random Bit Generator (CRBG) makes the bit sequence unpredictable by an intruder, in the field of medical research. In current years, mixture of chaos-based cryptosystems have been projected. To be used in medical field, a CRBG may require in meeting stronger desires than for any other applications. Motivated by all these issues, a novel chaotic random bit generator is proposed based on two different chaotic based logistic maps in parallel and with preliminary self-determining initial conditions. The random bit sequence which is chaotic in character is created by predicting the outputs of both the chaotic logistic maps. Also it is projected to put forward dissimilar tests by stressing some of its alluring arithmetic features, which make it an ideal preference for the expected random bit generation. Lastly, the results of all the statistical tests generated bit sequences, is tested under all the most powerful NIST suit tests for the prediction of randomness: The tests validate the exact expected uniqueness expected of real random sequences.
Key Words:Random bit generator, chaotic map, NIST tests, randomness.
1. Introduction
Very speedy growth in the communication era, especially the emerging networks have lengthened the data broadcasting area, which in turn present novel confront for defensiving the information from unlawful snooping. This rooted to explore the knowledge in challenges in the region of cryptography to accomplish the sturdy drive of new sheltered cryptographic methods. Due to the existence of this nearby relationship between chaos and cryptography, plenty chaos-based cryptosystems have been put forward since 1990. Chaos-based cryptosystems diverges in to analog and digital types. Analog chaos-based cryptosystems are occupying the organization and coordination of chaos. In Digital chaos-based cryptosystems, chaotic dissimilar dynamical systems are executed in incomplete computing accuracy.
design based device or software programme is used to take benefit of the accepted basis of uncertainty and formulate a bit succession free from biases and the association is a complicated task. In such scenario, the predicament can be eradicated by replacing a haphazard bit creator with a mystified arbitrary bit generator. [2]. Encryption quality mainly depends on the success of the random bit generator developed. There are quite a lot of methods used for authenticating the arbitrariness of the proposed CRBG. The various standards used for testing the sequences are: (i) National Institute of Standards and Technology (NIST) suite of arithmetical methods, (ii) The DIEHARD suite of numerical tests,(iii) The Crypt-XS suite of geometric method, and (iv) The Donald Knuth’s arithmetical tests. NIST algebraic methods group wrap a sufficient number of practically autonomous numerical methods, which recognize any discrepancy in the uncertainty. Hence for analyzing the unpredictability nature of the CRBG, the NIST test suite are used [3]. Yu et al.[4] proposed a dual image encryption algorithm based on standard Data Encryption algorithm (S-DES) and chaotic map. The plain text and cryptograph block were both 8 bits, execution speed was very fast but could not meet the security requirements. So the chaotic map is combined with the S-DES system to enhance the security by using the sensibility in the original value and randomness in the chaotic map. Their result showed that the encryption took one second for encrypting the image. The computing speed is quick and escapes from the exhaustion attacks. But the algorithm does not deal with any parameters related to the security level. Also it does not show any results with S-DES alone. Liu et al. [5] explained a new chaotic scrambling algorithm. Their algorithm involved the dynamic twice interval division and had larger key space. The method involved the one dimensional logistic maps to generate the chaotic sequence of real numbers. The number of iterations should also be less to speed up the operation. This is the drawback of their algorithm. The organization of the paper is as follows: Section 1 deals with the introduction of the random generators, concept of logistic map and the statistical tests used for the validation of randomness of the sequences. Section 2 explains the proposed methodology based on the Chaotic Random Bit Generator and the uniqueness of the proposed work. Section 3 explains the statistical tests and their procedure in evaluating the randomness of the sequences. Section 4 involves the testing strategy to validate the sequences in randomness and the Statistical Analysis of the Randomness of the Chaotic Sequences. Section 4 involves the results and discussion of the sample sequence randomness and their validation. Section 5 concludes the unique features of the proposed Random Bit generator and the validation of the generated sequences.
2. Proposed Methodology
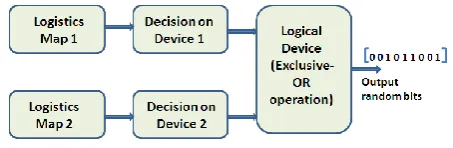
Based on the above surveys for random bit generation, a novel chaotic map based on the logistic map is defined for the creation of arbitrary sequences. The proposed chaotic random bit generator is shown in Fig. 1. The logistic map is a much uncomplicated geometric duplication frequently used to reveal the escalation of biological populations. Because of its geometric straightforwardness, this mock-up persists to be helpful test bed for innovative thoughts in bedlam theory as well as importance of confusion in cryptography. A CRBG is developed which depends on two logistic maps, early from arbitrary independent preliminary situation (X0, Y0
ε(0,1) and X0≠ Y0).
) 1 (
1 n n
n X X
X
(1))
1
(
1 n n
n
Y
Y
Y
(2)
1,if > median1 0, if < median1
k
a Xn
Xn
1,if > median2
0, if < median2
k
b Yn
Yn
Here median1 denotes the median of the values generated by the logistic map 1. Median2 denotes the median of the values generated by the logistic map 2.akand bkare the outputs from the two decision devices. The sequences are grouped as 10 bits in all the sequences. First 10 bits represent the first sequence (0-9), then from 10-19 bits as the second sequences and so on.
Fig. 1. Chaotic random bit generator.
The hexadecimal equivalent values for the corresponding 10 bits are calculated for both the 10 bit sequence values. The final bit sequence is generated by sending the outputs of the decision devices in hexadecimal value to the logical device which performs logical Exclusive – OR (EXOR) operation between two sequences. The generated random sequences used as a key for encryption and the encrypted image is not attacked by any statistical or differential attacks, as the level of the encryption quality and entropy gets increased with the increase in the number of blocks. The generated sequences randomness level is increased when compared with our previous work [6]. The chaotic sequence generated by the Random Generator is tested under various statistical tests and the randomness is evaluated.
3. Statistical Tests
The NIST test suite is an algebraic wrap up encompassing of 16 different tests. The random sequences which are generated by either software algorithms or hardware designs are based on cryptographic random based generators. NIST suits tests are broadly classified in to two groups. (i) Non-parameterized tests and (ii) Parameterized tests [3].
3.1. Non-parameterized Tests
3.1.1 Frequency (monobit) test
The sow of this non-parameterized test is to locate the percentage of quantity of zeroes and ones in the whole arbitrary values.
(1) The input sequence is considered as ε. (2) The test statisticSobsis calculated as
n S Sobs n
| |
(3)
(3) Next, the P-value is calculated using
P=
2
obs
S erfc
(4)
where erfcis the complementary error function
(4) Decision Rule based on the 1% stage defines that if the calculated P-value is < 0.01, then the conclusion is that the generated sequence is non-random.
3.1.2. Runs test
(1) The pre-test proportion is denoted as π of ones in the input binary sequence and is computed as
n j j
(5)(2) The next procedure is, if π-1/2 ≥ τ- 1, where τ=2/√n, then there is no need for the runs test. If the test is not apt, then the P-value is well thought-out as 0.0000.
(3) The test statistic Vn(obs)estimated as:
1 ) ( ) ( 1 1
k r obs V n k n (6)where r(k) = 0if εk=εk+1, and r(k) =1 otherwise. (4) Then the P-value is computed as:
) 1 ( 2 2 | ) 1 ( 2 ) ( | n n obs V
erfc n (7)
where erfc is the complementary error function in which the values are estimated from predefined complementary error function table.
3.1.3. Discrete fourier transform (spectral) test
This test estimates the acme elevation in the Discrete Fourier Transform of the estimated sequence. (1) The zeros and ones of the input sequence are considered as ε.
(2) Discrete Fourier Transform (DFT) is applied on to the generated sequence to produce a value represented as S,S = DFT(X).
(3) ThenMis estimated asM= modulus(S´) ≡ |S'|,where S´is the sub group consisting of the initialn/2
elements in S, and the modulus role fabricates a succession of acme heights. (4) Estimate the Tvalue
n T 05 . 0 1 log (8)
nis considered to be the 95 % of peak height threshold value. (5) EstimateN0, where
N0= 0.95 * n/2. (9)
N0is the customary hypothetical (95%) number of peaks (under the presumption of arbitrariness) that are a lesser than amount ofT.
(6) Then, ComputeN1which is the actual pragmatic integer of acme in Mthat are lesser than amount ofT. (7) Then, dvalue is calculated as:
4 / ) 05 (. ) 95 (. n ) N N (
d 1 0 (10)
(8) ThenP-value is estimated based on
2 | |d erfc (11)
3.2. Parameterized Tests
3.2.1. Frequency test within a block
The test starts with the severance of M-bit slabs and finding number of ones in the proposed block. (1)The input sequence is divided as N,
M n N (12)
n – No. ofnon-overlapping blocks.
(2)The quantityπiof ones in everyM-bit block is estimated as
M j M i M j i
1 ) 1 ( (13)for1 ≤ i ≤ N.
(3) Theχ2statistic χ2(obs)is calculated as:
N i i M obs 1 2 2 ) 2 / 1 ( 4 ) (
(14)(4)P-value = igamc (N/2, χ2(obs)/2) is computed, where igamc is the incomplete gamma function and the
values are intended from the existing equations. Same decision rule is followed.
3.2.2. Serial test
The serial test predicts the happening of all credible overlying m-bit sub groups across the whole sequence.
(1) An augmented sequence ε′ is explained by appending the initialm-1bits to the concluding value of the sequence for distinct values of n.
(2) The occurrence of all promising overlying m-bit slabs, all probable overlying(m-1)-bit blocks and all probable overlying(m-2)-bit slabs are estimated.
Letvi1 ...imrepresents the happening of the mbit designi1…imandvi1 ...im- 1denote the happening of the
(m-1)-bit designi1…im-1; and let vi1 ...im- 2denote the prevalence of the (m-2)-bit designi1…im-2. (3) Compute: n v n n v n n v n n v n n v n n v n m i m m m m m m m m m m i i i i m m i i i i m m i i i i m m i i m i i m m i i i i m m i
i i i
m m
2 2 1 2 1 2 1 1 1 1 1 1 1 1 1 1 1 1 ... 2 ... 2 2 2 ... ... 2 2 2 .. 2 ... 1 2 1 ... 1 ... 1 2 1 ... 2 .... 2 ... .... 2 2 ) 2 ( 2 2 ) 2 ( 2 2 ) 2 ( 2 (15) (4) Compute2 2 2
1
2 2 2 2 2
1 2
, and
2
m m m
m m m m
3.2.3. Approximate entropy test
The test contrast the happening of overlying slabs of two uninterrupted/neighbouring lengths (m and (m+1)) against the conventional value for an arbitrary sequence.
(1)noverlappingm-bit sequences are created by appending n-bit design to m-1bits from the beginning of the sequence to the finishing end of the sequence.
(2)noverlapping blocks denotes the frequency count. Tally of the m-bit ((m+1)-bit) values is represented as Cim, where iis them-bit value.
n i Cm
i #
for each value of i. (18)
(4) Compute
2 1 0 ) (log
mi
i i
m
(19)(5) The above steps are again repeated by changing mby m+1. (6) The test statistics are computed by
(20) Same Decision rule is followed.
4. Statistical Analysis of the Randomness of the Chaotic Sequences
Among the various statistical tests, the NIST test depends on the hypothesis testing. In this proposed work, the test validate whether the generated sequence of zeroes and ones is a chance represented as unacceptable (null Hypothesis H0). For each test, an applicable randomness value is chosen and used to
resolve the acceptance or rejection of the Hohypothesis. A significance value (α) be preferred for the tests
and if P-value ≥ α, then the unacceptable hypothesis is acknowledged, i.e., the succession is determined to be random. If P-value < α, then the unacceptable hypothesis is discarded, i.e., the succession is determined to be non-random. In practical scenario, the significance level (α) is selected in the intermission [0.001, 0.01]. The
α= 0.01 designates that one would anticipate one sequence out of 100 sequences to be discarded. For the numerical experimentations on the developed CRBG, 100 sequences are taken (sample size m= 100) and each progression has been initialized from a randomly selected seed, (X0, Y0ε(0, 1) and λ1= λ2= 4). The
series of satisfactory proportion is computed by using the confidence interval defined by
ˆ(1 ˆ)
ˆ 3 p p ,
p
m
(21)
where mis the sample size and pˆ = 1 –α, which are m= 100 and pˆ = 1 –α= 0.99 for the present analysis. So the series of satisfactory proportion is [0.9303, 1.0497].
5. Results and Discussion
A Sample Result of CRBG is considered as[0 1 1 0 0 0 0 1 1 1].
5.1. Monobit Test
According to the test description, in the given sequence zeros and ones are converted in to -1 and +1 and added to produce S. Since the P-value is 1, the given sequence is random.
5.2. Runs Test
Pvalruntest= 0.5271. Hence the given sequence is random.
5.3. Discrete Fourier Transform Test
CalculatedP-value is 0.4682. So the given sequence is random. Frequency Test within a Block
According to the test description,
N
i i M obs
1
2 2
) 2 / 1 ( 4 )
(
=3.6667 andPvalfreq=0.4957.
5.4. Serial Test
According to the test description, ψ2m = 4.40, ψ2m-1 = 2.4 and ψ2m-2 = 0, ψ2m = 2, 2ψ2m=-4.0,
Pvalserial1=0.8647 and Pvalserial2=0.9476.
5.5. Approximate Entropy Test
According to the test description, φ(m)=-1.7481, Φ(m+1)= -1.1043, ApEn(m)=0.6438, χ2=0.9874 and
Pvalent= 0.9954. If the computed P-value is < 0.01, then the sequence is concluded as non-random. 100
samples of the sequences are tested and their results for various tests are tabulated in Table 1, Table 2 and Table 3.
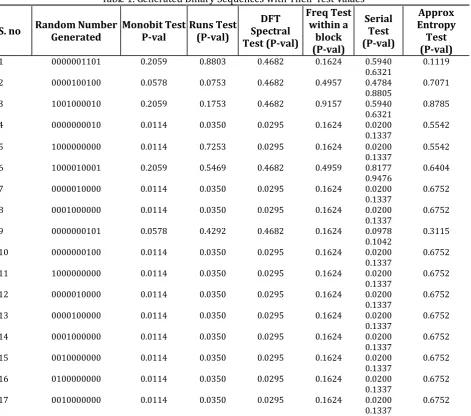
Table 1. Generated Binary Sequences with Their Test Values
S. no Random Number Generated Monobit TestP-val Runs Test(P-val) Spectral DFT Test (P-val)
Freq Test within a
block (P-val)
Serial Test (P-val)
Approx Entropy
Test (P-val) 1 0000001101 0.2059 0.8803 0.4682 0.1624 0.5940
0.6321 0.1119 2 0000100100 0.0578 0.0753 0.4682 0.4957 0.4784
0.8805 0.7071 3 1001000010 0.2059 0.1753 0.4682 0.9157 0.5940
0.6321 0.8785 4 0000000010 0.0114 0.0350 0.0295 0.1624 0.0200
0.1337 0.5542 5 1000000000 0.0114 0.7253 0.0295 0.1624 0.0200
0.1337 0.5542 6 1000010001 0.2059 0.5469 0.4682 0.4959 0.8177
0.9476 0.6404 7 0000010000 0.0114 0.0350 0.0295 0.1624 0.0200
0.1337 0.6752 8 0001000000 0.0114 0.0350 0.0295 0.1624 0.0200
0.1337 0.6752 9 0000000101 0.0578 0.4292 0.4682 0.1624 0.0978
0.1042 0.3115 10 0000000100 0.0114 0.0350 0.0295 0.1624 0.0200
0.1337 0.6752 11 1000000000 0.0114 0.0350 0.0295 0.1624 0.0200
0.1337 0.6752 12 0000010000 0.0114 0.0350 0.0295 0.1624 0.0200
0.1337 0.6752 13 0000100000 0.0114 0.0350 0.0295 0.1624 0.0200
0.1337 0.6752 14 0001000000 0.0114 0.0350 0.0295 0.1624 0.0200
0.1337 0.6752 15 0010000000 0.0114 0.0350 0.0295 0.1624 0.0200
0.1337 0.6752 16 0100000000 0.0114 0.0350 0.0295 0.1624 0.0200
0.1337 0.6752 17 0010000000 0.0114 0.0350 0.0295 0.1624 0.0200
18 0000000010 0.0114 0.0350 0.0295 0.1624 0.0200
0.1337 0.6752 19 0001000000 0.0114 0.0350 0.0295 0.1624 0.0200
0.1337 0.6752 20 0010010000 0.0578 0.0753 0.4682 0.4957 0.4784
0.8805 0.2160 21 1000010000 0.0578 0.4292 0.0295 0.4957 0.4784
0.8805 0.2160 22 0100000101 0.2059 0.1753 0.4682 0.4957 0.3716
0.3236 0.3811 23 0100000101 0.2059 0.1753 0.4682 0.4957 0.3716
0.3236 0.3811 24 0101010000 0.2059 0.0350 0.4682 0.9167 0.3716
0.5420 0.0080 25 0000000000 0.0160 0.0000 0.0295 0.9167 0.0006
0.0003 0.1167
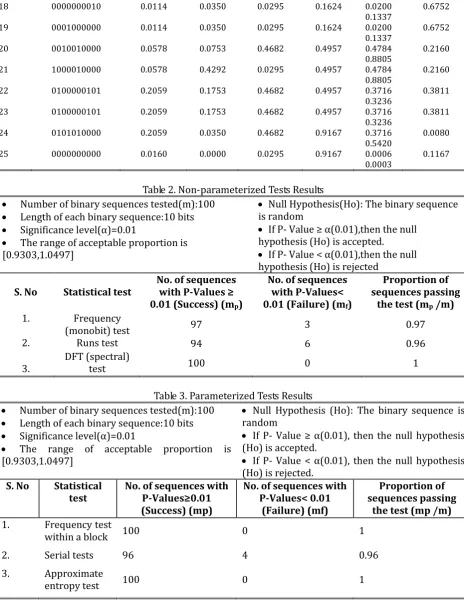
Table 2. Non-parameterized Tests Results Number of binary sequences tested(m):100
Length of each binary sequence:10 bits Significance level(α)=0.01
The range of acceptable proportion is [0.9303,1.0497]
Null Hypothesis(Ho): The binary sequence is random
If P- Value ≥ α(0.01),then the null hypothesis (Ho) is accepted.
If P- Value < α(0.01),then the null hypothesis (Ho) is rejected
S. No Statistical test No. of sequences with P-Values ≥ 0.01 (Success) (mp)
No. of sequences with P-Values< 0.01 (Failure) (mf)
Proportion of sequences passing
the test (mp/m)
1. Frequency
(monobit) test 97 3 0.97
2. Runs test 94 6 0.96
3. DFT (spectral) test 100 0 1
Table 3. Parameterized Tests Results Number of binary sequences tested(m):100
Length of each binary sequence:10 bits Significance level(α)=0.01
The range of acceptable proportion is [0.9303,1.0497]
Null Hypothesis (Ho): The binary sequence is random
If P- Value ≥ α(0.01), then the null hypothesis (Ho) is accepted.
If P- Value < α(0.01), then the null hypothesis (Ho) is rejected.
S. No Statistical
test No. of sequences with P-Values≥0.01 (Success) (mp)
No. of sequences with P-Values< 0.01
(Failure) (mf)
Proportion of sequences passing
the test (mp /m) 1. Frequency test
within a block 100 0 1
2. Serial tests 96 4 0.96
3. Approximate
entropy test 100 0 1
The various tests carried out to prove the randomness of the data clearly show that the computed proportion for each test lies inside the confidence interval. Hence, the tested binary sequences generated by the PRBG are random. The number of samples used for the test is 100 samples.
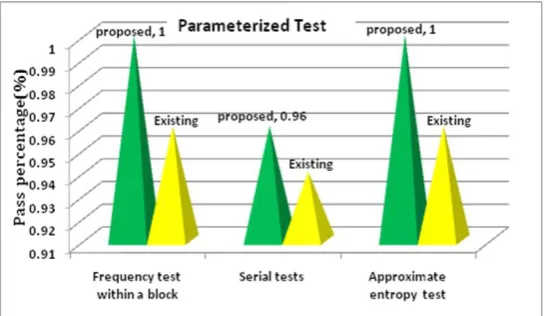
comparative result analysis is shown in Fig. 2 and Fig. 3 for Non-parameterized tests and parameterized tests respectively. The two tests such as runs test and serial test failed in the same sequence ,since both the tests depends on occurrence of overlapping m bit patterns. If the m bit has long runs of zeros, the test gives failure in random nature of bits. Due to this reason only, the same sequence failed in both the tests and give similar results. In parameterized test, serial test gives 96% result in randomness and 100% result in frequency test and approximate entropy test. Our previous method in non -parameterized test, runs test gives 94% success of the randomness and remaining two test such as frequency test and spectral test 96% and 98% result in randomness. In parameterized test, serial test gives 94% result in randomness and 96% result in frequency test and approximate entropy test. The result shows the better randomness of the CRBG with our previous work [6]. The experimental result shows that the generated sequences are truly random bits and pass through all the tests and produce high randomness. For simplification the length of the bit taken is 10 bits and significance level is 0.01. These random data are used in encryption methods to increase the security level.
Fig. 2. Randomness comparison of the generated sequences in non-parameterized tests.
Fig. 3. Randomness comparison of the generated sequences in parameterized tests.
6. Conclusion
tests developed to perceive the specific features of anticipated random bit sequences. The results of statistical testing are cheering and showed that the proposed PRBG has ideal cryptographic properties and better used in the design of new stream ciphers.
References
[1] Patidar, V., & Sud, K. K. (2009). A pseudo random bit generator Based on chaotic logistic map and its statistical testing.Informatica, 33(4), 441-452.
[2] Menezes, J. A., Oorschot, C. P. V., & Vanstone, A. S. (1996).Handbook of Applied Cryptography. CRC Press. [3] Rukhin, A., Soto, J., Nechvatal, J., Smid, M., Barker, E., Leigh, S., Levenson, M., Vangel, M., Banks, D., Heckert,
A., Dray, J., Vo, S., & Bassham, E. L. (2010). A Statistical Test Suite for Random and Pseudorandom Number Generators for Cryptographic Applications(pp. 800-822). National Institute of Standards and Technology Special Publication.
[4] Yu, X. Y., Zhang, J., Ren, H. E., Xu, G. S., & Luo, X. Y. (2006). Chaotic image scrambling algorithm based on S-DES.Journal of Physics, Conference Series, 48, 349-353.
[5] Liu, X., Zhang, J., Zhang, J., & He, X. (2008). A new chaotic image scrambling algorithm based on dynamic twice interval-division. Proceedings of the International conference on Computer Science and Software Engineering: Vol. 3. (pp. 818-821).
[6] Tamilselvi, R., & Ravindran, G. (2015, June). Image encryption using pseudo random bit generator based on logistic maps with radon transform.Indian Journal of Sci. and Technology, 8(11).